
Abstract
Objectives
The rising of new cases and death counts from the mpox virus (MPV) is alarming. In order to mitigate the impact of the MPV it is essential to have information of the virus's future position using more precise time series and stochastic models. In this present study, a hybrid forecasting system has been developed for new cases and death counts for MPV infection using the world daily cumulative confirmed and death series.
Methods
The original cumulative series was decomposed into new two subseries, such as a trend component and a stochastic series using the Hodrick–Prescott filter. To assess the efficacy of the proposed models, a comparative analysis with several widely recognized benchmark models, including auto-regressive (AR) model, auto-regressive moving average (ARMA) model, non-parametric auto-regressive (NPAR) model and artificial neural network (ANN), was performed.
Results
The introduction of two novel hybrid models,
Conclusion
The new models developed can be implemented in forecasting other diseases in the future. To address the current situation effectively, governments and stakeholders must implement significant changes to ensure strict adherence to standard operating procedures (SOPs) by the public. Given the anticipated continuation of increasing trends in the coming days, these measures are essential for mitigating the impact of the outbreak.
Introduction
Mathematical modelling has become a useful tool for understanding the spread and transmission of infectious diseases such as mpox. 1 In recent years, there has been a growing body of literature on the mathematical modelling of mpox. The first studies on the mathematical modelling of mpox focused on understanding the basic dynamics of the disease. These models typically used simple compartmental models, such as Susceptible–Exposed–Infectious–Recovered (SEIR) models, to describe the flow of individuals between different states of infection. These models were used to estimate the basic reproductive number of the disease, which represents the average number of secondary cases generated by a single primary case in a fully susceptible population. 1
More recent studies have expanded on these basic models to incorporate more realistic and complex dynamics. For example, some studies have incorporated demographic factors, such as age structure and population mixing patterns, to better understand the transmission dynamics of mpox. Other studies have considered the impact of interventions, such as vaccination or treatment, on the spread of the disease. One area of particular interest has been the potential for cross-species transmission of mpox from animals to humans. 2
Mathematical models have been used to estimate the risk of zoonotic transmission and to explore the potential impact of control measures, such as vaccination of wildlife populations, on reducing the risk of transmission. Overall, the literature on the mathematical modelling of mpox has made significant contributions to our understanding of the dynamics of the disease. These models have provided valuable insights into the transmission dynamics and have helped inform the design of control and intervention strategies. However, there is still much to be learnt about the epidemiology of mpox, and on-going research in this field is needed to further refine our understanding of the disease.
Mathematical models are used to simulate the transmission dynamics of the disease and to predict the number of cases in a population. The models take into account various factors such as the incubation period of the virus, the rate of transmission and the susceptibility of individuals in the population. Different types of models can be used to study mpox, including compartmental models, network models and spatial models. Compartmental models divide the population into groups based on their infection status, while network models consider the interactions between individuals in the population. Spatial models take into account the geographical distribution of the disease and the movement of infected individuals. The results of these models can inform public health interventions and strategies to prevent the spread of mpox. 3 For example, they can help identify high-risk populations and areas and guide resource allocation for disease control and prevention efforts. 4
It is important to note that while modelling can provide valuable insights into the spread and impact of mpox, it is only one aspect of a comprehensive approach to disease control and prevention. 5 It is essential to complement modelling with other methods, such as surveillance, laboratory testing and vaccine deployment, to effectively control and prevent the spread of the disease.
This cutting-edge study suggests a novel hybrid strategy for improving the daily cumulative confirmed and fatality counts of mpox predicting accuracy. The proposed methodology is based on a filter and different linear and nonlinear time series models. To accomplish this, using the Hodrick–Prescott filter, the initial time series of cumulative confirmed cases and death counts is divided into two new subseries: the nonlinear long-term trend series and a residual series. Four well-known time series models, including the auto-regressive (AR), auto-regressive moving average (ARMA), non-parametric auto-regressive (NPAR) and artificial neural networks (ANN), as well as all of their conceivable model combinations, were taken into consideration to predict the filtered subseries. In order to get the final estimates for mpox that were one day ahead of the total number of confirmed cases and death cases, the different prediction models were immediately combined. The introduction of this new hybrid approach proposed based on filtering and various combinations of linear and nonlinear time series models will improve the accuracy of time series modelling and forecasting in infectious disease modelling and forecasting. This will be an essential contribution to literature. Once more, the suggested approach can be generalized and evaluated for different data sets related to infectious diseases, such as COVID-19 confirmed cases, death counts and recovered cases just as it were implemented in.6,7 It can also be applied in all areas where time series modelling is implemented.
The rest of the work is organized as follows. Section 2 provides an overview of the literature review and related studies. The general methodology of the suggested hybrid forecasting method is described in Section 3. The suggested modelling methodology is empirically tested in Section 4 utilizing a time series of daily mpox cumulative confirmed cases and deaths. Section 5 provides a discussion of the results and comparison with existing literature. Finally, Section 6 presents conclusions, limitations and future research directions.
Literature reviews and related works
According to the World Health Organization (WHO), mpox virus (MPV) presents similar symptoms to smallpox and can spread to all areas.8,9 In 1970, the first recorded case of human MPV infection was in a 9-month-old boy in the Democratic Republic of the Congo, as reported by the WHO 8 and the Centers for Disease Control and Prevention (CDC). 10 MPV has become one of the leading orthodox viruses that infect humans. Recently, the number of reported MPV cases increased significantly compared to previous decades.8,10 The CDC reports that as of 2 August 2022, there have been 25,391 confirmed cases of MPV globally, with 25,047 instances in nonendemic regions (countries without a history of recorded cases) and 344 cases in endemic regions (countries with a history of documented cases). 10 Although the main source of the presence of MPV in humans is currently unknown, studies have proposed that animals such as rodents and non-human primates may be potential reservoirs.8,10 Globally, there have been a total of 21,099 confirmed cases as of 28 July 2022. Similar to this, 42 nations in the five WHO regions have also recorded one fatality from MPV infection. 8
Ninety-eight percent of the confirmed cases, or the majority of them, have been recorded after May 2022. The MPV has had a significant impact on people's lives and the global economy, particularly in respect of the management of the infection and the lookout for efficient local or national initiatives. There are several mathematical and statistical models and techniques that have been successfully utilized to study how epidemic illnesses and pandemics behave. In 11 researchers conducted a study to forecast human mpox based on human judgement utilizing probabilistic models. They suggested that forecasting based on human judgement can generate probabilistic predictions for public health importance.
In 12 a comparative analysis between machine learning and classical time series models was used to forecast the mpox cumulative cases. This result showed that the machine learning model outperformed the classical time series model in forecasting the cumulative MPV cases. 13 used five different time series and machine learning techniques to forecast the cumulative human mpox cases. The authors found that the neural prophet model achieved a high level of accuracy compared to the other models. Multiple candidate ARIMA models have been used to predict human mpox phenomena utilizing the Akaike information criteria (AIC), root mean square error (RMSE) and mean absolute error (MAE) as goodness of fit. 14 In comparison, ARIMA (5, 2, 3) emerged as the best fit for the daily confirmed cases. 14
A short forecast of the mpox cases presented in 15 utilized the ensemble n-sub-epidemic modelling based on a 10-week calibration. The results showed a global downward trend in mpox. The work of 16 found an association between mpox and metrological factors. The authors assumed that temperature, relative humidity, precipitation, wind speed, surface pressure and dew point are significant factors in the increasing phenomena of mpox cases. They utilized the auto-regressive integrated moving average with exogenous variable (ARIMAX) model to find the association between the factors and seasonal exponential smoothing (SES), ARIMA and prophet models to forecast the cumulative cases. Based on the revealed results, the authors found that temperature, surface pressure and relative humidity have a significant relation with the increasing phenomena of mpox cases.
The prediction of many chronic diseases has regularly employed both machine learning and traditional statistical methods.17,18 For example, in 19 the authors analysed and forecasted the mpox outbreak based on some statistical models by shedding light on hair forecasting phenomena through which the prophet model was found effective. 20 used machine learning and power law distribution algorithms to achieve a similar result. The results revealed that the methods based on machine learning may perform well in predicting and forecasting mpox cases. Their work shed light on modelling and predicting the spread of mpox in the United States of America (USA).
For the authors in 21 , they used neural network time series models and compared them with long-short-term memory and GRU models by utilizing the augmented dynamic adaptive model (ADAM) optimizer. Their results revealed that the ANN model performed well than the other models in prediction of the spread of mpox in the USA, thereby proposing a machine and stacking learning techniques to forecast the transmission of mpox outbreaks. 22 compared the proposed stacking ensemble learning (SEL) technique with AdaBoost, random forest (RF), GBOOST, least absolute shrinkage and selection operator (LASSO), ridge, and ordinary least squares (OLS) to forecast the transmission of mpox using key performance indicators (KPI) such as RMSE, MAE and mean square error (MSE). The study found that the proposed SEL technique outperformed the others. 22
In 23 the ARIMA model was utilized to model and forecast the mpox cases for those countries that have the highest infection rate. The results showed that the ARIMA model pointed to an increasing trend in USA, Spain, Germany, England, and France for the upcoming days. However, 24 used seasonal ARIMA (SARIMA) and ARIMA to model and forecast mpox cumulative cases for a short-term period, with the SARIMA model achieving the highest accuracy than the ARIMA model in modelling and forecasting confirmed and cumulative cases.
A comparative analysis between machine learning and classical time series methods using ARIMA, RF, logistic regression (LR), decision tree (DT), ensemble network (EN), ANN, and convolutional neural network (CNN) have been performed with the CNN model outperforming the other existing models. 25 Countless deep convolutional neural network (DCNN) models have also been used in the detection as well as prediction of mpox with significant accuracy.26–28 Other models, like transfer learning models, have also been implemented in mpox detection and classification. 29
Hybrid models have been widely used in disease forecasting.30,31 It has been implemented in modelling and forecasting dengue fever infection. 32,33 conducted a review study on hybrid methodologies applied to epidemics. They concluded that by using the appropriate methods that are suitable to the data, one can achieve consistent results in modelling and predicting any series of an epidemic. For more epidemic hybrid time series forecasting, see, for example, 34–42.
Materials and methods
Data
This study utilized world daily cumulative new cases and death counts of MPV for all analysis. The data set was extracted from Our World in Data website. 43 The data set of total confirmed cases spans from 6 May 2022 to 3 January 2023, and the total death counts are over the range from 15 July 2022 to 3 January 2023. The graphical presentation of both series, cumulative new cases and death counts, can be seen in Figure 1. The complete data set of cumulative new cases covers 248 days, which, from 6 May 2022 to 15 November 2022 (199 days), was used to train the model, while from 16 November to 3 January 2023 (49 days) was used for cumulative new case day-ahead post-sample (testing) prediction. On the other hand, the death counts covered 213 days, of which, from 5 July 2022 to 21 November 2022, a total of 170 days were used for model estimation and from 22 November to 3 January 2023 (43 days) for cumulative death counts day-ahead post-sample (testing) prediction. The summary of the data is provided in Table 1.

World mpox virus data: cumulative time series new cases (a) and cumulative time series death counts (b) over the period of 1 May 2022 to 3 January 2023.
Descriptive statistics of the data.

The following subsections detail our inferences about the outcomes from different perceptions.
Methods
Proposed hybrid forecasting system
This section explains the proposed hybrid forecasting methods for cumulative new cases and death counts globally. Generally, the cumulative time series includes an increasing linear or nonlinear long-run trend component. To do this, the cumulative new cases series (

Hodrick–Prescott filter
A smoothed curve representation of a time series that is more complex to long-term variations than to short-term fluctuations is obtained by using the HPF.
44
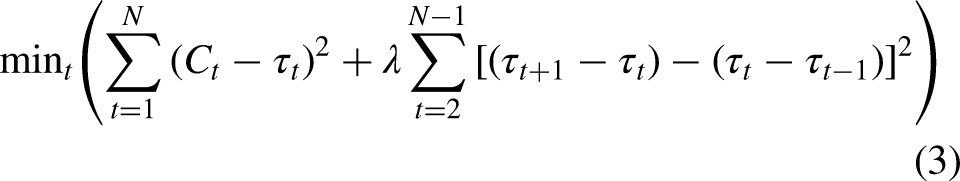
The adjustment of the sensitivity of the trend to short-term fluctuations is achieved by modifying a multiplier 
For a visual representation of the HPF's performance, the new subseries decomposed are shown in Figure 2: first, the cumulative series of new cases and second the trend (
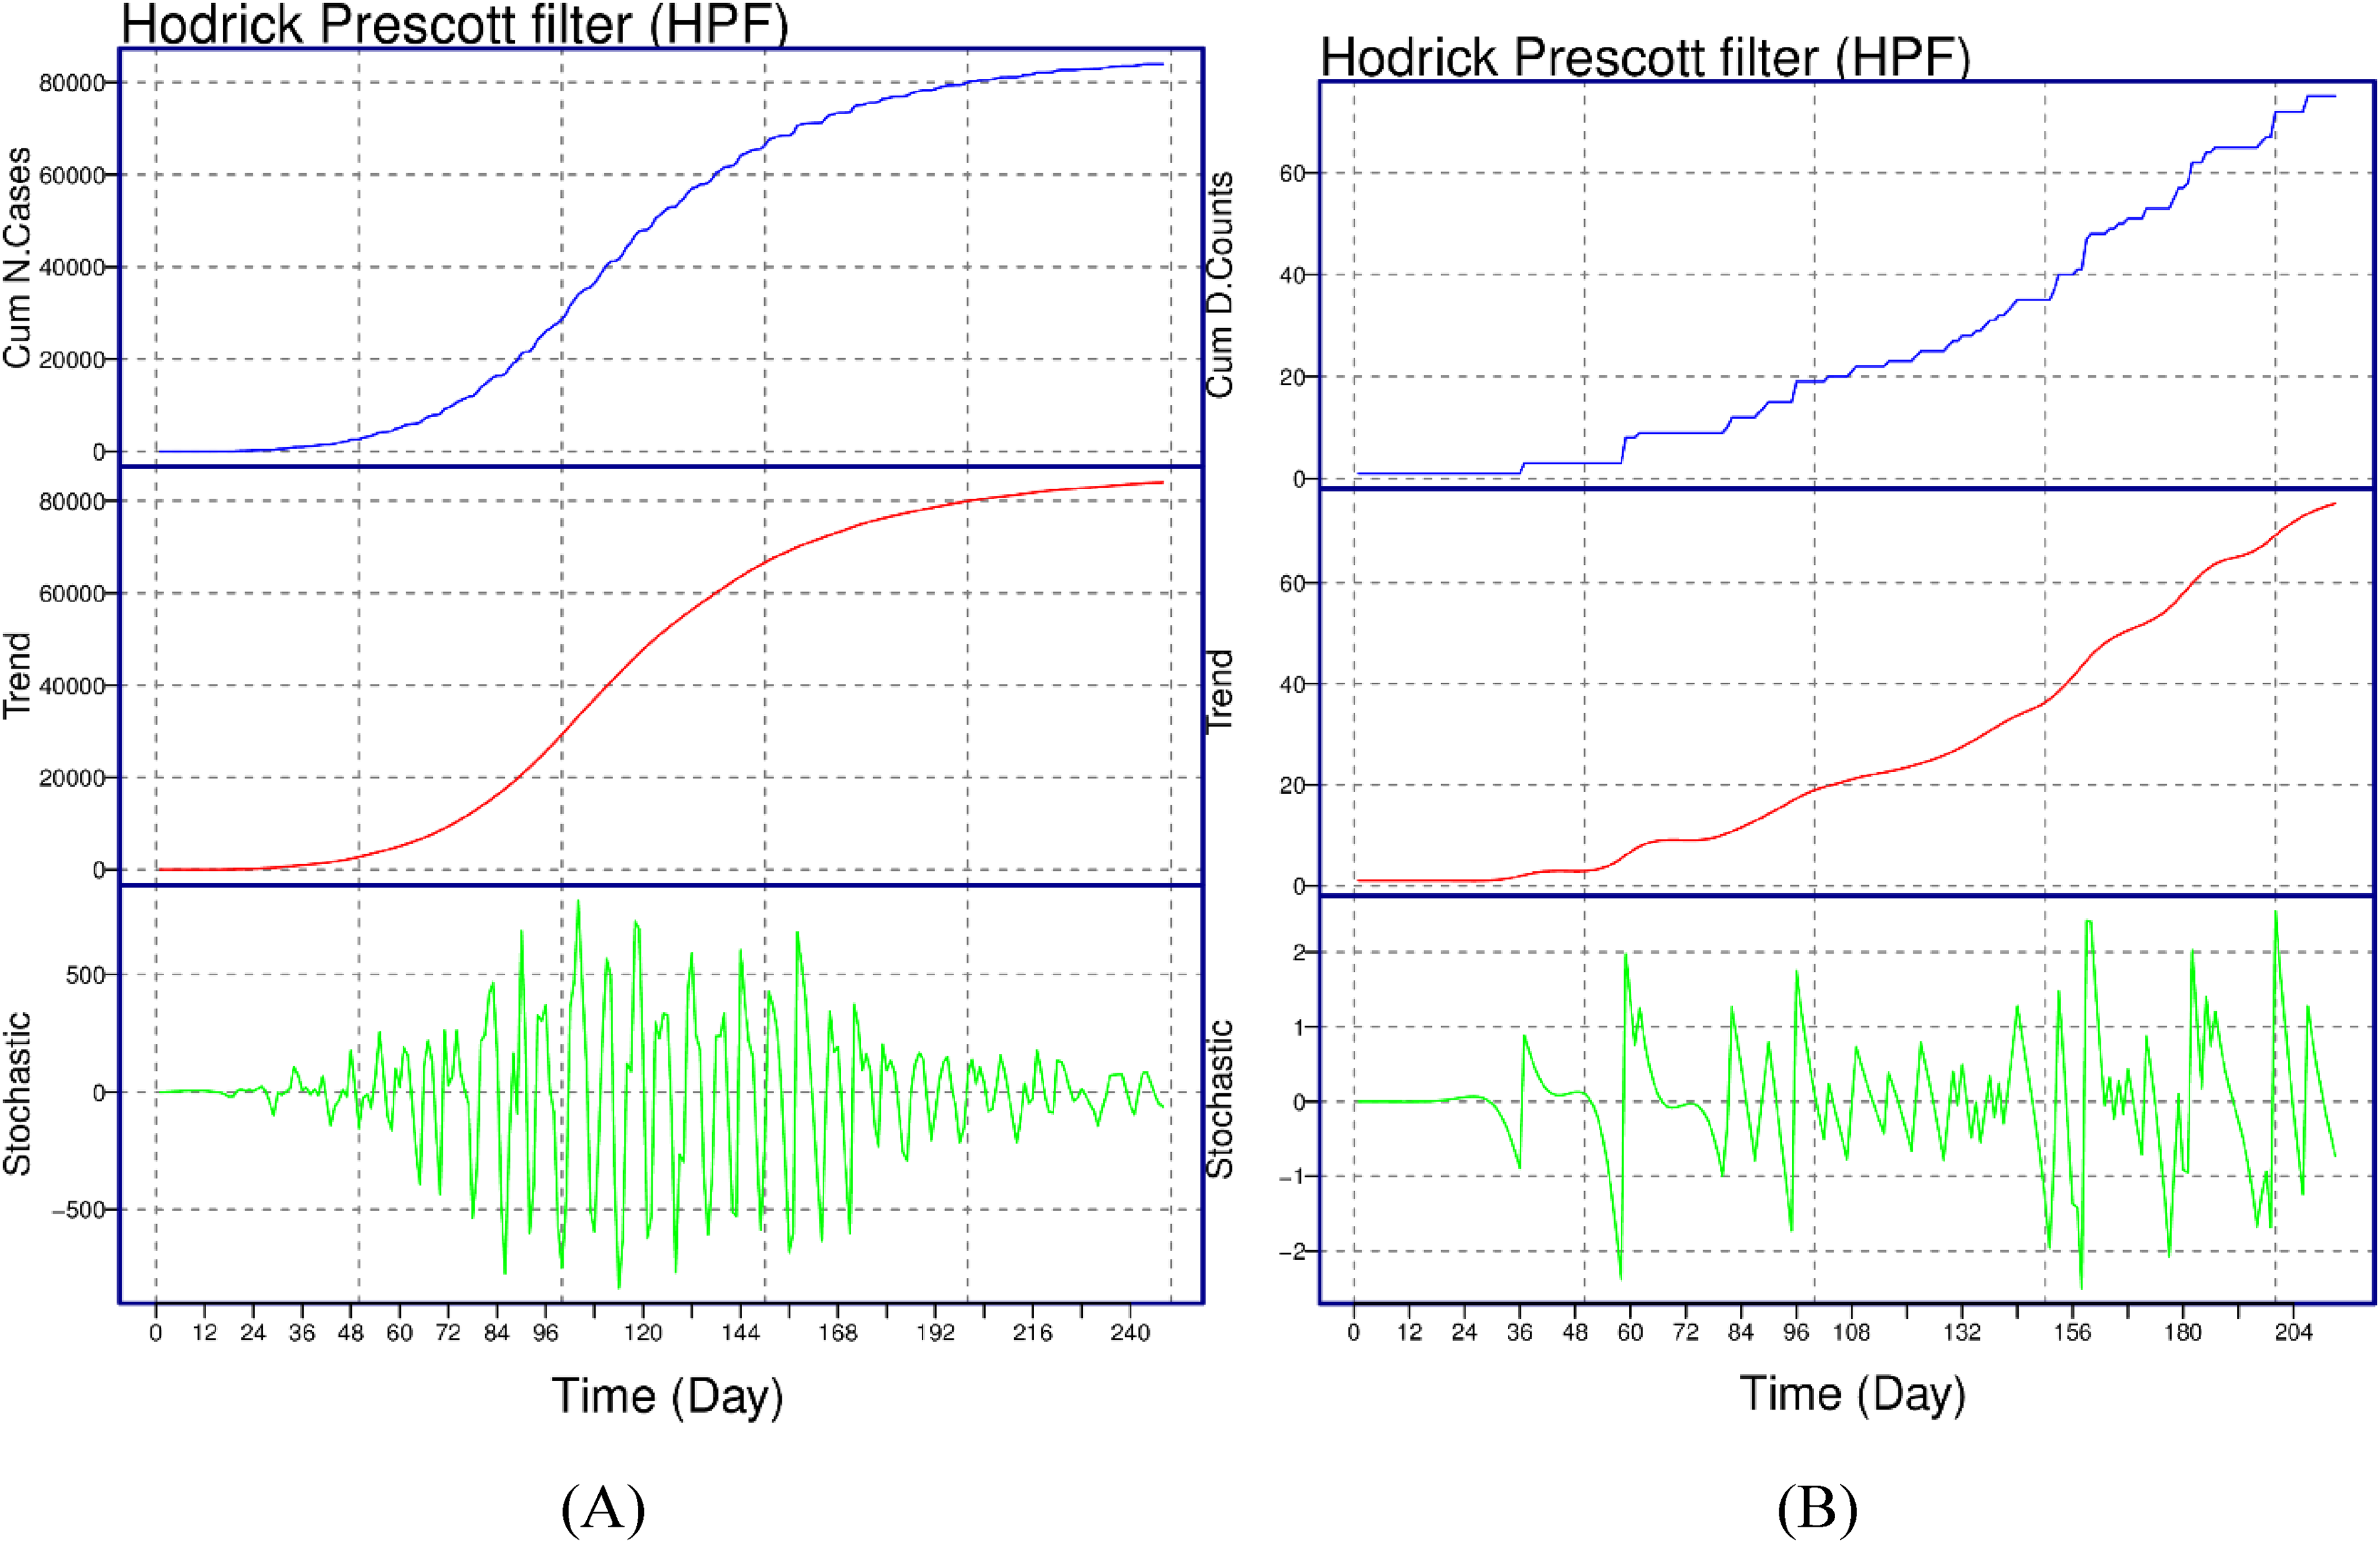
World mpox virus data: The daily cumulative confirmed cases and death counts of the monkeypox virus are filtered by the HPF. Within each subfigure, the top panel shows the daily cumulative confirmed cases and death counts (blue curve), the middle panels show the long-term trend (red curve) and the bottom panels show the stochastic part (green curve).
Modelling and comparison of the decomposed components
Once the components are extracted from the cumulative new cases series (
Auto-regressive model
A linear and parametric auto-regressive (AR) process describes the short-term dynamics of 
Auto-regressive moving average model
The ARMA model not solely incorporates the past values of the target variable but also utilizes important information in the form of moving average(s). In the recent case, the study variable Ct is explained by the previous n terms, the lagged values of residuals as well.
42
Mathematically,
Non-parametric auto-regressive model
The additive non-parametric counterpart of the AR process results in the additive model (NPAR), where the link between 
Artificial neural network
To model a wide range of nonlinear issues, ANNs are adaptable computing frameworks. In comparison to other nonlinear models, the main benefit of ANN is its ability to approximate a variety of functions with greater accuracy. Due to the concurrent processing of the data, they are efficient. The process of model building does not relate to acquire any information of the models’ form. However, the data characteristic plays a key role in establishing the network model. The multilayer perceptron (MLP), especially with one hidden layer, is one of the most often used ANN types for time series modelling and forecasting.
46
The network that establishes the model is composed of three layers of basic processing units connected by cyclic linkages. The following equation is used to denote the link between output 
For evaluating the prediction accuracy, three accuracy measure criteria, namely, MAPE, MAE and RMSE, for each combination model are computed6,7,44 as follows:


Flow chart of the proposed modelling procedure for global confirmed cumulative new and death cases mpox infection.
Results
To determine the efficient model among the proposed combined models for cumulative new cases, three standard key performance indicators were computed, and the results were presented in Table 2. Table 2 indicates that the 

World mpox data: out-of-sample cumulative new cases for day-ahead mean forecast error for all combination models.

The DM is applied to each combination of the models.
52
The DM test outputs (p-value) are demonstrated in Table 3. We rejected the null hypothesis at a 5% level of significance. The output shows that among all possible combinations of the models in Table 2, the
World mpox infection data: p-value of the DM test using the loss-squared function.

Graphical representation of the accuracy measures (MAE, MAPE and RMSE) for all possible combinations of the models is shown in Figure 4, wherein RMSE and MAE (top box plot), and the MAPE is (bottom box plot). From these plots, we can see that the
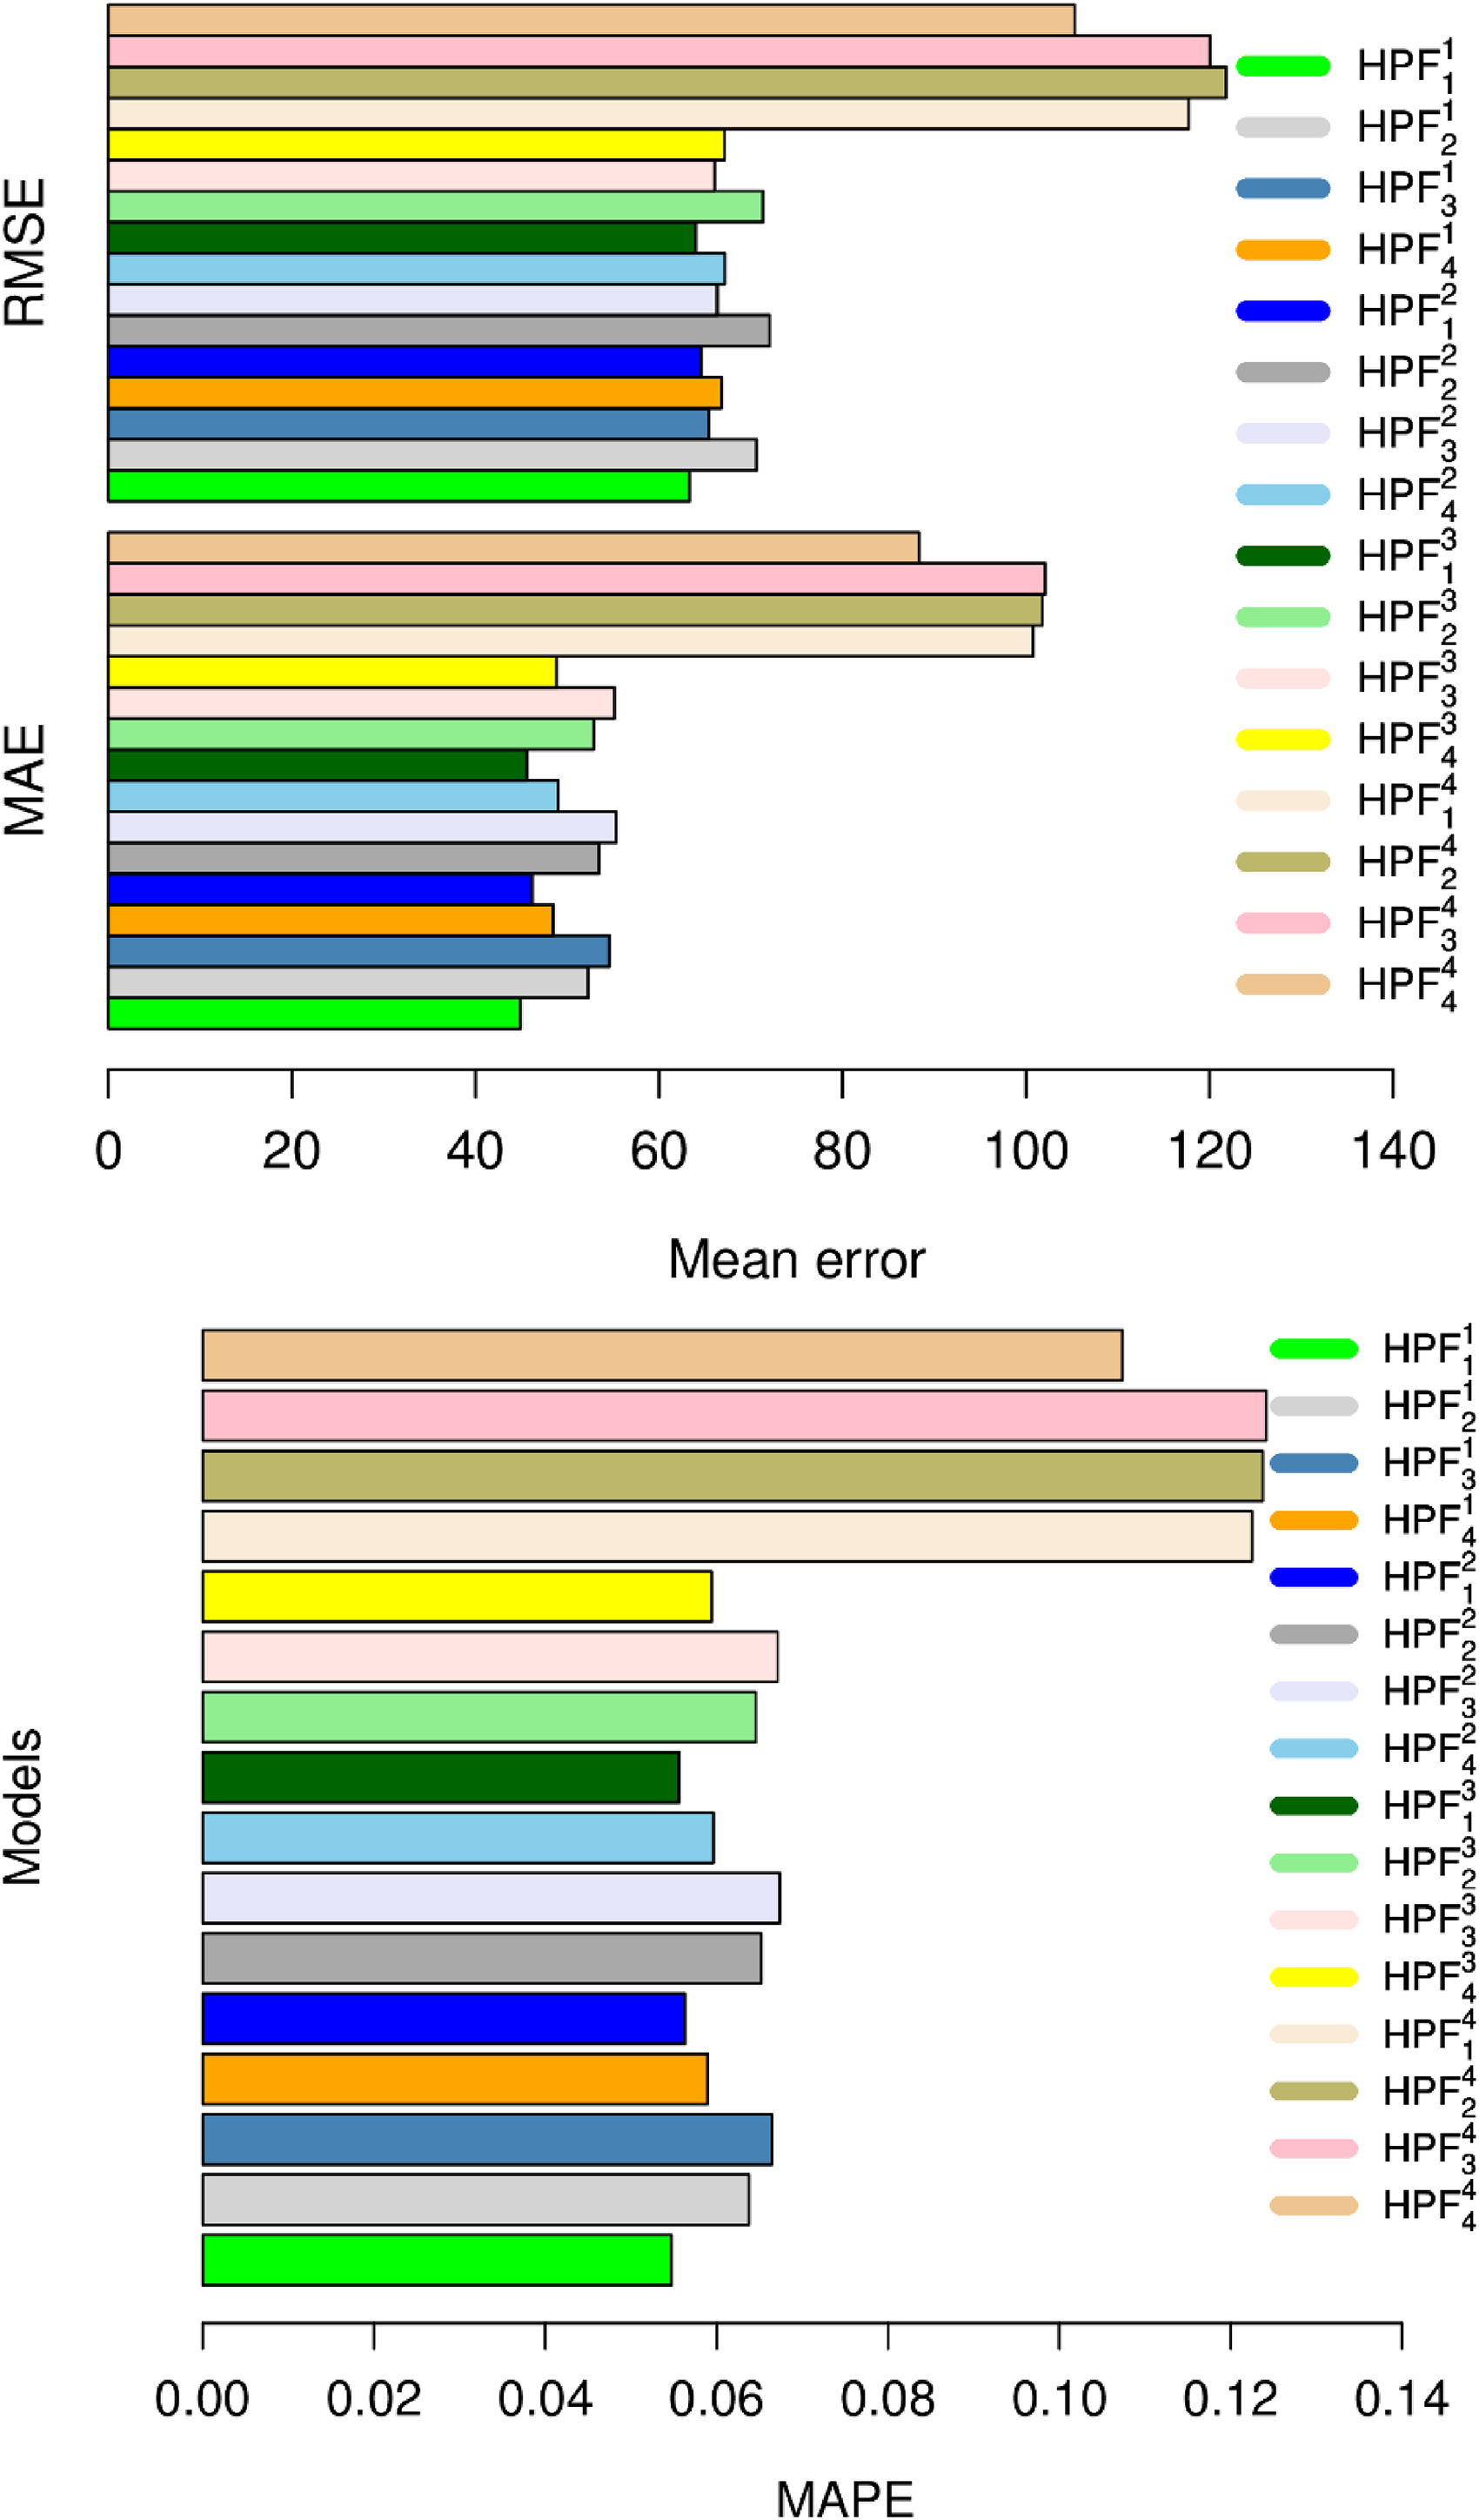
Graphical representation of accuracy measures (MAE, MAPE and RMSE) hybrid models for new cases of global mpox cases. The RMSE and MAE are presented in top box plot, while the MAPE is presented in the bottom box plot.
On the other hand, Figure 5 shows the correlation plots for the other four best models. From Figure 5, the model with the highest correlation value is acknowledged as the best model since it has the highest correlation value between the observed and predicted values. 53 ,54 Additionally, Figure 6 shows the observed and predicted values for the three best models. In light of the descriptive statistics, statistically significant tests and exploratory findings, the suggested hybrid system performs better than all previous models for predicting the novel MPV case from all angles.

Correlation plots for four other models for cumulative new global mpox cases.

The observed and predicted values for the three best models for cumulative new global mpox cases.
To choose which model is efficient among the proposed combined models for cumulative death counts, accuracy measures are calculated and presented in Table 4. The results in Table 4 indicate that the
World mpox death data: out-of-sample cumulative death counts day-ahead mean forecast error for all combination models.

Comparison of the proposed best model and the benchmark models: out-of-sample cumulative new counts day-ahead mean forecast error.

World mpox virus data: p-values of the DM test using the loss-squared function for cumulative new cases.

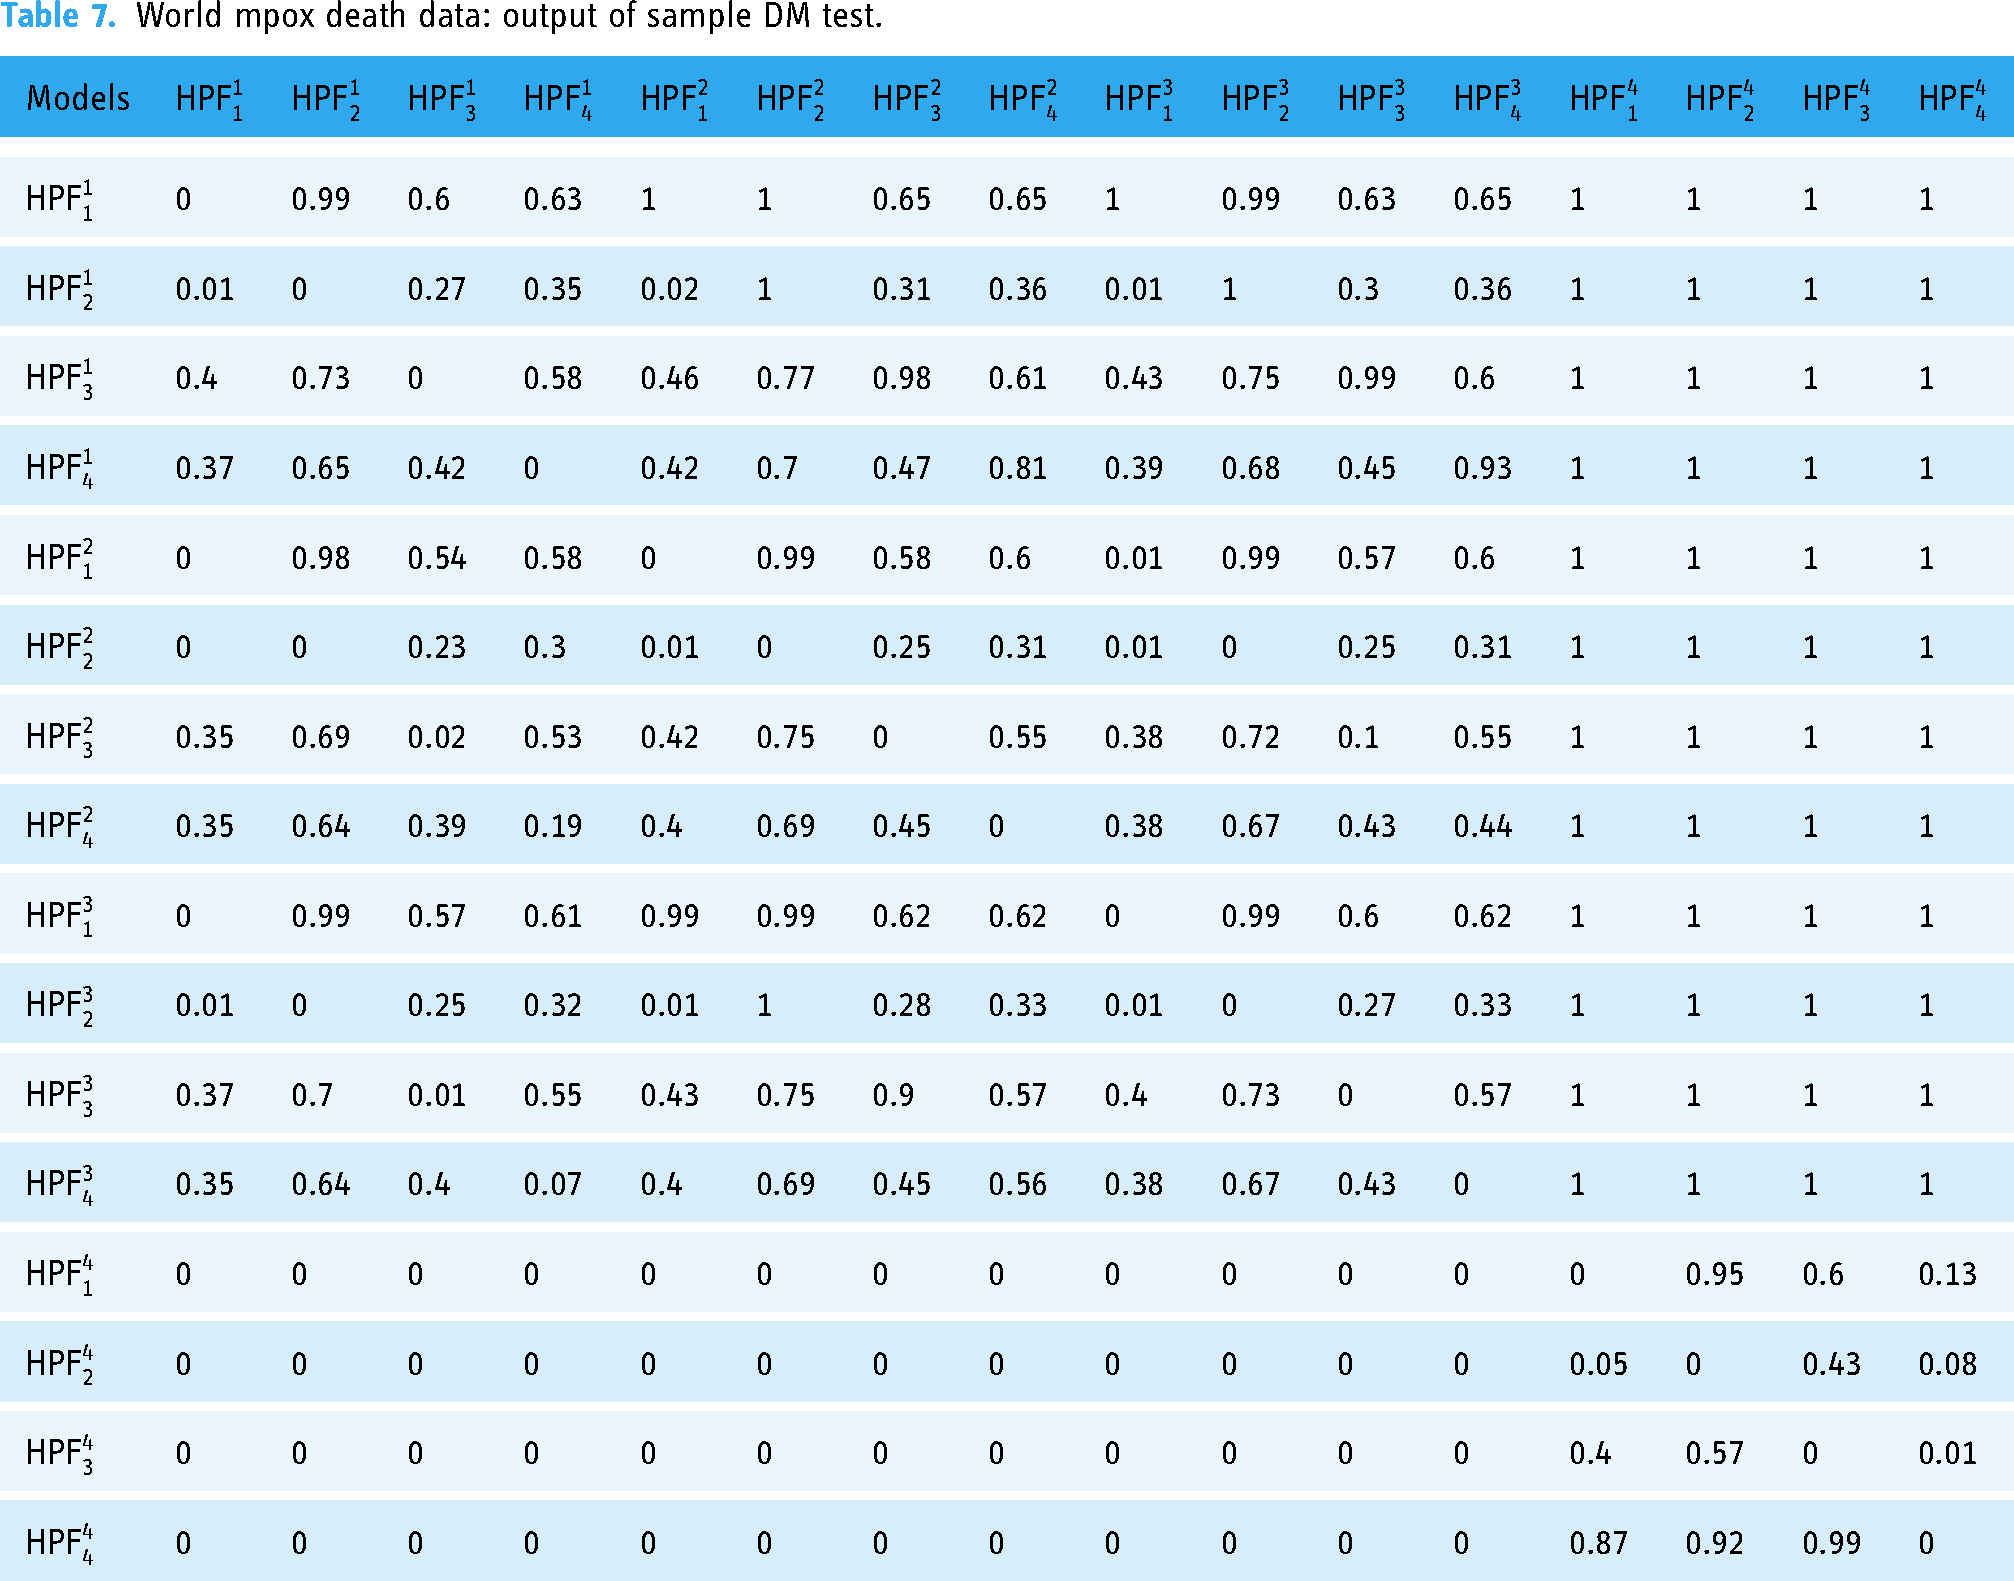
To check the efficiency of the best model listed in Table 4, the DM test is applied to each combination of the model.
52
Table 7 displays the results of the DM test. The hypothesis here is the same as that in Table 3. Table 7 shows that among all combination models in Table 4, the

Graphical representation of accuracy measures (RMSE, MAE and MAPE) hybrid models for global death mpox cases.

Correlation plots for four other models for cumulative death global mpox cases.

The observed and predicted values for the three best models for cumulative global death mpox cases.
World mpox death data: output of sample DM test.
Comparison of the proposed best model and the benchmark models: out-of-sample cumulative death counts day-ahead mean forecast error.

World mpox virus data: p-values of the DM test using the loss-squared function for cumulative death cases.

Table 10 presents a short forecast of the confirmed global mpox new cases and death counts. The results point to marginal new cases and significantly low deaths.
World mpox virus data: the forecasted new cumulative cases and death counts using the best proposed model over 2 weeks.

Discussion
This study introduced a valuable contribution to the field of disease prediction by presenting two innovative hybrid models, namely,
Our results proved to be superior to the results in 25 where the same data sets were used. Again, they were of the view that ARIMA is satisfactory for forecasting cases of MPV, which vehemently contract our results. Again, our mean error values are far better than those obtained in 25 . Again, our results contradict the results in 24 where SARIMA and ARIMA were used for forecasting. Just like in 25 , our mean error values were far better than those obtained in 24 .
More so, our hybrid models again performed way better than the raw machine learning time series model, ANN model, model-free and all other models implemented in the analysis and forecasting of MPV in 19–22 and 12–15, respectively. Again, our forecasted values are more precise and accurate than those presented in these works.
This study plays a pivotal role in advancing the understanding of hybrid forecasting methodologies and, specifically, their application in predicting mpox outbreak trends. By shedding light on their accuracy and efficiency, the study contributes substantially to the field of infectious disease modelling and serves as a stepping stone toward more precise and effective forecasting tools for public health emergencies.
Conclusions
In the disease prediction analysis, the decomposition of the original cumulative series has been done for the very first time by filtering method; then to enhance the forecasting performance, different linear and nonlinear time series models were compared for the best results, and the suggested model can be applied for disease deaths and cases in the future. The study proposed a new hybrid forecasting system for predicting MPV new cases and deaths worldwide. The original cumulative series was decomposed into trend and stochastic subseries using the Hodrick–Prescott filter. Two linear and two nonlinear time series models were considered to forecast the decomposed subseries, resulting in a total of 16 models in the hybrid system. Performance evaluation involved three standard mean errors, graphical analysis and the Diebold and Mariano test. The
Limitations of the study
The study is limited to cumulatively confirmed cases and death counts for mpox data; however it might be broadened to incorporate more elements like daily infection case counts and daily death rates. This would allow for the evaluation of the proposed hybrid time series forecasting system's performance. Additionally, the algorithm might be used to forecast COVID-19 confirmed cases, deaths and recovered cases over the next several days. Despite the fact that the suggested system only utilizes univariate linear and nonlinear time series models, in the future, multivariate time series models and machine learning models such as vector auto-regressive, vector ARIMA, ANN, support vector regression model, random forest and decision tree learning models can be incorporated.
Footnotes
Acknowledgements
Contributorship
All authors contributed to the conceptualization, validation and visualization of the study. HI, MQ, MD and KT were involved in the data curation, formal analysis and methodology. HI, MQ, MD, and KT were responsible for the writing of the original draft. MD, KT, RKA, and JKA were involved in the writing of the review and editing. All listed authors contributed to the manuscript, approved its claims and agreed to be authors. All authors meet the ICMJE criteria.
Declaration of conflicting interest
The authors declared no potential conflicts of interest with respect to the research, authorship and/or publication of this article.
Funding
The authors received no financial support for the research, authorship and/or publication of this article.
Guarantor
KT.