
Abstract
Background
Bloodstream infection (BSI) contributed significant mortality among patients in the intensive care unit (ICU). Traditional machine learning (ML) models often struggle to effectively capture complex temporal dependencies in high-dimensional data. The aim of this study was to develop a deep learning model transformer in the prediction of ICU-acquired BSI based on time series data.
Methods
Patients' electronic health records, whose all blood cultures (BC) collected 48 h after admission to the ICU, were extracted from Medical Information Mart for Intensive Care IV (MIMIC IV). The synthetic minority over-sampling technique (SMOTE) was applied to balance the dataset. We collected age, gender, vital signs and laboratory measures for consecutive 24 h with 1 hour interval. We also set three prediction windows (0, 12 and 24 h) to investigate the ability of early detection of the ML. The performances of the transformer and the CatBoost were evaluated by discrimination and calibration. Shapley Additive exPlanation (SHAP) was employed to identify key features.
Results
A total of 2408 patients were included in the study, of which 149 (6.2%) had an ICU-acquired BSI. The transformer model outperformed CatBoost at all prediction windows. At the 24-hour window, the Transformer achieved an AUROC of 0.918 and an AUPRC of 0.915, while CatBoost performance declined significantly with earlier prediction. SHAP values suggested that glucose, bicarbonate, mean blood pressure, temperature and blood urea nitrogen were top five early predictors.
Conclusion
The deep learning transformer using time series data demonstrates strong potential as a clinical decision support tool.
Keywords
Introduction
Bloodstream infections (BSIs) represent a severe and complex healthcare challenge, particularly in intensive care units (ICUs). ICU-acquired BSIs, defined as infections occurring more than 48 h after ICU admission, significantly impact patient outcomes. 1 Critically ill patients are especially predisposed to the occurrence of BSI with incidence of 5–7%,2,3 with associated mortality rates as high as 40–60%.4,5 Beyond mortality, BSIs prolong ICU stays and escalates healthcare costs, 6 underscoring the need for early diagnosis and timely antimicrobial therapy to improve prognosis. 3 Currently, blood culture (BC) remains the diagnostic gold standard for BSIs. However, its clinical utility is limited by prolonged turnaround times exceeding 24 h. 7 While biomarkers like procalcitonin and C-reactive protein offer rapid results, their predictive accuracy for culture positivity remains suboptimal.8,9 Molecular assays by polymerase chain reaction demonstrate high sensitivity in pathogen detection without prior incubation, yet their high cost restricts widespread adoption in clinical practice. 10
Recent advances in artificial intelligence (AI) have introduced machine learning (ML) as a promising tool for BSI prediction. With a rapid development of AI, studies on predicting BSIs by ML have emerged. Roimi et al. 11 and Bhavani et al. 12 leveraged electronic health records (EHRs) to develop ML models for ICU-acquired BSI and bacteremia prediction, respectively. Similarly, Boerman et al. employed gradient-boosted trees to forecast BC outcomes in emergency settings. 13 Despite these successes, conventional ML approaches face inherent limitations, including architectural constraints in backpropagation-based optimization and difficulties in processing high-dimensional, temporally dependent ICU data. 14
The sequential nature of ICU data renders traditional ML methods inadequate. 15 In contrast, deep learning (DL) architectures—enabled by advances in graphics processing unit computing—excel in modeling time-series data. Recurrent neural networks (RNNs) and long short-term memory networks, with their hierarchical structures and dense neuronal connections, have demonstrated exceptional capability in capturing temporal patterns. 16 However, RNNs suffer from performance degradation with long sequences due to fixed-length vector representations. The transformer architecture, incorporating self-attention mechanisms, has emerged as a state-of-the-art solution for sequence modeling. Its ability to capture multilevel temporal dependencies makes it particularly suited for ICU data analysis. 17 To our knowledge, no prior study has applied transformer-based DL models for ICU-acquired BSI prediction. In this study, we bridge this gap by developing a transformer network using time-series physiological data from the Medical Information Mart for Intensive Care IV (MIMIC IV) database to enable early detection of ICU-acquired BSIs.
Materials and methods
The methodology framework of the study is shown in Figure 1.

Patient data was extracted, comprising static variables and dynamic variables recorded at 1-h intervals. The stage of data processing involved handling data quality through outlier replacement (using the interquartile range method), imputation of missing values (using carry-forward and mean imputation), normalization, and addressing class imbalance via the synthetic minority oversampling technique (SMOTE). Then, the preprocessed multivariate time-series data was fed into the transformer model. The model was trained using a Bayesian optimization algorithm for hyperparameter tuning, with binary cross-entropy as the loss function, L2 regularization to prevent overfitting, and a sigmoid activation function in the final layer to output the probability of a positive bloodstream infection. Finally, the model's performance was comprehensively assessed using the area under the receiver operating characteristic curve (AUROC), the area under the precision-recall curve (AUPRC), the Brier score, and the F1-score.
Study population and data source
This was a retrospective study utilizing time-series EHR data from MIMIC IV database (version 2.2). MIMIC IV database contains 53,150 unique patient records at the Beth Israel Deaconess Medical Centre between 2008 and 2019. One author (J.-C.P.) has completed the online training course of the National Institutes of Health and obtained access to the database (record ID: 41046393).
Inclusion criteria were: (1) adult patients (age ≥18 years) admitted to an ICU; and (2) patients for whom all BCs were collected after the first 48 h of ICU admission. Exclusion criteria were: (1) patients under 18 years of age; (2) patients with no BCs drawn during the ICU stay; and (3) patients whose first BC was collected within the first 48 h of ICU admission.
Feature selection and data processing
From the MIMIC IV database, we systematically extracted 25 clinically relevant predictive variables, including demographic characteristics (age, gender), vital signs, and laboratory measurements. To ensure data quality and clinical relevance, laboratory results were included only if they met two criteria: (1) routine clinical collection and (2) measurement availability in >60% of the study population (Table S1 in Supplemental Material 1). Finally, a total of 25 predictive indicators were included for analysis (Table 1).
Static and dynamic variables included in the prediction model.

We extracted all records falling within the 48 h time window before the collection of BCs. All variables were obtained for each 1 h window to generate a complete dataset. For static demographic variables, they were considered constant over time. For dynamic variables, such as vital signs and laboratory results, mean value was used in case of multiple measurements within an hour. Carry-forward methods were employed for imputations when data for a particular time point was absent. Mean imputations were used for entirely missing features. We calculated the upper quartile (UQ), the lower quartile (LQ), and the interquartile range (IQR) for all the numerical features. Any data points exceeded outside the range of [LQ − 2.5IQR, UQ + 2.5IQR] were regarded as extreme values, which were replaced with UQ + 2.5IQR or LQ − 2.5IQR. All the data were standardized using a Z-score normalization.
Outcome
The outcome was a positive BC sample, which was defined as the growth of a clinically significant pathogen in at least one BC bottle after 48 h of admission to an ICU. Contaminants were identified and excluded according to the Center for Disease Control and Prevention: coagulase-negative staphylococci, Micrococcus species, Propionibacterium acnes, Corynebacterium species, Bacillus species, and Clostridium perfringens. The growth of commensals bacteria was considered positive if present on two or more blood specimens collected in the separated occasions with clinical signs of infection. However, in order to maximize the reliability of the label, it would be better to exclude these samples from the dataset.
Transformer model
The transformer architecture represents a paradigm shift in sequence modeling through its innovative self-attention mechanism. Unlike conventional approaches, this architecture enables parallel computation of cross-sequence correlations, allowing for comprehensive analysis of both local and global temporal dependencies within the input data. The self-attention mechanism dynamically weights the importance of different sequence elements, enabling the model to automatically focus computational resources on the most clinically relevant temporal patterns for prediction. Consequently, the transformer architecture successfully addresses two critical issues prevalent in traditional RNN models: information loss and gradient vanishing, thereby achieving superior performance in sequence modeling tasks. 18
The transformer block consists of input embedding network, multihead attention network and feed-forward network (FFN) (Figure 2).

Architecture of the proposed transformer model. The model consisted of a feature embedding layer, a positional encoding module, a multilevel transformer encoder, and an output prediction layer. It adopted the seq2vec encoding paradigm, effectively capturing the dynamic patterns and long-term dependencies in sequential data.
Input embedding layer
The temporal embedding network transforms raw input sequences into dense vector representations while preserving their chronological relationships. This layer encodes both the absolute and relative timing information of each data point through positional encoding, enabling the model to maintain awareness of temporal context throughout processing.
Multihead attention mechanism
Multihead attention operates on the principle of scaled dot-product attention, where each input feature is transformed into three distinct representations: the query vector (Q), the key vector (K), and the value vector (V). These vectors are generated by projecting the input through three separate learnable weight matrices, Wq, Wk, and Wv. The attention weights are computed using the following scaled dot-product operation, where dk denotes the dimensionality of the input vectors:
The multihead attention mechanism extends this process by employing h parallel attention heads. In each head, the input vectors undergo independent linear transformations, resulting in distinct sets of Q, K, and V vectors through head-specific projection matrices. This design enables the model to jointly attend to information from different representation subspaces. All attention heads process their inputs simultaneously, and their outputs are subsequently concatenated to form the final representation.
Feed-forward network
This architecture enables simultaneous processing of all sequence positions while maintaining the awareness of temporal relationships through the attention mechanism and positional encodings. The FFN consists of two linear transformations with a ReLU activation in between, which is calculated as follows:
Model development, validation, and performance
Our modeling approach consisted of two phases: first, we established a transformer network using a 24-h observation window preceding BC collections. Second, we evaluated the model's potential as an early warning system by creating two predictive windows at 12 and 24-h intervals before BC collections (Figure 3). The patient cohort from the MIMIC IV database was randomly divided into training (70%) and testing (30%) sets. Hyperparameter optimization was performed using a Bayesian optimization algorithm, with detailed search spaces and selected values provided in Table S2 in Supplemental material 1. We applied L2 weight decay regularization to prevent overfitting and chose binary cross entropy as the loss function. The output of the neurons was activated through the sigmoid function in the final layer to produce the probability of outcome. For comparison, we developed a CatBoost model, 19 a gradient-boosting framework particularly effective for handling categorical features through ordered boosting and gradient-based optimization. The CatBoost implementation used averaged values of dynamic variables within the observation window.

An illustration of the observation and prediction window to predict the outcomes of blood cultures in the ICU: (a) observation window 24 h without prediction window; (b) observation window 24 h with prediction window 12 h; (c) observation window 24 h with prediction window 24 h.
To address the substantial class imbalance in our dataset, we implemented the synthetic minority oversampling technique (SMOTE). 20 The algorithm operates through the following steps: first, for each minority class instance xi, we compute the Euclidean distances to all other minority samples to identify its k-nearest neighbors. Then, based on the predetermined sampling ratio that reflects the degree of class imbalance, the algorithm generates synthetic samples by interpolating between xi and its randomly selected neighbors. Specifically, each new synthetic sample xnew is created using the formula: xnew = xi + rand(0, 1) × (xj − xi), where xj denotes a randomly chosen nearest neighbor of xi. This approach effectively expands the minority class representation while preserving the underlying feature space characteristics.
We employed a comprehensive evaluation framework to assess model performance across multiple dimensions. For discrimination capability, we calculated both the area under the receiver operating characteristic curve (AUROC) and the area under the precision-recall curve (AUPRC), with the latter being particularly informative for imbalanced datasets. Model calibration was evaluated through two complementary approaches: visual inspection of calibration plots and quantitative measurement using Brier scores (range: 0–1, where 0 indicates perfect calibration). Additionally, to characterize performance at clinically relevant decision thresholds, we computed four key operational metrics: precision, recall, accuracy, and the F1-score. This multifaceted assessment strategy provides both global performance characterization and practical operational insights:

Model interpretation
We used the Shapley Additive exPlanation (SHAP) for model interpretation. 21 SHAP is a unified framework for interpreting ML model predictions by quantifying feature importance. As a model-agnostic approach, it evaluates the contribution of each feature to individual predictions by computing its SHAP values from the cooperative game theory. The SHAP value calculation involves training multiple models with different feature combinations to isolate each feature's marginal contribution. A positive SHAP value indicates that the corresponding feature is positively associated with the outcome, whereas a negative SHAP value indicates that the corresponding feature is negatively related with the outcome. For all categorical variables, the SHAP values were calculated as the sum of the SHAP values of its one-hot encoded features. For time-series variables, the SHAP values were calculated as the sum of the SHAP values of each statistical feature.
Statistical analysis
Continuous variables with normal distribution were expressed as mean ± SD and subjected to an independent-sample t-test. Variables with skewed distribution were represented as median with IQR and analyzed by the Mann–Whitney U test. Categorical variables were presented as frequencies and percentages, which were analyzed with chi-square test or Fisher's exact test, as appropriate. A two-sided p-value < 0.05 was considered statistically significant. All statistical analyses were performed in Python (version 3.7).
Results
Patient characteristics
A total of 2408 patients were finally included in the study with a median age of 67 years old (IQR, 56 to 78), and 149 (6.2%) patients had an ICU-acquired BSI. The isolated pathogens are presented in Table S3 in Supplemental material 1. Patients with ICU-acquired BSI featured a higher sequential organ failure assessment (SOFA) score, longer length of stay in the ICU, and increasing hospital mortality when compared with patients without an ICU-acquired BSI (Table 2). In order to alleviate the imbalanced sample problem, SMOTE was utilized to generate a new dataset. After SMOTE, the ratio of patients with positive BC samples to patients with negative BC samples was 1:2. The final dataset was split into training and test with a ratio of 7:3.
Characteristics of patients with and without bloodstream infection in the study cohort.
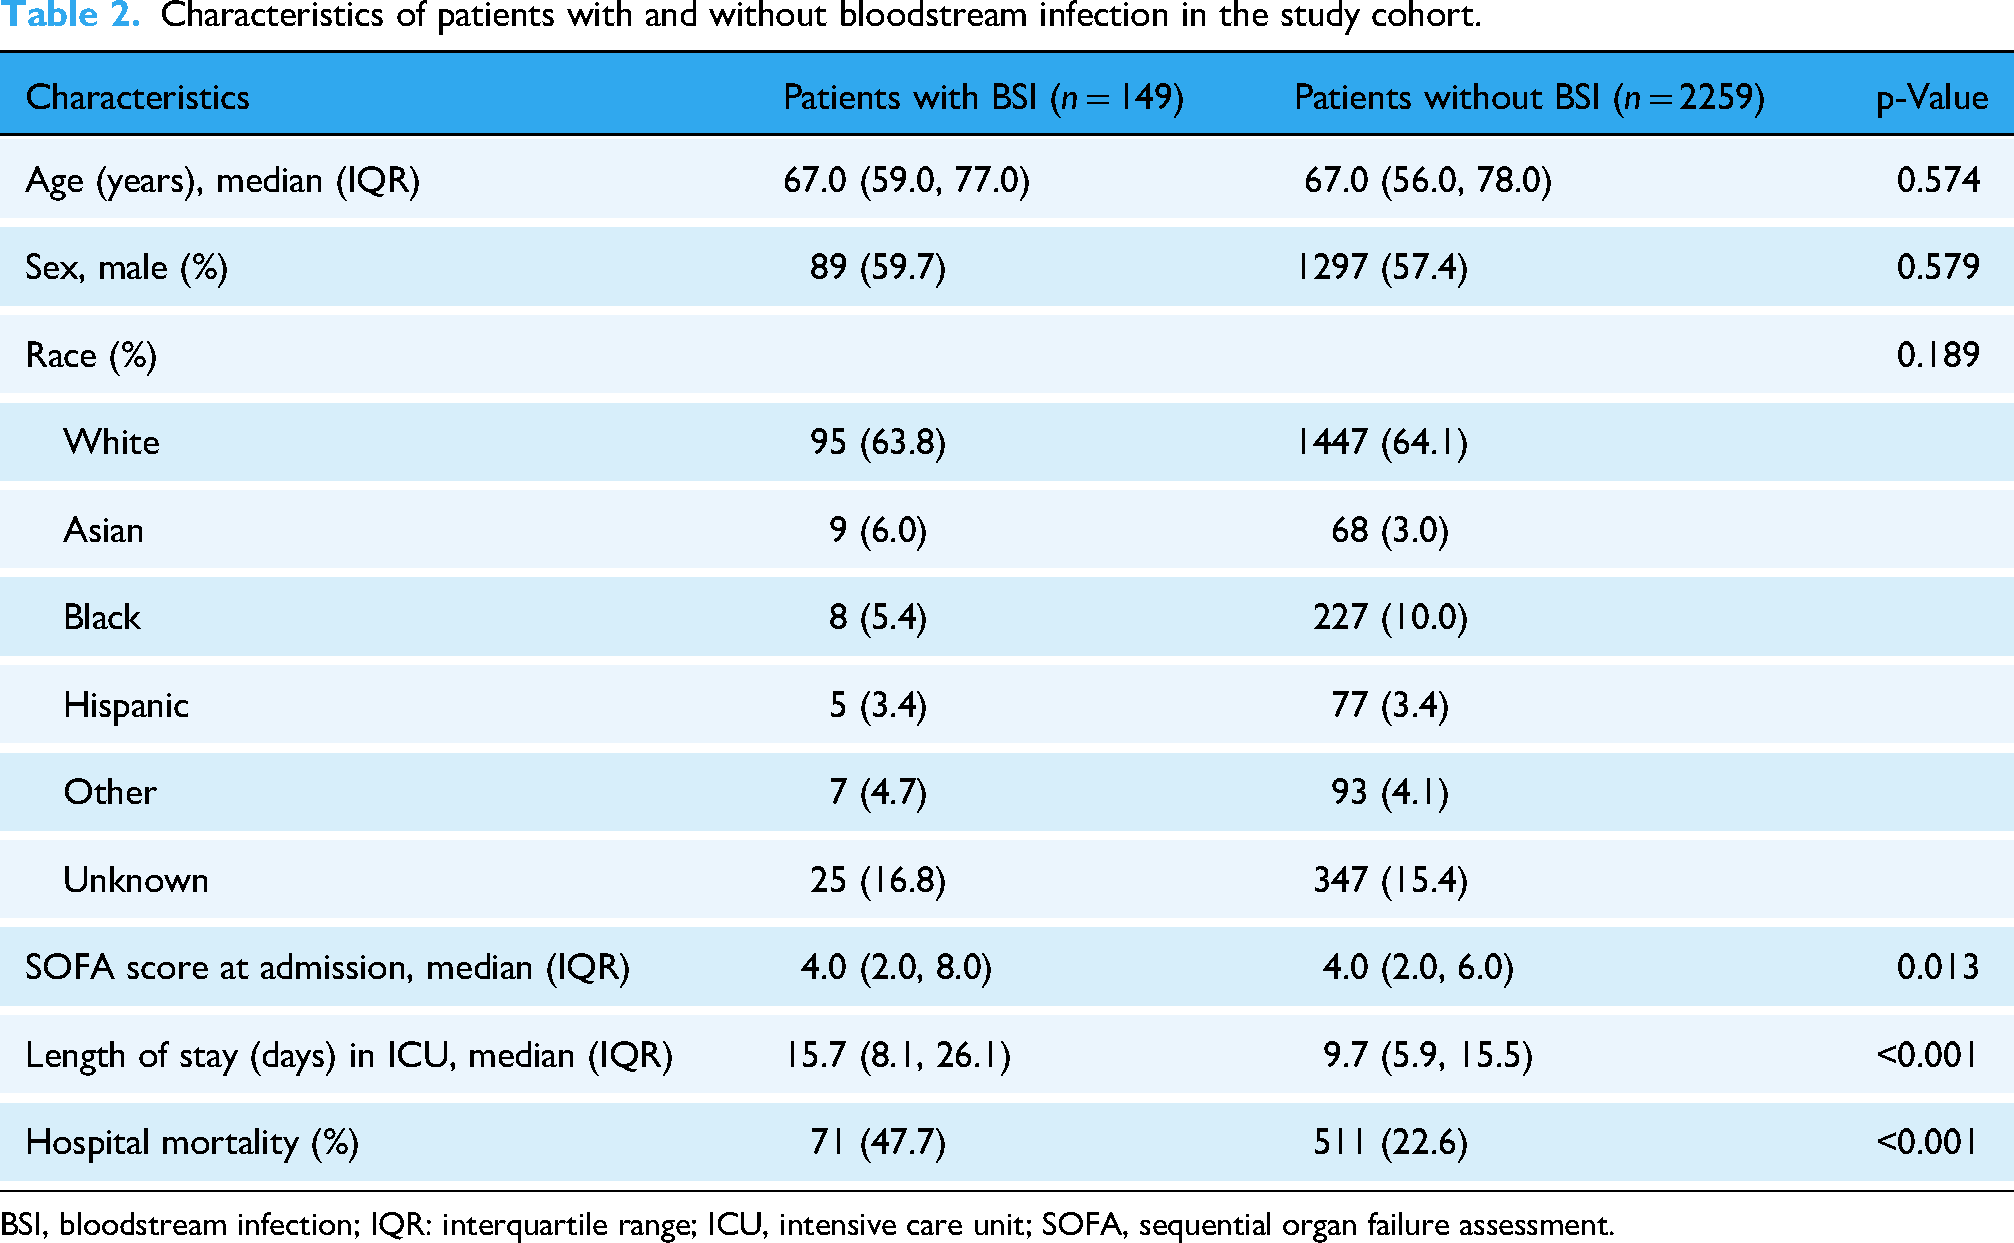
BSI, bloodstream infection; IQR: interquartile range; ICU, intensive care unit; SOFA, sequential organ failure assessment.
Model performance and comparison
The transformer and the CatBoost models demonstrated comparable AUROC performances in predicting BC outcomes at the time of BC samples collection 0.933 (95% confidence interval (CI), 0.915–0.950) versus 0.933 (95% CI, 0.913–0.952) (Figure 4(a)). However, the transformer model outperformed the CatBoost model as regard to AUPRC 0.916 (95% CI, 0.895–0.936) versus 0.884 (95% CI, 0.855–0.913). Additionally, the transformer achieved a higher F1-score compared to the CatBoost (0.835 vs. 0.780). The transformer also demonstrated superior calibration, as evidenced by a lower Brier score (0.082 vs. 0.095) (Table 3).
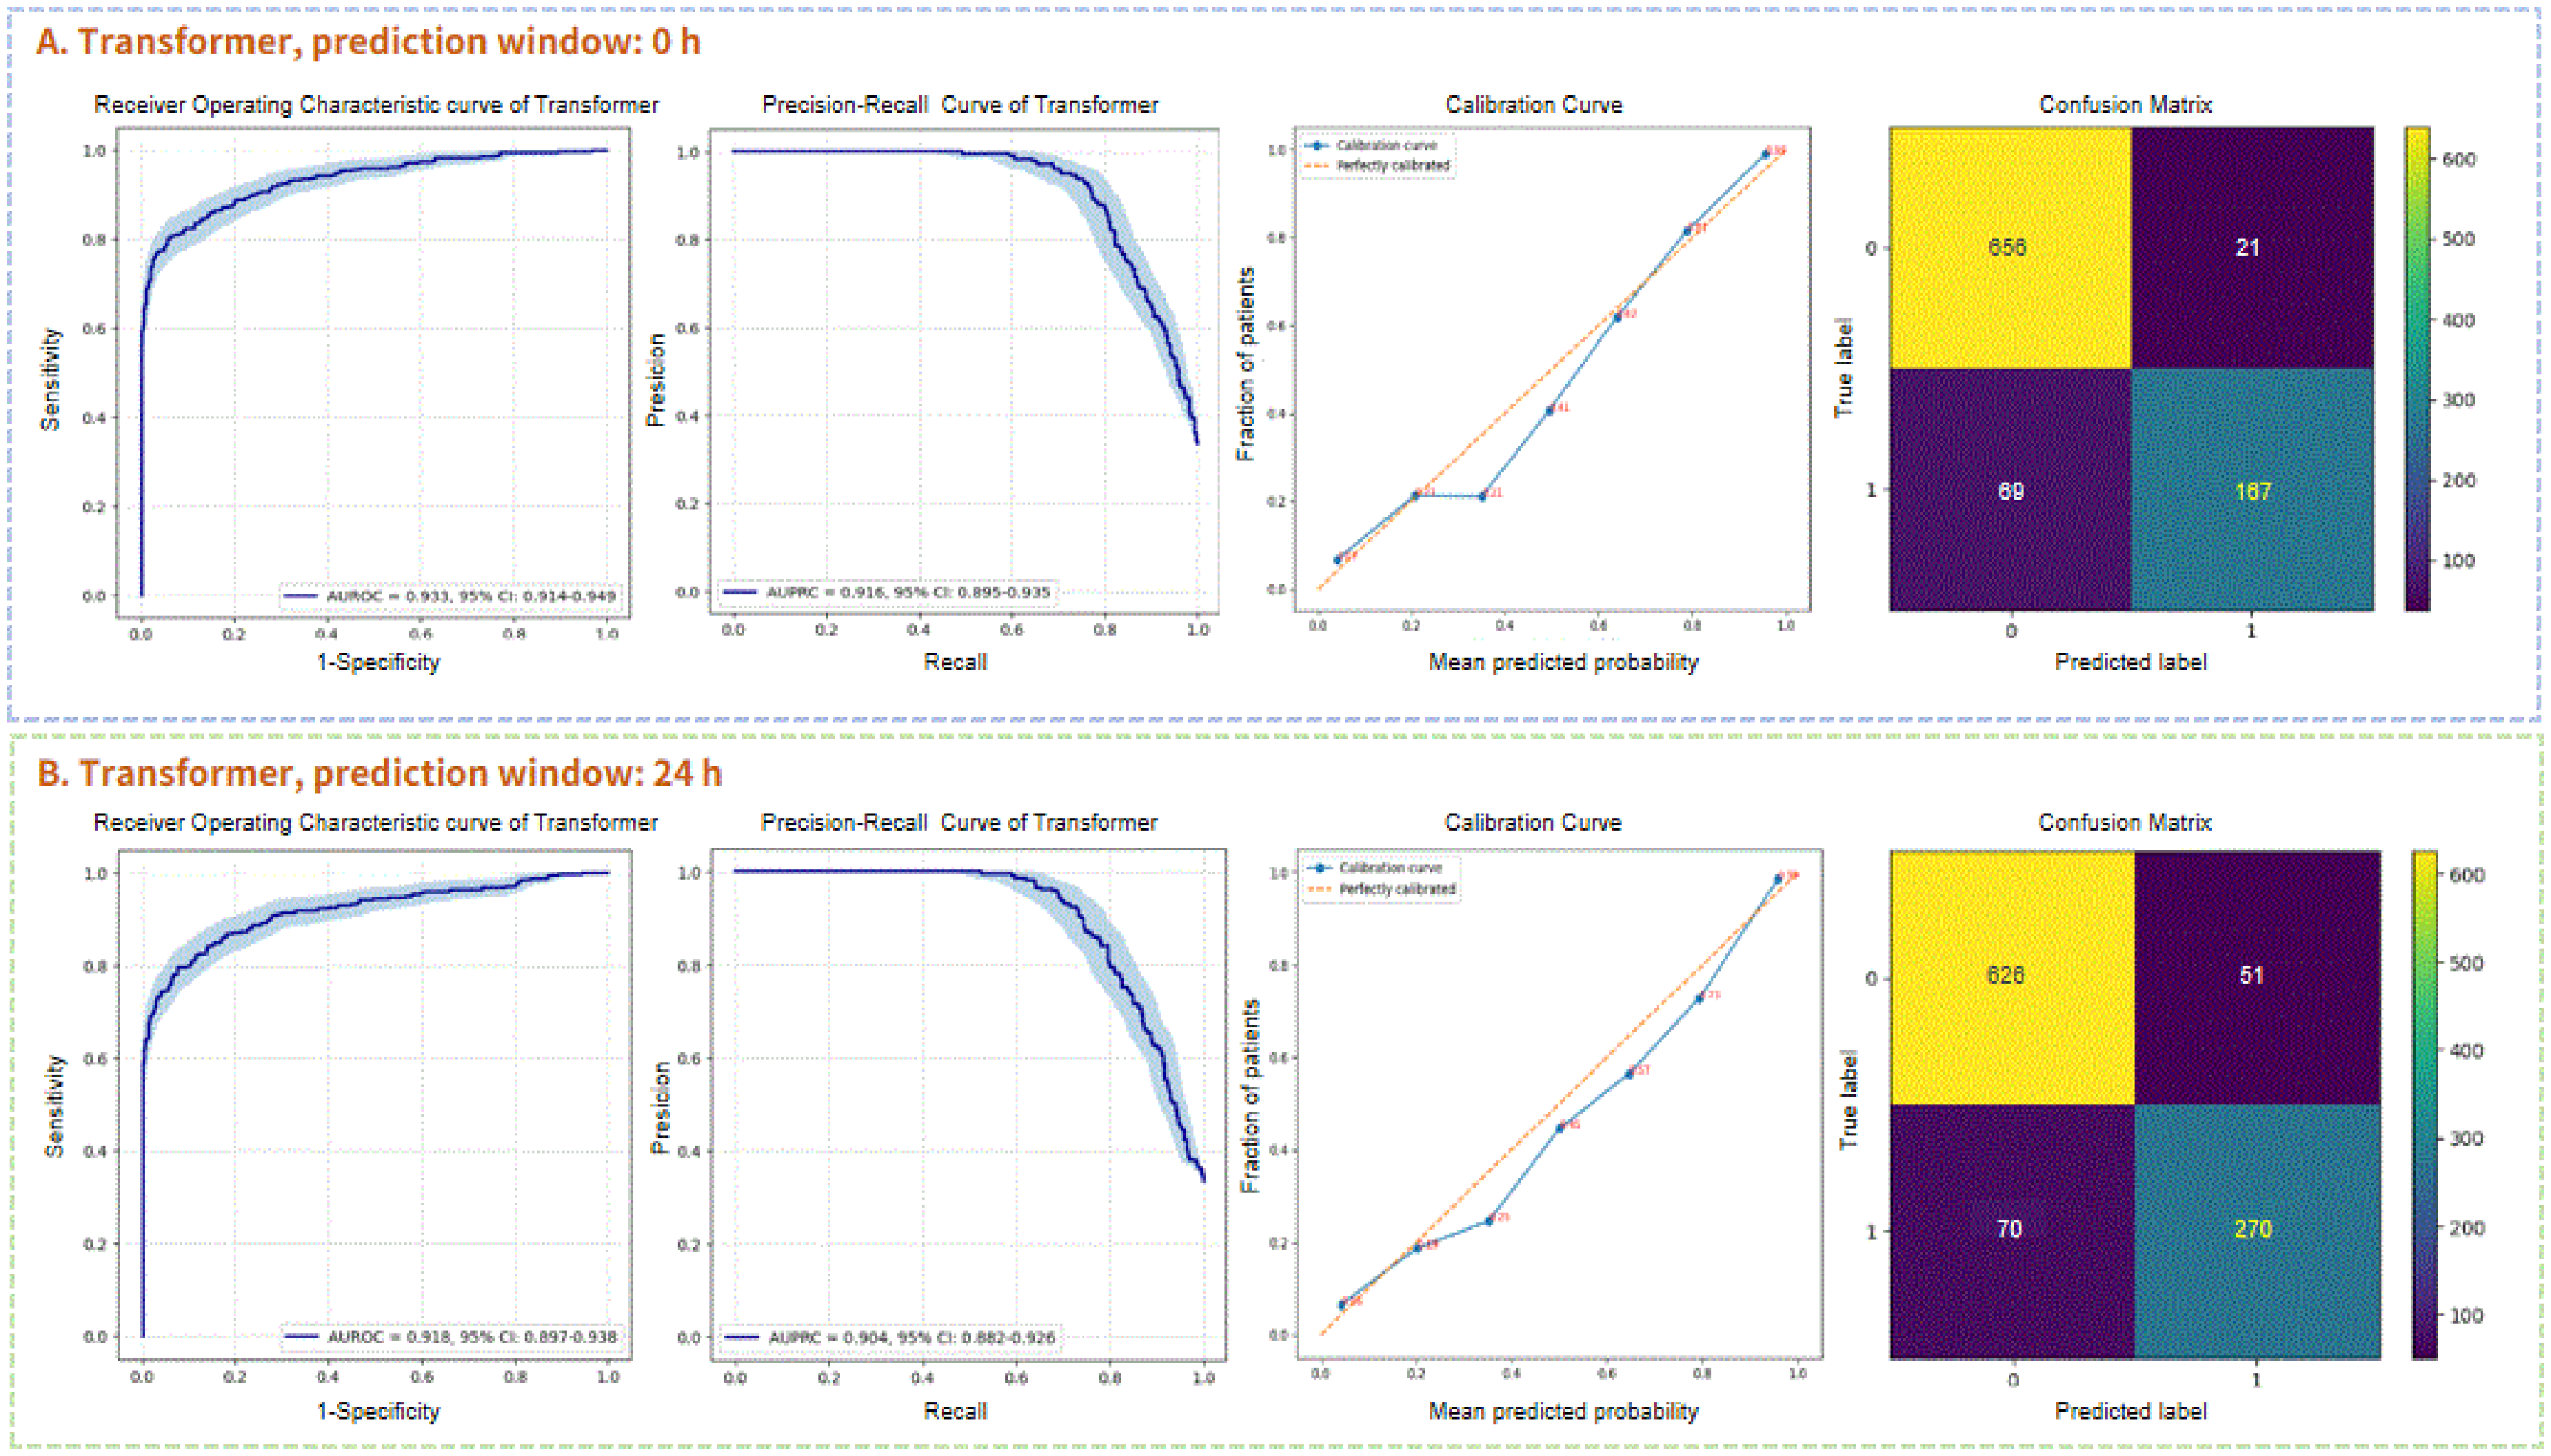
Performance of the transformer for predicting ICU-acquired bloodstream infection (BSI) without prediction window (a) and with prediction window 24 h (b). The area under the receiver operating curve (AUROC), the area under the precision-recall curve (AUPRC), the calibration curve, and the confusion matrix were represented, respectively.
Comparison of discrimination and calibration between the transformer and the CatBoost at three different prediction windows.

AUROC, area under the receiver operating characteristic curve; AUPRC, area under the precision-recall curve; CI: confidence interval.
By collecting time-series data in the 12 and 24 h periods before BC collections, we further compare the early predictive performances of the transformer and the CatBoost. When the prediction window was 12 h, it could be observed that the performance of transformer model was noninferior to the original transformer with AUROC 0.936 (95% CI, 0.918–0.952) and AUPRC 0.915 (95% CI, 0.895–0.934) (Figure S1 in Supplemental material 1). In terms of 24 h in advance, the transformer model still exhibited satisfactory results with AUROC 0.918 (95% CI, 0.897–0.939) and AUPRC 0.904 (95% CI, 0.882–0.926) (Figure 4(b)). Table 4 demonstrates a significant deterioration of the evaluation metrics of the CatBoost when a time shift was applied, especially in terms of recall (Figures S2–S4 in Supplemental material 1).
Comparison of evaluation metrics at a specific operation point between the transformer and the CatBoost.

Feature interpretability analysis
Due to the inconspicuous signs of early ICU-acquired BSIs, features’ SHAP values of the transformer with 24 h prediction window were demonstrated. The 20 most important features are listed in Figure 5(a) in the descending order. Glucose, bicarbonate, mean blood pressure, temperature, and blood urea nitrogen (BUN) were the top five predictors. Figure 5(b) shows the SHAP value of each feature on a particular patient sample. The right side points of 0 on the x-axis suggested that the features were associated with positive ICU-acquired BSIs and points on the left side indicated negative association. The redder the color, the more the contribution, while the bluer the color, the less the contribution. With the prediction window approaching to the BC collections time, obvious clinical variables, such as white blood cell count, anion gap, and lactate played more important roles in the transformer model's predictive performance (Figures S5 and S6 in Supplemental material 1).

Feature importance of the top 20 predictors of the transformer model when predicting ICU-acquired bloodstream infection (BSI) with 24 h prediction window. (a) The average impact of the features on the prediction (either positive or negative). (b) The local contributions of each feature for every prediction. AG: anion gap; BUN: blood urea nitrogen; Hb: hemoglobin; HR: heart rate; MBP: mean blood pressure; PT: prothrombin time; RR: respiratory rate; WBC: white blood cell.
Discussion
Principal findings
The rapid adoption of EHRs has led to the accumulation of a significant amount of digital data, detailing patients’ medical histories, laboratory tests, and health outcomes. This has paved the way for the ML to learn from diverse clinical data without being explicitly programmed. These computer systems could provide personalized scores to predict BSIs, which enable early antibiotic treatment. Previous ML studies were mainly focused on static data or nonsequential temporal data. Among the studies focusing on the static approaches, clinical features on a single point prior to BC collection were used to evaluate the performance of conventional ML algorithms.22–25 However, traditional ML models lacked the inherent ability to process temporal data. Common techniques of generating time-based aggregations included minimum, maximum, mean, median, or standard deviation, which appeared to enhance performance to a certain extent. The AUROCs reached a range between 0.78 and 0.90.11,12
Temporal data with sequential methods offered more information than static and nonsequential temporal data. Nevertheless, few studies investigated DL algorithms in the prediction of BSIs based on time-series data. In this study, we presented a relatively new attention-based DL model transformer in the prediction of ICU-acquired BSIs from MIMIC IV database. After dealing with missing values, outliers, and class imbalance, we constructed a transformer model with 25 routinely collect variables in ICU based on 24 h time-series data. The transformer model achieved better performance of AUPRC in the prediction of ICU-acquired BSIs when compared with traditional ML CatBoost. The increase in performance was primarily attributed to an improvement in recall (0.797 vs. 0.679). The results indicated that the trained transformer model was able to accurately estimate the outcome of a BC at the point of collection. For practical implementation, it would be valuable as an early warning system to accurately predict outcome several hours in advance. During the early phase of ICU-acquired BSIs, the manifestations of potential inflammation were obscure, which highlighted the recall of ML. Our study demonstrated that the early predictive performances of transformer model were still outstanding whether 12 or 24 h in advance, which featured comparable AUROC and AUPRC. Nevertheless, the traditional ML CatBoost might not be appropriate to be applied as an early warning system due to its increasingly low recall from 0.679 to 0.491. The study demonstrated the significant potential of the transformer model for early warning, offering a forward-looking solution that could enhance decision-making in clinical practice.
Interpretation of early predictive features
The features’ SHAP values of early predictors indicated strong clinical explanation but were easily overlooked. Insulin resistance is common in critically ill patients and glucose has been shown as a powerful pro-inflammatory mediator. When the body encounters foreign microbial agents, it activates pro-inflammatory pathways, leading to the production of cytokines such as tumor necrosis factor (TNF)-α and interleukin (IL)-1. These cytokines work both independently and synergistically to enhance hepatic glucose production. Additionally, the elevated levels of TNF-α reduce tyrosine phosphorylation and decrease the expression of the insulin receptor, thereby impairing glucose uptake.26,27 The clinical trial of in intensive insulin therapy reduced BSI by 46% for critically ill patients in the ICU. 28 Clinical scenarios associated with hypercapnia has long been recognized as a marker of poor prognosis. However, the association between hypercapnia and infection is not well known. Hypercapnia may impair cellular immune responses through mechanisms such as reduced phagocyte phagocytic ability, diminished oxidant-mediated bacterial killing and altered neutrophil death mechanisms. 29 Prolonged exposure to hypercapnic conditions has the potential to exert a major deleterious effect which impaired the host response to bacterial infection. This causes an overgrowth of the infectious agent and a worsening of the infection. 30 BUN is freely filtered at the glomerulus and recognized as renal function surrogate markers. However, BUN is reabsorbed by the renal tubules due to the overactivating renin–angiotensin–aldosterone system, which provides early incremental information of hemodynamic, and neurohumoral derangement.31,32
Limitations
Our study had several limitations. First, our model was built on retrospective data within a single center, which may limit the generalizability of our findings. Further multicenter research is necessary to evaluate the benefits of integrating these models into clinical practice. Second, the prediction model relied solely on BC results, potentially introducing bias as it excluded BSI patients who had false-negative outcomes from the datasets. Besides, we defined certain microorganisms as contaminants, while they were possible true cases of BSIs. Finally, the data were obtained from electronic databases, making it inevitable that some patients’ records lacked critical information.
Future research and implementation perspectives
Future work must focus on translating this promising DL model from a research prototype into a practical tool integrated within the clinical workflow. 33 The validation pathway must extend beyond our current retrospective analysis to include external validation across diverse healthcare systems, prospective validation in a “shadow mode” to assess real-time performance, and ultimately, a randomized controlled trial to measure its impact on clinical outcomes. 34 To empower frontline ICU clinicians, this system should be integrated into clinical workflows by embedding its predictions within the EHR as a silent background alert or a dedicated clinical decision support (CDS) module. 35 Furthermore, deployment will necessitate a robust technical infrastructure, including a secure data pipeline for real-time feature extraction and a low-latency inference engine, possibly via cloud-based application programming interface. 36 Finally, future work must also address practical challenges such as continuous model monitoring to prevent performance drift, ensuring interoperability with various EHR systems, and employing user-centered design principles to create intuitive interfaces that mitigate alert fatigue.37,38 Addressing these factors is paramount for transforming this algorithmic innovation into a tool that genuinely enhances patient care in ICUs.
Conclusion
In conclusion, we established a novel DL model transformer with time-series data in the prediction of ICU-acquired BSIs. Thanks to the multihead attention of transformer, we obtained final results with high accuracy and early predictive capability. Feature interpretability analysis further enhanced the explanation and reliability of the model. Although further research is necessary, our established algorithm has the potential to serve as a clinical decision support tool.
Supplemental Material
sj-docx-1-dhj-10.1177_20552076251412651 - Supplemental material for Transformer-based deep learning for early detection of intensive care unit-acquired bloodstream infection through multivariate time-series analysis
Supplemental material, sj-docx-1-dhj-10.1177_20552076251412651 for Transformer-based deep learning for early detection of intensive care unit-acquired bloodstream infection through multivariate time-series analysis by Jiang-Chen Peng, Jia-Rui Liang, Ming-Li Zhu, Chao Wang and Yuan Gao in DIGITAL HEALTH
Supplemental Material
sj-docx-2-dhj-10.1177_20552076251412651 - Supplemental material for Transformer-based deep learning for early detection of intensive care unit-acquired bloodstream infection through multivariate time-series analysis
Supplemental material, sj-docx-2-dhj-10.1177_20552076251412651 for Transformer-based deep learning for early detection of intensive care unit-acquired bloodstream infection through multivariate time-series analysis by Jiang-Chen Peng, Jia-Rui Liang, Ming-Li Zhu, Chao Wang and Yuan Gao in DIGITAL HEALTH
Footnotes
List of abbreviations
Ethical considerations and consent to participate
The establishment and employment of this database were approved by the Institutional Review Boards of the Massachusetts Institute of Technology and Beth Israel Deaconess Medical Center. No informed consent was required since all the data were de-identified.
Author contributions
Writing—original draft preparation, J-CP; methodology, J-RL; formal analysis, M-LZ; investigation, CW; writing—review and editing, YG. All authors read and approved the final manuscript.
Funding
The authors disclosed receipt of the following financial support for the research, authorship, and/or publication of this article: This work was supported by the grants from Shanghai Ren Ji Hospital Clinical Research Cultivation Fund (No. LYPY-QN-10).
Declaration of conflicting interests
Jia-Rui Liang and Chao Wang are affiliated with Shanghai AIMSN Medical & Technology Development Co., Ltd, a company that develops medical AI technologies. This association did not influence the design, execution, or interpretation of this academic research. All other authors declare no financial or nonfinancial competing interests.
Availability of data and materials
The data generated and analyzed during the current study are available on the MIMIC-IV website at https://physionet.org/content/mimiciv/2.2. The complete code used for data preprocessing, model training, and evaluation has been made publicly available to ensure reproducibility and can be accessed from ![]() .
.
Declaration of AI-assisted technologies
The authors used DeepSeek for language polishing and grammar checking during the writing process. The authors subsequently reviewed all content and take full responsibility for the final work.
Supplemental material
Supplemental material for this article is available online.
References
Supplementary Material
Please find the following supplemental material available below.
For Open Access articles published under a Creative Commons License, all supplemental material carries the same license as the article it is associated with.
For non-Open Access articles published, all supplemental material carries a non-exclusive license, and permission requests for re-use of supplemental material or any part of supplemental material shall be sent directly to the copyright owner as specified in the copyright notice associated with the article.