
Abstract
Objective
To examine the predictive attributes for accidental falls in community-dwelling older people in Hong Kong using decision tree analysis.
Methods
We recruited 1151 participants with an average age of 74.8 years by convenience sampling from a primary healthcare setting to carry out the cross-sectional study over 6 months. The whole dataset was divided into two sets, namely training set and test set, which respectively occupied 70% and 30% of the whole dataset. The training dataset was used first; decision tree analysis was used to identify possible stratifying variables that could help to generate separate decision models.
Results
The number of fallers was 230 with 20% 1-year prevalence. There were significant differences in gender, use of walking aids, presence of chronic diseases, and co-morbidities including osteoporosis, depression, and previous upper limb fractures, and performance in the Timed Up and Go test and the Functional Reach test among the baselines between the faller and non-faller groups. Three decision tree models for the dependent dichotomous variables (fallers, indoor fallers, and outdoor fallers) were generated, with overall accuracy rates of the models of 77.40%, 89.44% and 85.76%, respectively. Timed Up and Go, Functional Reach, body mass index, high blood pressure, osteoporosis, and number of drugs taken were identified as stratifying variables in the decision tree models for fall screening.
Conclusion
The use of decision tree analysis for clinical algorithms for accidental falls in community-dwelling older people creates patterns for decision-making in fall screening, which also paves the way for utility-based decision-making using supervised machine learning in fall risk detection.
Introduction
The population in Hong Kong is aging rapidly as a result of its having the highest life expectancy in the world. In 2021, the life expectancy at birth of males was 83.2 years while that of female was 87.9 years. 1 Hong Kong is also the world's most densely populated city, packed with high-rise buildings, with half of its people living above the 15th floor in multi-story residential buildings 2 and nearly half living in public housing. 3 Falls are common among the older population resided in community dwellings in Hong Kong – the fall rate has been reported as 29% annually, and the once-yearly prevalence of falls has been reported as 20%, dropping to 6.3% for 2 or more falls per year. Of all falls, 47.7% occurred indoors while 52.3% occurred outdoors. 4 The figures are less than that of 29% occur at least once annually reported in the United States. 5
The causes of falls are multifactorial and result from a combination of intrinsic and extrinsic factors; among intrinsic factors, impairments in gait and balance are the most prominent predisposing risk factors at the population level, followed by visual impairment, orthostatic hypotension, and polymedication; on the other hand, osteoporosis is an important contributing cause of fall-related fractures. 6 According to the World guidelines for falls prevention, there is a need for healthcare providers to develop a standard approach to assess an individual's estimated level of risk for falls for fall risk stratification in order to apply an appropriate intervention according to level of risk, particularly an objective assessment of gait and balance for differentiating immediate and high from low risk of falls is strongly recommended. 7 Such tools have been shown to reduce falls and fall-related injuries for community-dwelling older people.8,9 The use of a minimum number of measures in screening would positively affect outcomes but also ensure a minimal effect on staff time required or the need for additional equipment. 10 Decision tree model had been used to convert a complex decision-making process based on varying influences of significant risk factors for falls in large cohorts of older adults, into a fall-risk classification algorithm that is followed in a stepwise manner to reach a final conclusion for clinical application and interpretation.11,12 This cross-sectional study aimed to examine the predictive attributes based on a fast screening assessment comprised of 60 variables, comprising medical, social and physical outcomes, including functional assessments for gait and balance, for accidental falls in community-dwelling older people in Hong Kong using decision tree analysis.
Methods
Participants
This was a cross-sectional study for two prospective screening occasions took place in 2009–2010 and 2014–2015. Older people aged 65 years or above attending a primary healthcare setting – the elderly resource centre (the Centre) of the Hong Kong Housing Society – were recruited for assessment. This is a primary healthcare centre aiming to provide prevention in the form of education to older people residing in community dwellings who are at risk. The participants in this study were clients referred from different community organizations and visiting the Centre once from various districts in Hong Kong during the study period. Baseline assessments were completed at the Centre with informed and written consent from each participant before data collection. Inclusion criteria for this study were: (a) living independently in community dwellings and ambulatory with or without a walking aid, and (b) having a Mini-Mental State Examination score ≥ 18. 13 Those who were unable or unwilling to give consent were excluded from the study, as were those residing in nursing homes. Those with poorer cognitive performance were excluded because they would have been less reliable in their recall and ability to report their fall history. 14 To obtain a more representative sample, the study population was divided into five strata, defined by age according to the distribution of the Hong Kong Population Census of 2012. 15 The study was approved by the Human Subjects Ethics Committee of the Hong Kong Polytechnic University (Ref: HSEARS20140628001) and the governing board of the Centre.
In this study, a fall was defined as an event that results in a person coming to rest inadvertently on the ground or hitting an object like a chair or stair. 16 Participants who fell because of excess alcohol intake, or who fell after sustaining a sudden blow or loss of consciousness or sudden onset of paralysis due to stroke or epileptic seizure, were excluded. If the participants reported a fall in the preceding 12 months, they would be further asked about the frequency of falls, injuries from falls, and indoor or outdoor falls. Indoors was operationally defined as the flat in which the person was living and the environment within the house, apartment, or building, but excluding the common areas outside the building. Apart from age and gender, level of education, previous injury, comorbidity (please refer to Table 1), performance of instrumental activities of daily living (IADL) – ability to perform light and heavy household duties, number of drugs taken, activity level, mobility status, use of walking aid, and social support were self-reported and recorded. The reason for using self-reporting was that the participants attended the Centre just once and that medical information would not be accessible in a community centre. Other assessments included measurements of body mass index (BMI) – calculated as weight (kg) divided by the square of height (m) – and blood pressure (BP), the Timed Up and Go (TUG) test, 17 the Functional Reach (FR) test, 18 and a visual acuity test using a Snellen Eye Chart. 19 Both TUG and FR had been used for risk assessment screening in a similar large-scale nation-wide survey of the older population. 20 The TUG is an objective and reliable gait measurement that measures the time taken by an individual to stand up from a standard armchair, walk for 3 m, turn around and walk back to the chair and sit down again. 21 The recent guideline recommend a cut-off value of >15 s for the TUG for older people with gait and balance impairment. 7 The FR is a reliable measure of balance for older community-dwelling populations and measuring the difference between arm's length and maximal forward reach using a fixed base of support. 22 The whole assessment process for each participant took 30 min to complete. Five trained occupational therapy students together with two experienced occupational therapists were responsible for carrying out all assessments of the participants.
Baseline demographics of the population and comparison between fallers and non-fallers.

BMI: body mass index; AMT: Abbreviated Mental Test.
* p ≤ 0.05; ** p ≤ 0.01
Statistical analysis
Descriptive analysis was conducted on all baseline characteristics for the sample and the two subgroups, which were fallers and non-fallers according to the 12-months prevalence of falls (persons with at least one fall over the previous 12 months). Comparison of baseline characteristics between fallers and non-fallers was performed using independent-samples t-test if the outcome measures were continuous data. Chi-squared test was used instead if the outcome measures were categorical. Level of significance was set at 0.05.
Decision tree analysis was conducted using the rpart package of R software, 23 which was a powerful machine learning (ML) library in R that was used for building both classification and regression trees. This library implemented recursive partitioning and was very easy to use. In our study, our decision tree was a standard classification tree with the predicted values indicating the class to classify the subjects into fallers and non-fallers through a random split of the data into two portions: training and testing data. There were two major concerns to decide the optimum split of the training and testing data. (a) If there was less training data, the ML method would show high variance training; (b) with less testing data, the model evaluation performance statistics would have greater variance. Thus, the whole dataset was divided into two sets, namely training set and test set, which occupied 70% and 30% of the whole dataset, respectively, this was one of the standard and conservative splitting proportions under ML method (80% vs 20%, 70% vs 30% and 60% vs 40%). 24 The training set was used with decision tree analytical software R to identify all possible stratifying variables such as TUG, the FR, the BMI, high BP, osteoporosis, and number of drugs taken that could help to generate separate decision models for each of the three dependent dichotomous variables – fallers, indoor fallers, and outdoor fallers among community-dwelling older adults. The test set was then used to test the validity of these three decision models and their accuracy rates were then computed accordingly. The accuracy rate of the decision tree was computed by the sum of true-positives (fallers) and true-negatives (non-fallers) among the total number of samples within confusion matrix of the testing dataset. Cross-validation was used to evaluate the model with the same train-test split (70% vs 30%) for 10 training iterations. Among the 10 training iterations, the decision tree with the interpretable framework together with at least the median accuracy rate of the 10 decision trees had been chosen for the final decision tree model. Though the hyperparameter tuning such as split criteria, mini samples split, mini samples leaf or maximal depth, etc. through grid search method could help to optimize the decision tree model architecture, it was not a compulsory process but only an optional process for decision tree analysis. Also, it was only a way of improving the decision tree model and thus hyperparameter tuning was not conducted under our decision tree analysis. However, the default settings of the hyperparameters under the rpart library were used in our study.
Apart from adopting the Decision tree analysis, Random Forest model will be used to produce a reasonable prediction without hyperparameter tuning. The performance metric of the model such as accuracy, sensitivity, specificity, positive predictive value and negative predictive value will be computed. As there were many more non-fallers than fallers leading to imbalanced classification in our study, the sampling methods such as undersampling, oversampling, both undersampling and oversampling as well as ROSE function 25 would be applied to our random forest analysis to further enhance its performance metric mentioned above.
Results
Decision tree analysis
A total of 1151 participants, with an average age of 74.8 (SD = 6.7) years, were recruited by convenience sampling to this study over 6 months. The 1-year prevalence of falls was 20% (n = 230/1151) and the fall rate (number of falls per 100 persons in one year) was 30.4% (n = 350/1151). The mean number of falls per faller was 1.4. The numbers of indoor and outdoor fallers were 96 and 157, respectively, with 23 participants having both indoor and outdoor falls in 1 year. Among the fallers, 78 of them had recurrent falls (with 2 or more falls) within a year. The 1-year prevalence of recurrent falls was 6.8% (n = 78/1151). Table 1 shows the baseline characteristics of the whole sample and the faller and non-faller groups. Among all the baselines, only 8 of them were shown to be significant between the faller and non-faller groups. Regarding gender, females were more likely than males to be fallers (89.1% vs 10.9%, p < 0.001). It was also found that those who did not use walking aids tended to be fallers more than those who did use them (66.1% vs 33.9%, p < 0.001). Moreover, those who showed manifestations of chronic diseases were more likely to be fallers than those who did not (85.2% vs 14.8%, p = 0.005). Fallers were also more likely than non-fallers to have co-morbidity problems like osteoporosis (8.3% vs 4.5%, p = 0.02), depression (3.5% vs 1.2%, p = 0.015), and previous upper limb fracture (2.2% vs 0.3%, p = 0.003. In terms of functional tests like TUG and FR, fallers took longer to complete the former (15.15 vs 13.78, p < 0.001) and could not reach as far in the latter (23.61 vs 24.69 cm, p = 0.015) compared with non-fallers. Out of 1151 participants, about 70% of them (n = 810) were used for the training dataset and the remainder were used for the test dataset (n = 341). Figures 1 to 3 show the decision tree diagrams for the dependent dichotomous variables (fallers, indoor fallers, and outdoor fallers), with overall model accuracy rates of 77.40%, 89.44%, and 85.76%, respectively.
Decision tree for fallers

Decision tree for indoor fallers

Decision tree for outdoor fallers
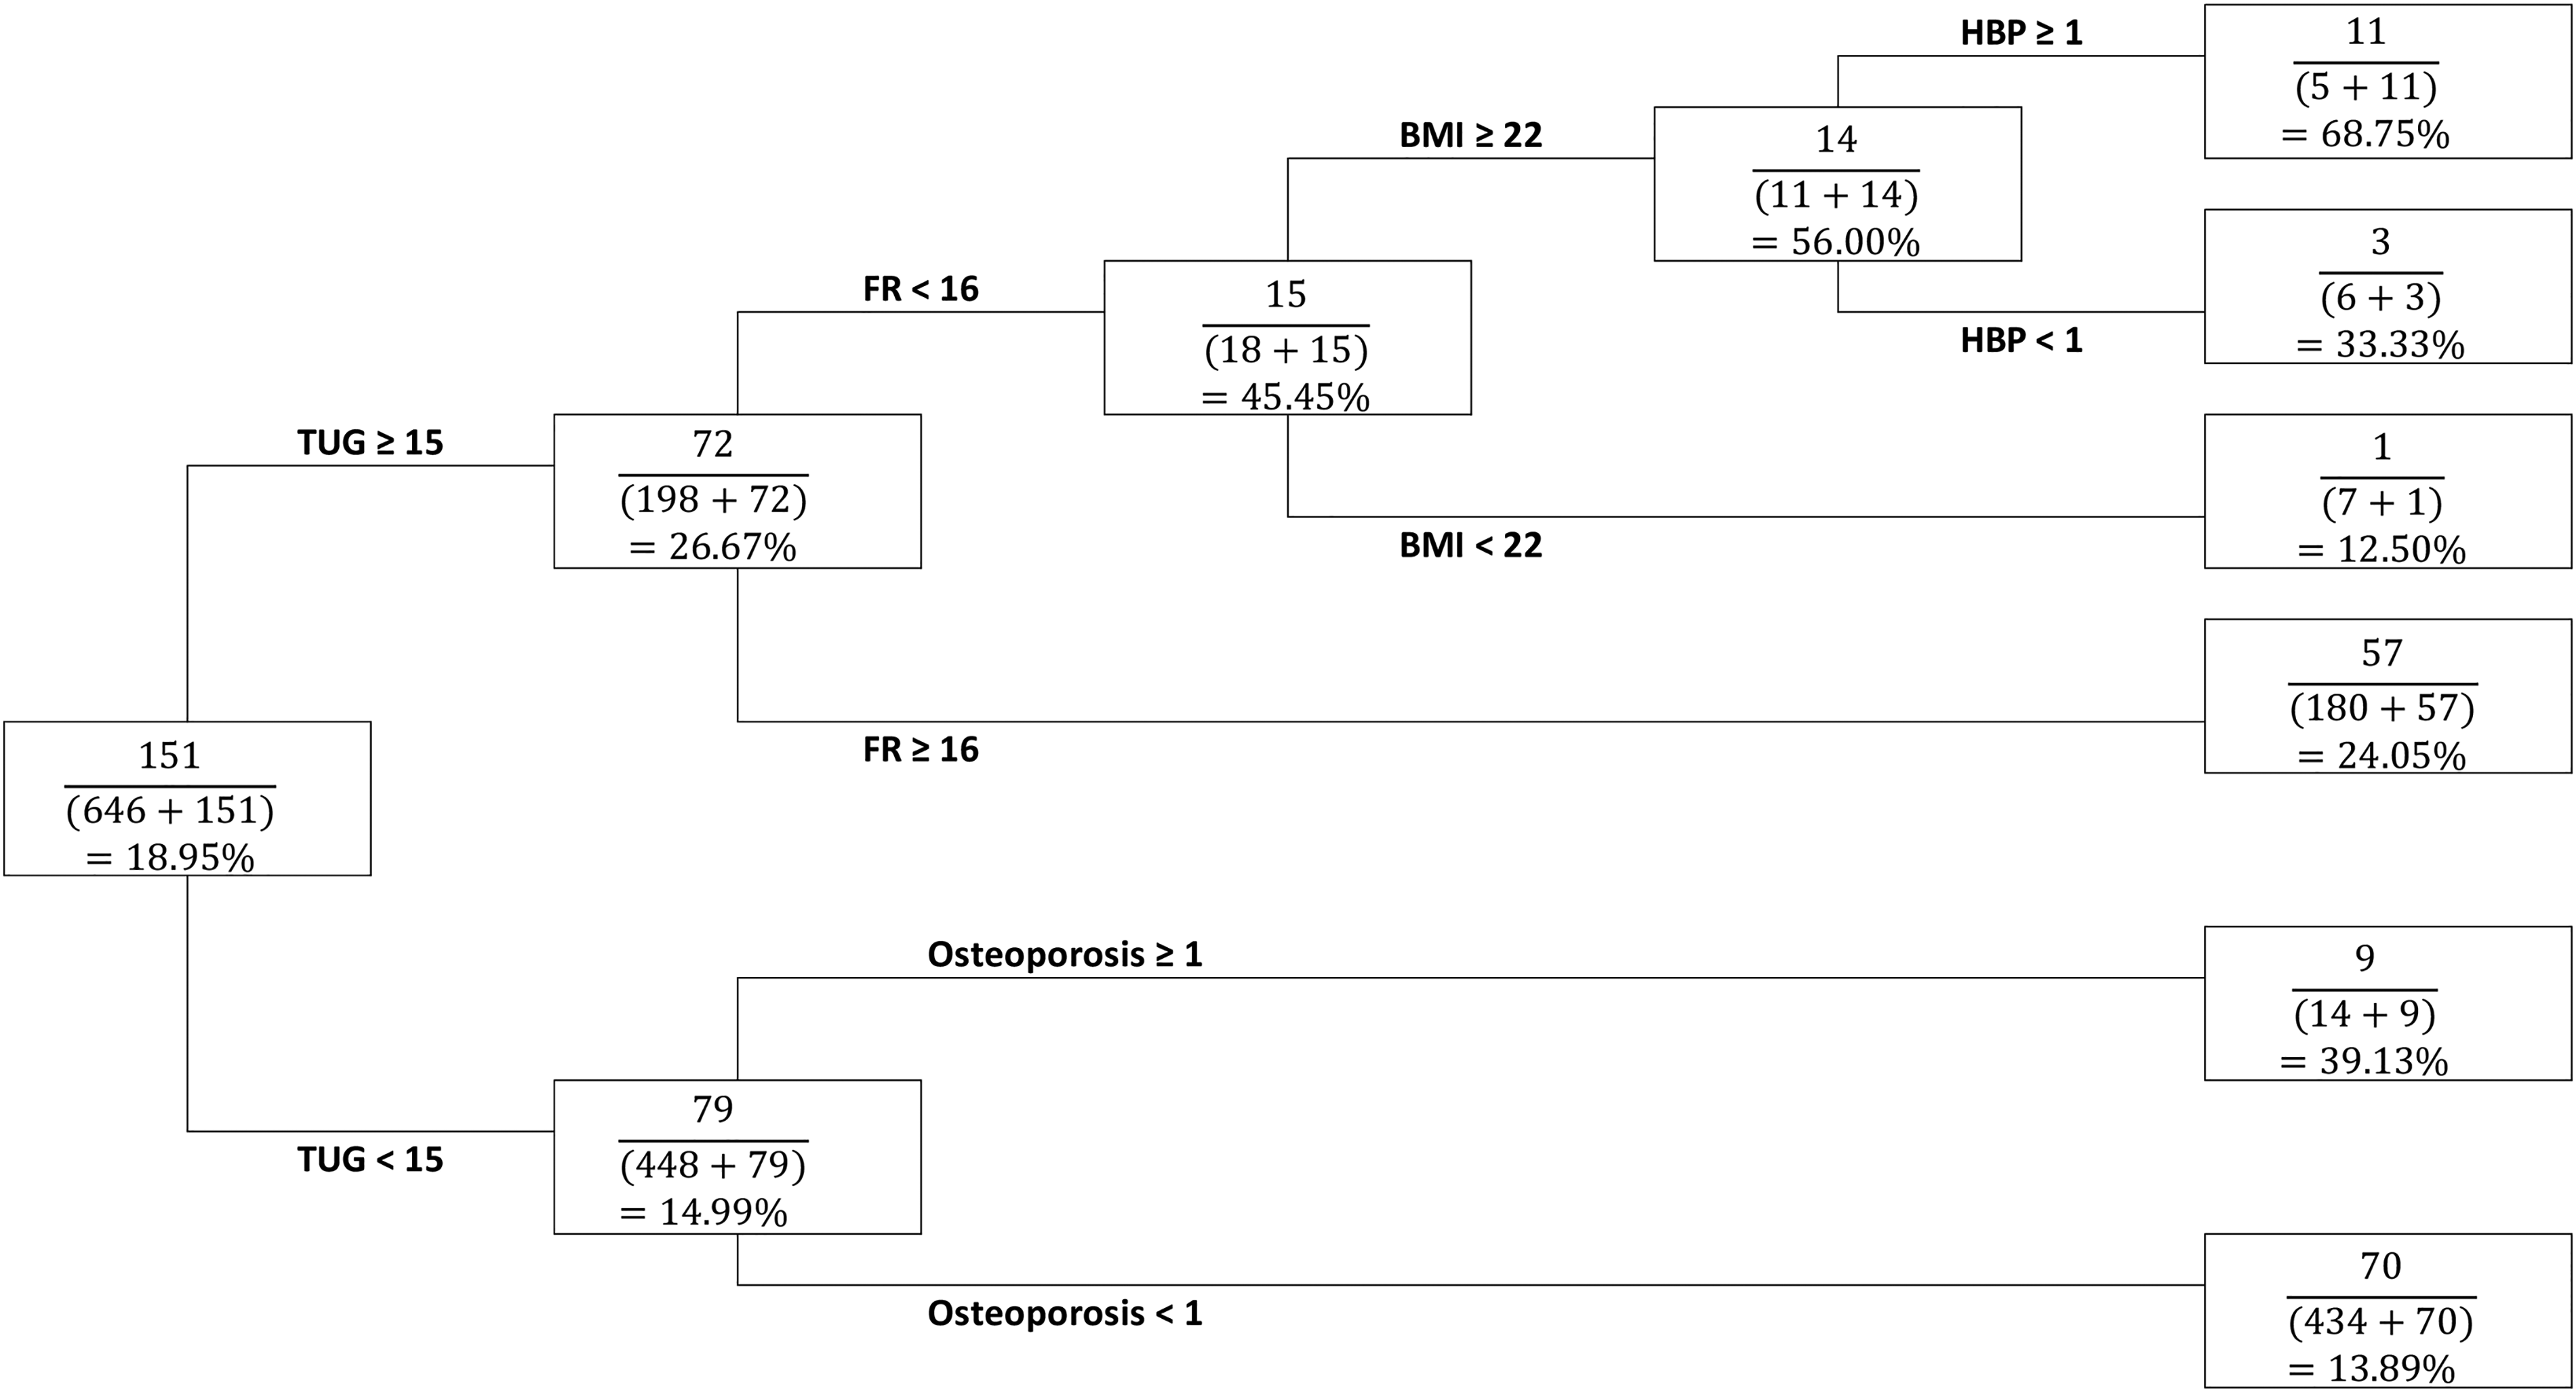
Regarding the decision tree for fallers (Figure 1), 151 out of 797 participants were classified as fallers. Five stratifying variables were identified, namely TUG, FR, BMI, high BP, and osteoporosis. TUG was chosen as the first stratifying variable and the threshold was set at 15. Participants with TUG greater than or equal to 15 were found to have a higher fall rate of 26.67% compared with those with TUG less than 15, who had a relatively lower fall rate of 14.99%. Among those participants with higher TUG, FR was chosen as the second stratifying variable and the threshold was set at 16. Those with FR less than 16 had a higher fall rate of 45.45% compared with those who had a higher FR (greater than or equal to 16), who had a lower fall rate of 24.05%. Among those with FR less than 16, BMI was taken as another stratifying variable, with 22 taken as the cutoff. Those with BMI greater than or equal to 22 were found to have a higher fall rate of 56% compared with those who had BMI less than 22, who had a lower fall rate of 12.5%. Among those participants with BMI greater than or equal to 22, those who had high BP were more likely to become fallers than those without high BP (68.75% vs 33.33%). Among those participants with TUG less than 15, osteoporosis is chosen as the only stratifying variable. Those with osteoporosis had a higher fall rate of 39.13% compared with those without, who had a lower fall rate of 13.89%.
Regarding the decision tree for indoor fallers (Figure 2), 69 out of 810 participants (8.52%) were classified as indoor fallers. Two stratifying variables (TUG and FR) were identified. TUG was used as the first stratifying variable and the threshold was determined to be 18. Participants with TUG greater than or equal to 18 were found to have a higher fall rate of 18.25% compared with those with TUG less than 18, who had a lower fall rate of 6.73%. Among the participants with TUG greater than or equal to 18, the second stratifying variable (FR) was chosen and its threshold was set at 15. Participants with FR greater than or equal to 15 had a lower fall rate of 13.27% compared with those with FR less than 15, who had a fall rate of 61.54%.
Regarding the decision tree for outdoor fallers (Figure 3), 108 out of 807 participants (13.38%) were classified as out outdoor fallers, and two stratifying variables, namely FR and number of drugs taken, were identified. FR was chosen as the first stratifying variable and the threshold was determined to be 17. Participants with FR less than 17 were found to have a higher fall rate of 24.64% compared with those with FR greater than or equal to 17, who had a relatively lower fall rate of 12.33%. Among those participants with FR less than 17, number of drugs taken was chosen as the second stratifying variable and its threshold was set to 2 for further discrimination. Those who took fewer than 2 drugs had a relatively low fall rate of 19.35% compared with those who took 2 or more drugs, who had a higher fall rate of 71.43%.
Random forest analysis with sampling method to deal with imbalanced classification
Table 2 shows the result of Random Forest for fallers with different sampling methods to treat imbalanced classification of fallers and non-fallers. Among the six sampling scenarios, the undersampling method showed the lowest accuracy rate of 55.75% (95% CI: 50.29%, 61.12%) whereas the other sampling methods showed an accuracy rate of more than 70%. Conversely, the sensitivity was the largest under the sampling method with 56.94% among all sampling scenarios, with the oversampling method carrying the lowest accuracy rate of 9.72%. On the other hand, the specificity value was the lowest for the undersampling method at 55.43%. Regarding the positive predictive value, the undersampling method showed the lowest value of 25.62% but a relatively higher negative predictive value of 82.68%.
Results of random forest for fallers with different sampling methods to treat imbalanced classication of fallers and non-fallers.

True: true group membership; Pre: predicted group membership; NF: non-fallers; F: fallers.
Table 3 shows the result of Random Forest for indoor fallers with different sampling methods to treat imbalanced classification of fallers and non-fallers. The result was quite similar to that of fallers under Table 2. Again, the undersampling method showed the lowest accuracy rate of 60.47% (55.05%, 65.71%), the highest sensitivity of 55.88% and the lowest specificity of 60.98% compared with other sampling methods. Regarding the positive predictive values, the undersampling method showed a relatively smaller value of 13.77% compared with oversampling method (50%) whereas it showed a maximum value of 92.54% compared with other sampling scenarios.
Results of random forest for indoor fallers with different sampling methods to treat imbalanced classication of fallers and non-fallers.

True: true group membership; Pre: predicted group membership; NF: non-fallers; F: fallers.
Table 4 shows the result of Random Forest for outdoor fallers with different sampling methods to treat imbalanced classification of fallers and non-fallers. Again, the result was consistent with that of fallers (Table 2) and indoor fallers (Table 3). The undersampling method showed the lowest accuracy rate of 54.57% (49.10%, 59.96%), the highest sensitivity of 52.94%, the lowest specificity of 54.86% compared with other sampling methods. Regarding the positive predictive values, the undersampling method showed the second lowest value of 17.20% whereas it showed the maximum value of 86.61% compared with other sampling scenarios.
Results of random forest for outdoor fallers with different sampling methods to treat imbalanced classication of fallers and non-fallers
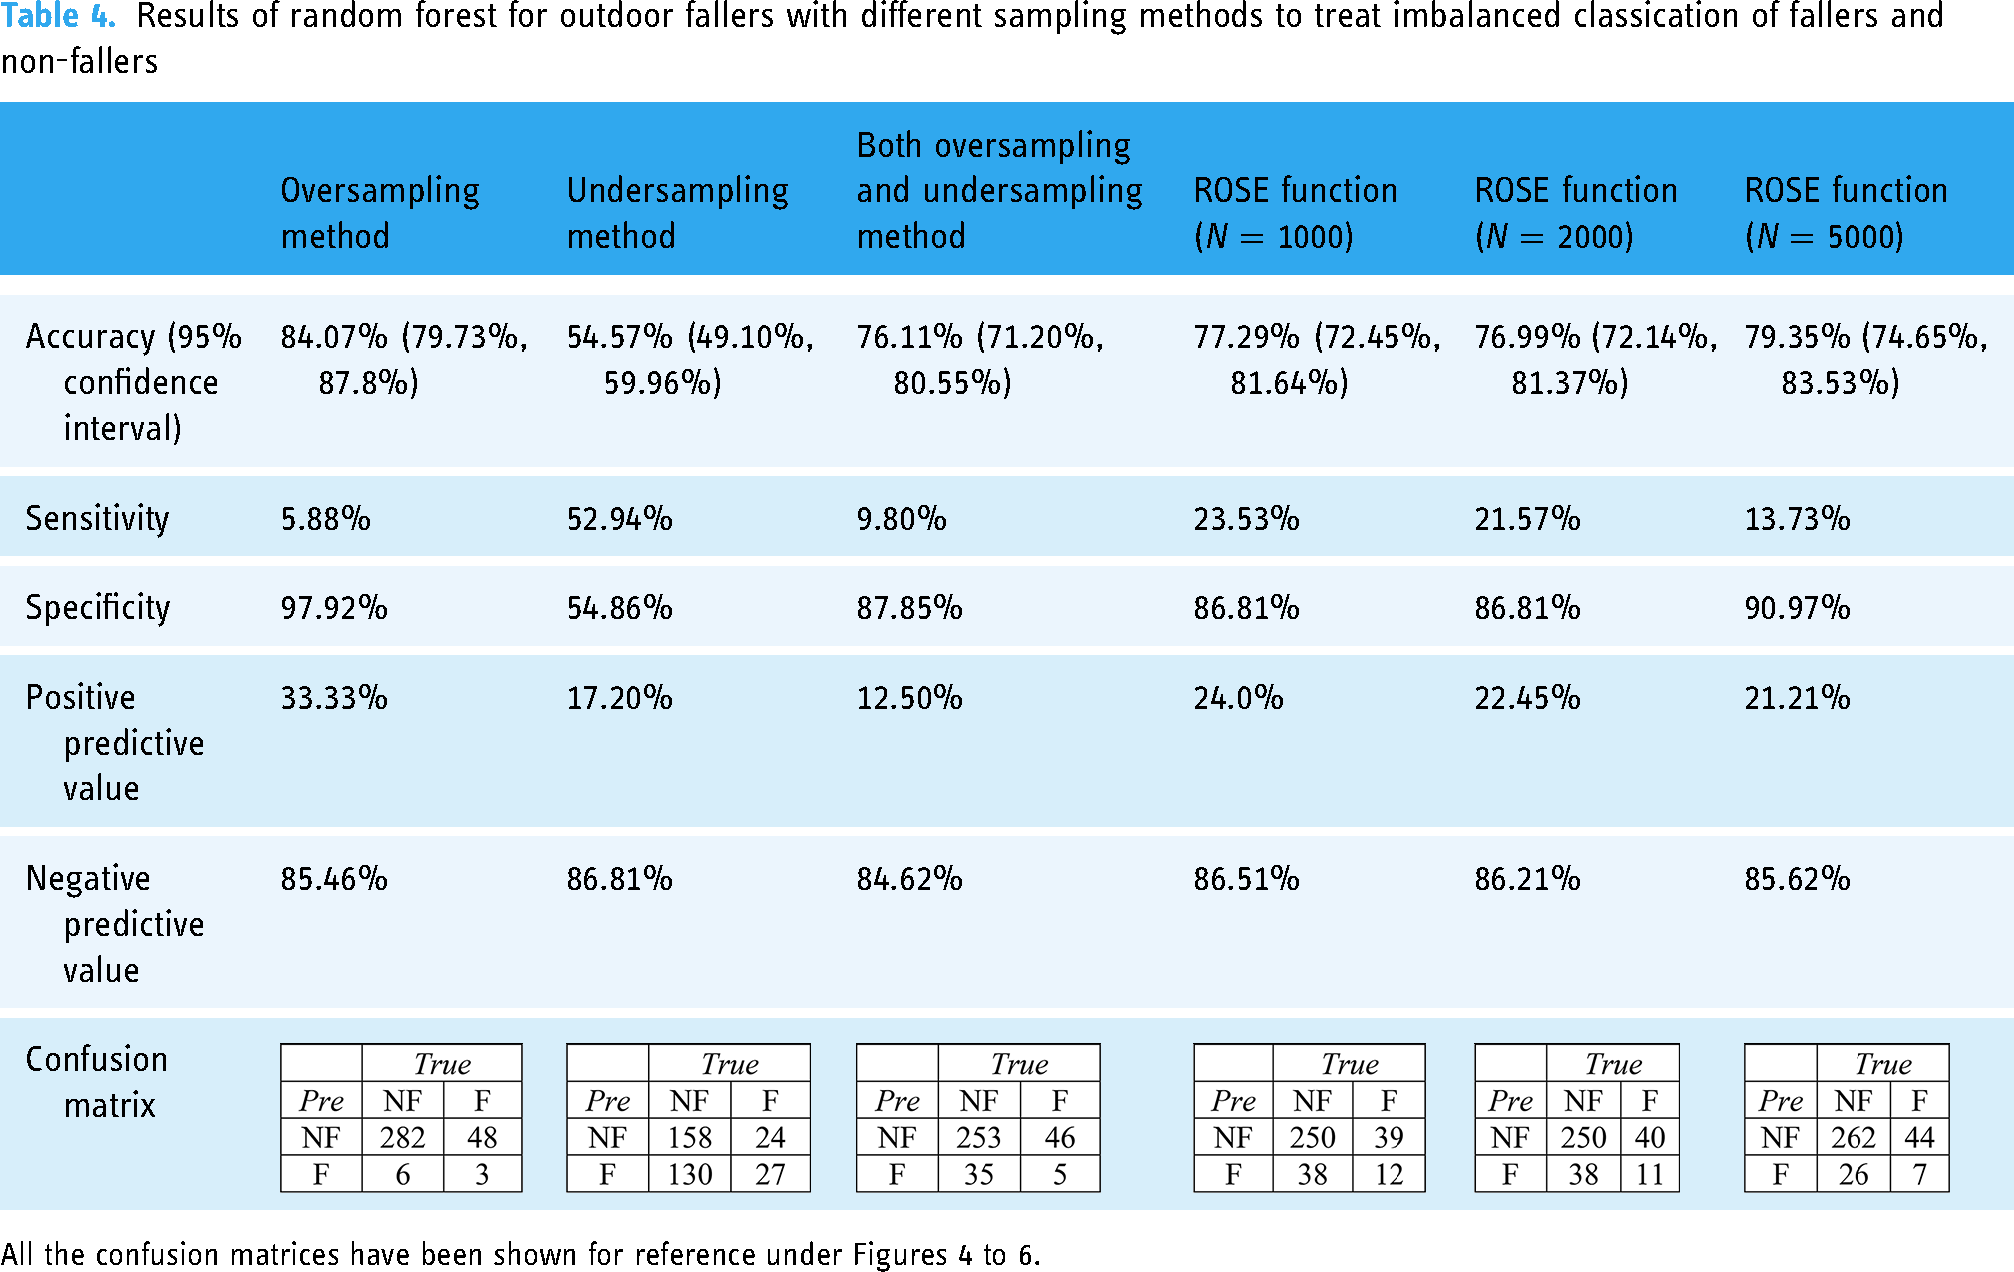
All the confusion matrices have been shown for reference under Figures 4 to 6.
Discussion
We identified the predictive attributes for fallers generally, and indoor and outdoor fallers specifically, using decision tree analysis for accidental falls in community-dwelling older people in Hong Kong. A clinical algorithm derived from decision tree analysis using the TUG, the FR test, BMI, high BP, osteoporosis, and a number of drugs taken was developed for fall screening for community-dwelling older people which could be used for developing a clinical algorithm for fall screening.
The summary of the cross-validation process with the same split of training and testing dataset for 10 training iterations. found that TUG, FR, BMI, high BP, and number of drugs taken could be used as factors in risk assessment and fall screening for community-dwelling older people. Age, gender, level of education, previous injury, comorbidity, the performance of IADL, mobility status, use of walking aid, social support, and visual acuity were not identified as stratifying variables in the decision tree models.
Our findings can only be applied to those older people who are able to ambulate independently in the community. Although self-reporting of fall events has been criticized due to the tendency to under-report actual fall events, the clinical value of this retrospective self-reported method in reflecting the actual conditions of falls is demonstrated by the fact that it is still being widely used in fall studies. 26 A systematic review reports that recall of any fall in the previous year is relatively specific (91%–95%) but somewhat less sensitive (80%–89%) than intensive prospective data collection. However, 12-month recall is still better than recall for falls in the previous 3 or 6 months. 14 Screening for falls and fall risk is aimed at preventing or reducing fall risk; persons screened into a high-risk group warrant further evaluation. 15 We believe that self-reporting of recall of fall events was useful in fall detection for preventing or reducing fall risk. It is recommended that all older people who are under the care of a health professional (or a caregiver) should be asked at least once a year about falls. 27
The clinical algorithm we found for TUG of fallers (cutoff range ≥ 15–18; including both indoor and outdoor fallers) was consistent with the reference framework for preventive care for older people in primary care settings in the local community. 28 According to the updated guideline, the cut-off value of 15 s is conventionally adopted to discriminate fallers and non-fallers in healthy, highly functional older people. 7 However, other studies have found that TUG is also a sensitive and specific measure of frailty 29 but might not be able to reliably identify pre-frail individuals. 30
Measurement of unsteadiness in balance, as represented by FR, was also consistent with the literature, with a reported cutoff range of 15–17 for various fallers in this study. FR is the most common tool in risk assessment for older people living independently in their own homes and in community dwellings, and has reached sensitivity and specificity values greater than 70. It has been tested in other studies with different populations, including recurrent fallers and cognitively impaired persons. 8
Conventionally, the risk of falls is thought to increase for those taking 4 or more medications. 31 Our results suggested a number of drugs taken ≥ 2 for a stringent screening of fall risk (slightly different from the risk factor of polypharmacy). The finding regarding high BP might also be associated with postural hypotension, which is a risk factor for falls in community-living older people. 32 It was interesting to find that BMI > 22 led to greater risk of falls, as BMI = 22 is in the normal range for older persons, but it might imply that obesity was associated with a higher prevalence of falls and stumbling during ambulation. 32 Our finding of BMI >22 with a higher risk of fall was consistent with another decision tree study based on a prospective observational multicenter study. 33 Another study has also found that in community-dwelling older people, obese individuals had a 31% higher risk of having fallen, and among them, a 41% higher risk of using 4 or more medications which might be associated with a higher risk of certain physical comorbidites commonly associated with weight gain, including diabetes, heart disease and high BP. 34
There have been pilot studies for older people using machine-learning techniques to generate a decision tree model that could be used to predict falls for the medical staff in the clinical settings and medical fields.33,35 Our findings might be useful in developing screening tools for fall risk of community-living older people and may have an impact beyond Hong Kong – the use of decision tree analysis for clinical algorithms for accidental falls in community-dwelling older people minimizes the time required for processing a big dataset and creates decision-making patterns, which also paves the way for utility-based decision making using supervised ML in fall risk detection for the older people in primary care settings in future. By the same token, it is not difficult to identify current research emphasize the use of ML in predicting fall incidence.11,12,36 Another benefit of a simple decision tree is that the model itself is easy to interpret and visualize. It also requires low computation, thus reducing the time to implement but carrying low accuracy compared with other advanced MI methods such as random forest etc. However, the clinician can know which variable and which value of the variable uses to split the data, predicting the faller outcome status quickly. Compared with a single decision tree, random forest is an advanced classification algorithm consisting of many decision trees combined to get a more accurate and precise result. It can also avoid and prevent overfitting by using multiple trees. Nonetheless, random forest consumes more computation time in the process of generating and analyzing. In case of all these reasons, decision tree analysis was adopted for preliminary reference in this manuscript instead of random forest algorithms. To pursue a predictive model with a higher accuracy rate and sensitivity that can be used in practice, more advanced ML methods such as random forest have been used in our study combined with different sampling methods such as oversampling, undersampling, both oversampling and undersampling as well as ROSE function. No matter which type of fallers (fallers, indoor fallers and outdoor fallers) were predicted under the random forest algorithm, it was found that the undersampling method showed the highest sensitivity (56.94%, 55.88% and 52.94%) among all the sampling methods although the accuracy rates were relatively lower (55.75%, 60.47% and 54.57%) when compared with other sampling methods. Due to this reason, the undersampling method could be considered to be the most reliable sampling method to deal with imbalance classification of falling incidence. More further research studies on different sampling scenarios on ML algorithms warrant investigation. Moreover, some advanced ML method such as support vector machine, etc. could be considered to be incorporated in future studies.
Our study had limitations. All participants were recruited in a primary care setting who only showed up for once, it would be difficult for us to conduct a lengthy comprehensive assessment during screening and a follow-up assessment for them after 1-year. Second, we did not take into account recurrent fallers because the incidence was small in the sample and the prediction model might not be accurate. However, the aim of our current study is to provide a clinical guide for supervised learning in ML, and the predictors have already been identified as potential predictive factors in the literature. Clinically, our decision trees are consistent with the evidence and the accuracy rates based on all the decision trees contribute to the model-fit. However, there might be variation due to sample bias and this may be due to inadequate power level.
Third, the sample size was comparatively small in terms of ML. In fact, it is hard to determine the minimum sample size of performing ML method for this type of data as it depends on a vast number of factors such as complexity of the problem, complexity of the learning algorithm etc. For example, large neural networks can be trained on billions of samples 37 while simple ML models can use only a few samples. 38 Fourth, the participants were healthy older adults resided in community dwellings, the algorithms developed in this study might not be useful to predict falls for the high-risk groups or those living in residential institutions. Moreover, cultural differences and national healthcare support structures can influence conclusions in this study that are not necessarily applicable in other countries.
Conclusion
We identified the predictive attributes for fallers generally, and indoor and outdoor fallers based on a fast screening assessment, specifically, using decision tree analysis for accidental falls in community-dwelling older people in a primary care setting, which could be used for developing a clinical algorithm for fall screening in the community. Our findings might be useful to assist clinicians in decision-making, which also paves the way for the future use of ML algorithms in fall risk detection in primary care settings.
Footnotes
Authors’ contributions
KNKF designed, coordinated, and carried out the study; KNKF and RCKC performed the statistical analysis and drafted the manuscript; PPCS coordinated and collected the data for the study; CKMN participated in its design and helped to draft the manuscript.
Competing interests
The authors declare that the study was funded by the Hong Kong Housing Society (Grant number: 5-ZJJX).
Declaration of conflicting interests
The author(s) declared no potential conflicts of interest with respect to the research, authorship, and/or publication of this article.
Funding
The author(s) disclosed receipt of the following financial support for the research, authorship, and/or publication of this article: This work was supported by the Hong Kong Housing Society (grant number 5-ZJJX).