
Abstract
Objective
Depression is a common mental health disorder and a major public health concern, significantly interfering with the lives of those affected. The complex clinical presentation of depression complicates symptom assessments. Day-to-day fluctuations of depression symptoms within an individual bring an additional barrier, since infrequent testing may not reveal symptom fluctuation. Digital measures such as speech can facilitate daily objective symptom evaluation. Here, we evaluated the effectiveness of daily speech assessment in characterizing speech fluctuations in the context of depression symptoms, which can be completed remotely, at a low cost and with relatively low administrative resources.
Methods
Community volunteers (N = 16) completed a daily speech assessment, using the Winterlight Speech App, and Patient Health Questionnaire-9 (PHQ-9) for 30 consecutive business days. We calculated 230 acoustic and 290 linguistic features from individual's speech and investigated their relationship to depression symptoms at the intra-individual level through repeated measures analyses.
Results
We observed that depression symptoms were linked to linguistic features, such as less frequent use of dominant and positive words. Greater depression symptomatology was also significantly correlated with acoustic features: reduced variability in speech intensity and increased jitter.
Conclusions
Our findings support the feasibility of using acoustic and linguistic features as a measure of depression symptoms and propose daily speech assessment as a tool for better characterization of symptom fluctuations.
Introduction
Depression is a leading cause of disability worldwide and a major global health concern. 1 Approximately 280 million people in the world suffer from this common but serious mental health condition.1,2 A person with depression is at increased risk of experiencing irritability, sadness, loss of appetite, cognitive or social impairment and suicidal thoughts.1,2 Clinical diagnosis of depression relies on self or caregiver reports of symptoms according to Diagnostic and Statistical Manual of Mental Disorders, Fifth Edition (DSM-5) or International Classification of Diseases 10th Revisions (ICD-10).3,4 The subjective and potentially biased assessment relies on the retrospective recall of episodes, complicating symptom evaluation even further. Digital measures can benefit clinical practice as they can address these problems through objective assessment of symptoms.5,6 Digital tools are more accessible and can be lower burden as they can be administered remotely and reduce time and resource investment. 7 Moreover, digital tools enable frequent assessments of symptoms at multiple time points, creating more detailed data at the individual level.
There have been efforts toward developing objective assessment tools for depression symptoms using innovative techniques from neuroimaging to speech.8,9 Neuroimaging can reveal brain changes in various medical conditions, and thus can be effective in understanding heterogeneous symptom profiles of patients.9,10 Similarly, speech production recruits many brain regions for generating linguistic representations from thoughts, and thus provides a window into cognitive and emotional processing through simple assessments. 11 Common acoustic features of speech (e.g. jitter and shimmer) represent the sound of the voice through mathematical deconstructions of the sound wave.12,13 On the other hand, linguistic features represent sentence generation, vocabulary and syntactic structures and sentiment, reflecting the content of speech and language.13,14 Through cutting edge analysis methods such as signal processing, computational linguistics, and machine learning, changes in speech and language patterns can provide insights into psychiatric disorders.15–18
Speech changes that accompany depression symptoms have been recognized for many years.17–19 Patients with depression show reduced fundamental frequency range, perceived as pitch, which reflects the monotonous speech often observed clinically.20–22 On the other hand, another set of acoustic features including the variability in fundamental frequency, jitter and shimmer tend to increase with the severity of depression, which are thought to be related to motor speech control and laryngeal musculature.21,22 In addition to the alteration in the way speech is produced, individuals with depression also exhibit changes in the linguistic content. They tend to use more first-person pronouns and negative emotional words.23–26 This may be reflective of a more self-regulatory cycle in which an individual's thoughts are focused on themselves. 27 As their thoughts about themselves, world and life become more negative, they begin using positive words much less frequently. Interestingly, this has been observed even among those who are not experiencing depression symptoms. 28
Speech and language measurements have the additional benefit of being easily collected remotely, increasing accessibility and lowering administrative burden. With the coronavirus (COVID-19) pandemic, the world entered a digital era in which more of our day-to-day activities could be performed remotely. This new shift in our lives also precipitated a shift to decentralized clinical trials and research, utilizing remote clinical assessments and requiring validation of such digital tools. 29 Another benefit of remote assessments is the ability to collect frequent data. Speech-based assessments are not only easily adaptable to decentralized, remote methods, but they also allow for daily administration with minimal instructions or involvement of clinicians.
Sampling speech more than once is necessary for accurate monitoring of specific speech characteristics related to depression30,31 as its symptoms exhibit irregular patterns and stochastic fluctuations. 32 In this study, our goals were to (a) evaluate the feasibility of collecting remote speech data, (b) determine the value in daily speech assessment, using the Winterlight Speech Assessment App, and (c) investigate which aspects of speech relate to depression symptoms, in order to validate the utility of daily speech assessment for detecting and monitoring symptoms of depression.
Methods
Procedure
This longitudinal, remote study included participants with or without psychiatric diagnoses. Participants completed daily speech assessments and mental health surveys remotely for 30 business days. This longitudinal data enabled us to examine how speech features and symptoms changed over different intervals of time and the reliability of frequent test administration. The study protocol was reviewed and approved by the Advarra Research Ethics Board and registered at clinicaltrials.gov (NCT04851912).
All participants completed three assessment types across 30 days: a practice assessment, followed by daily and bi-weekly assessments (Figure 1). The first session on Day 1 was a practice session. It allowed participants to get familiar with the speech tasks and data collection software, the Winterlight Speech App. Bi-weekly assessments were administered on Days 2 (first study session), 16 (midway through the study) and 30 (last study session). The remaining 26 days in between the three bi-weekly assessment days were part of the daily assessments.
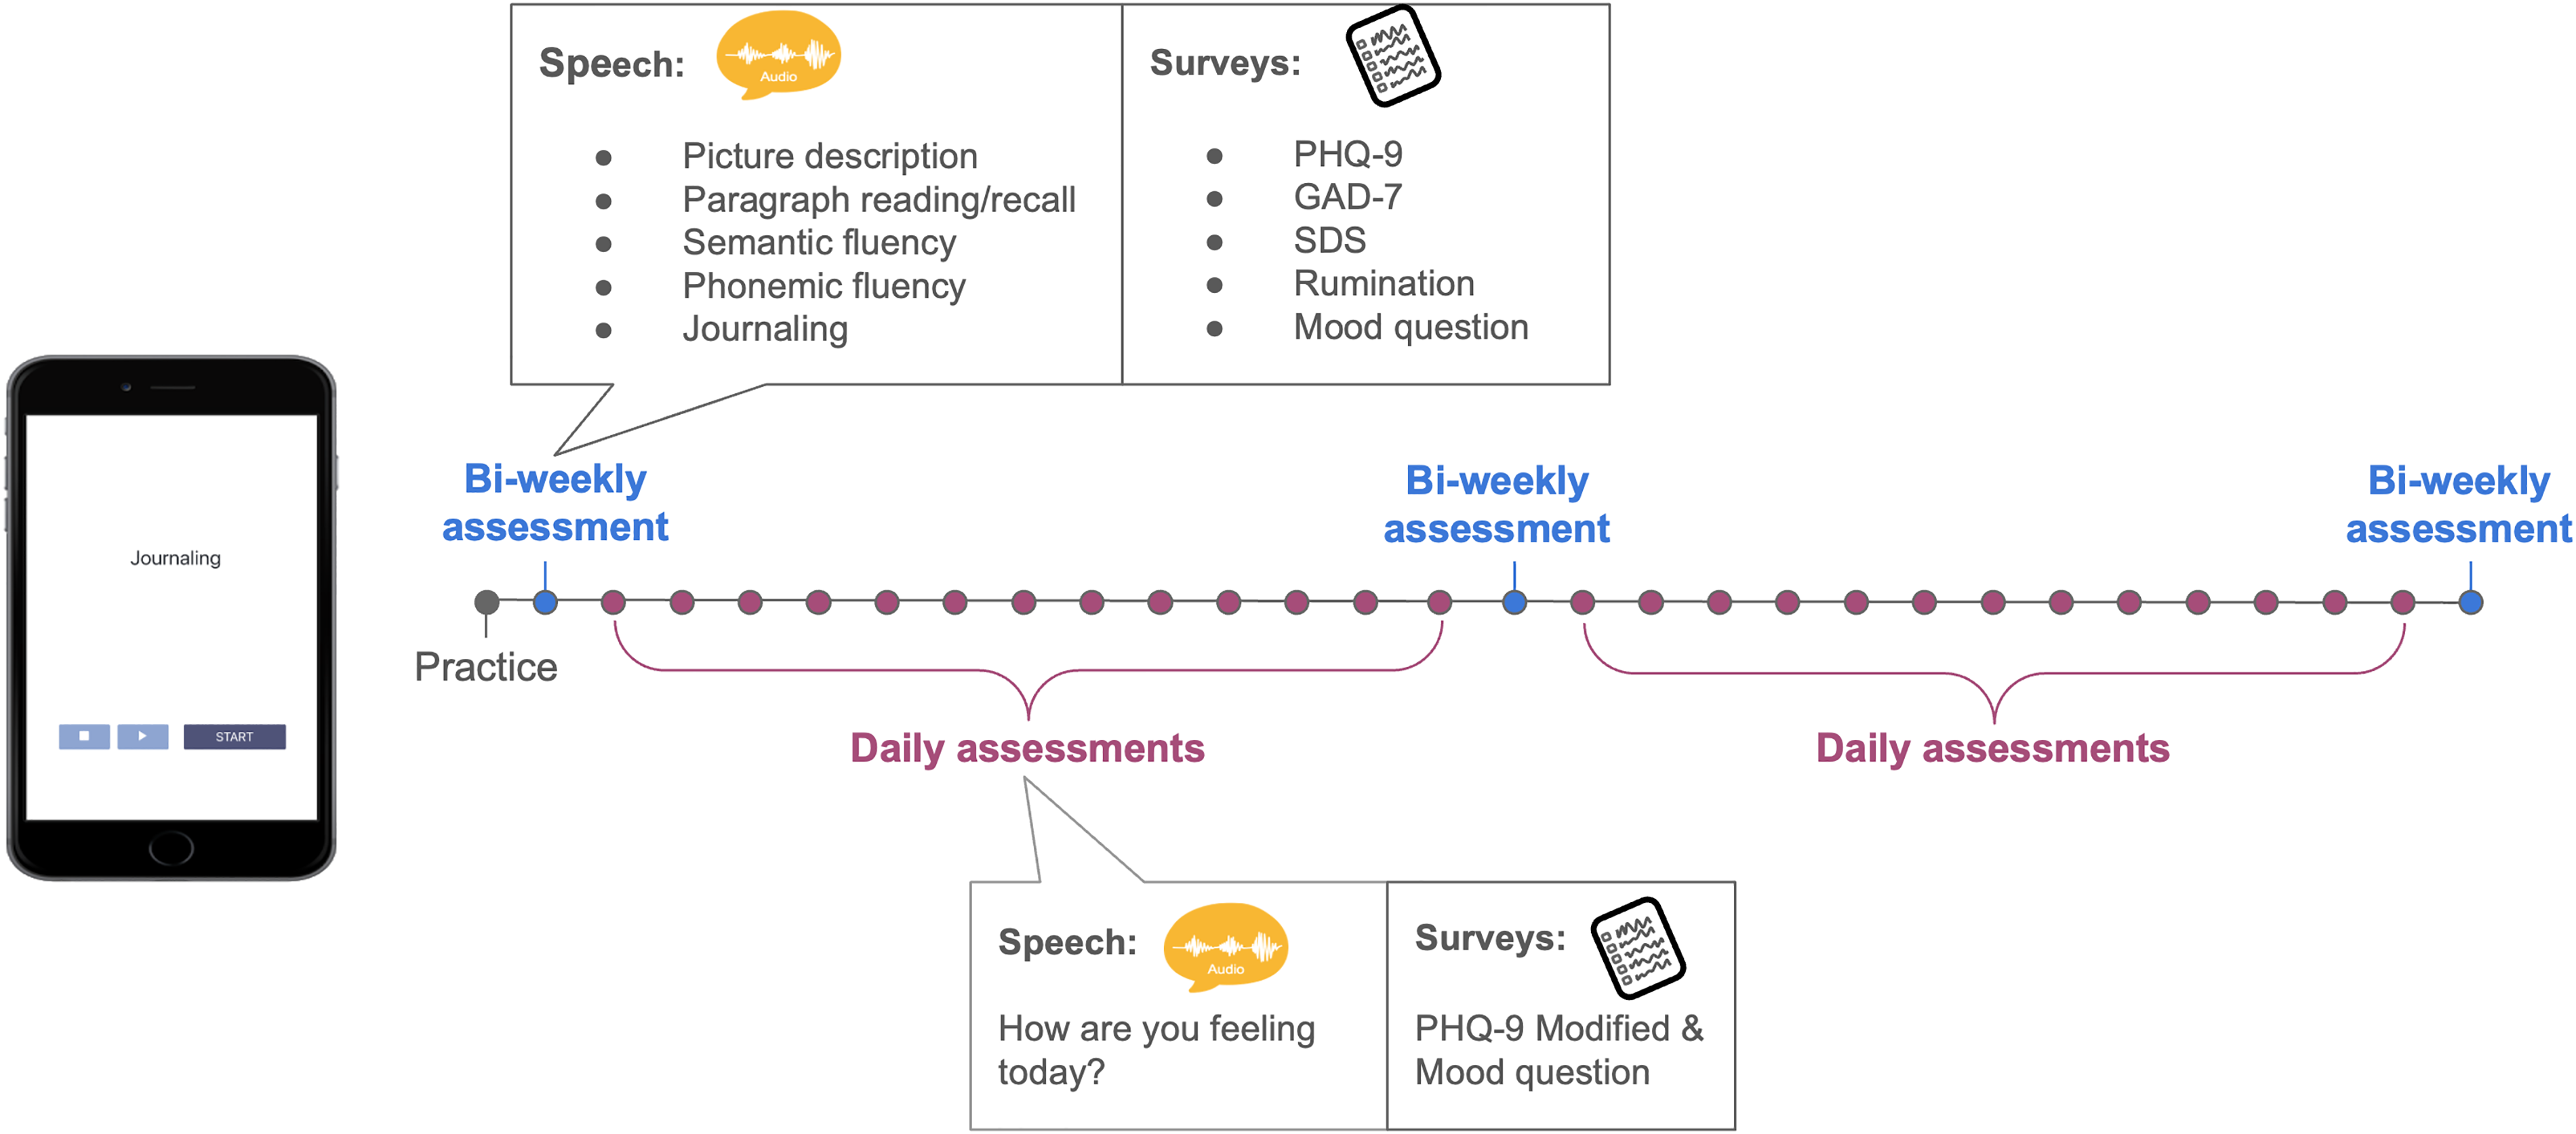
Study design integrating Winterlight Speech App. Participants completed 30 sessions in total: a practice, 3 sessions (start, midway and last day) as part of the bi-weekly assessments, 26 sessions in the daily assessments.
Bi-weekly assessments included six speech assessments: picture description, paragraph reading/recall, semantic fluency, phonemic fluency and journaling. There were five different mental health assessments: Patient Health Questionnaire-9 (PHQ-9), 33 Generalized Anxiety Disorder (GAD-7), 34 Sheehan Disability Scale (SDS), 35 a rumination scale, and a mood questionnaire. These assessments were selected and administered to reflect ecological momentary assessments (EMAs), which allow for repeated assessment of an individual in their naturalistic environment.36,37 On the other hand, daily assessments only included an open-ended journaling speech task as well as modified versions of the PHQ-9 and mood assessments. We only analyzed journaling tasks and PHQ-9 scores from the bi-weekly assessments to be consistent with the daily data.
Participants
Participants were recruited from the community through online advertisement. Written consent was obtained from each participant prior to their participation in the study. To be eligible for the study, participants needed to be between the ages of 18 and 95, fluent English speakers (i.e. either English as their first language or they can speak with conversational proficiency) and own an iOS device (iPhone or iPad). The exclusion criteria included the following: residing outside of Canada or the United States, having experienced a chronic alcohol or drug dependence within the last 5 years, and being identified with a clinically significant vision or hearing impairment. After obtaining the written consent, participants were invited for a conference call with a member of the study team, M.G. During these sessions, M.G. collected demographic information and assisted participants with Winterlight Speech App installation on their devices. If participants preferred to skip the tutorial session and were comfortable with app installation, then their demographic information was collected via email. They all received the tutorial slides via email. Participants were compensated for $5 per session, earning up to $155 in total for participating in all 30 sessions and the tutorial.
Winterlight Speech Assessment (iOS App)
All speech assessments were conducted using the Winterlight Lab Speech App. Participants logged into their accounts to complete the speech assessments using their individual username and password. Upon login, the speech assessments associated with that day were available to them. All 30 days included a journaling task, with the prompt, “How are you feeling today?.” Participants were instructed to provide as much detail as they preferred, and there was no time limit for the task. Once participants pressed start, the device's microphone recorded their speech until they indicated they were finished with the task. Audio recordings were uploaded to secure servers for analysis upon connection to wifi or cellular signal.
Speech features
The speech samples recorded by the participants were transcribed by trained transcriptionists who ensured the audio contained participant speech and flagged samples with audio issues (e.g. no audible speech, very poor-quality audio), for removal. Acoustic and linguistic features were then computed using the Winterlight Labs pipeline (www.winterlightlabs.com), which uses Python-based acoustic and natural language processing libraries and custom code to compute 520 speech features based on each speech recording and its accompanying transcript. These variables reflect the acoustic (e.g. properties of the sound wave, speech rate, number of pauses), lexical (e.g. rates and types of words used, and their characteristics such as frequency and imageability, which reflect how commonly words are used and how easy they are to picture, respectively), semantic (relating to the meaning of the words, e.g. semantic relatedness of subsequent utterances, semantic relatedness of utterances to the items in the picture) and syntactic (relating to the grammar of the sentences, e.g. syntactic complexity, use of different syntactic constructions) properties of the sample. Open source packages include SpaCy for parts-of-speech tagging and morphological features, 38 the Stanford NLP parser for syntactic features, 39 Praat and Parselmouth for acoustic features,40,41 and GloVe and FastText models for semantic features.42,43 The pipeline also uses custom code to compute additional features based on the transcript and audio file, using lexical norms from previous publications44–47 or previously published models and features. 48 An overview of the features categories, definitions, feature numbers, and examples is provided in Table 1.
Speech feature overview, definitions, numbers, and examples.

Clinical assessments
We only analyzed the PHQ-9 in this paper for consistency between daily and bi-weekly data. The PHQ-9 was administered through a link to an online form. The questionnaires used in this study are presented in Supplementary Material. All other mental health assessments were combined with the PHQ-9 into one form for the convenience of the participants. The PHQ-9 is a well-established self-rated measure for depression symptoms. 33 It contains 9 questions which correspond to the core DSM criteria for depression, with each question ranging from 0 to 3 points for a total of 27 points. It has been validated against clinician rated measures and cut-off scores are well established. In bi-weekly assessments, we used the PHQ-9 with a traditional scoring system. For daily assessments, we used a modified version of the PHQ-9. The questions remained the same but were modified to refer to the current day (rather than past 2 weeks) and answers ranged from 1 to 7 points for a total of 63 points, with higher scores indicating more depression systems. The reason for using modified PHQ-9 was to adapt it to reflect daily assessments and increase the answer range due to concerns that the original scale may not having enough dynamic range to detect small daily variations. For interpretability of our results, we downscaled the total scores obtained through modified PHQ-9, so they reflect the original scale with a total of 27 points.
Statistical analysis
All analyses were completed on R statistical software, version 4.1.2. 49 Repeated measures correlation (rmcorr) 50 was used to evaluate within-individual associations between the speech features and depression/mood symptoms across multiple time points. We eliminated acoustic and linguistic features that had empty values for at least 20% of participants. The empty values were due to most of these features being specific to other tasks such as picture description and not relevant to the task of interest (i.e. journaling). This data cleaning process yielded 262 acoustic and linguistic features in our analyses. We fit separate rmcorr models to each of these features to investigate their unique relationship with modified PHQ-9 scores at the individual level. This linear association was represented with a correlation coefficient (rrm) and allowed us to investigate common intra-individual associations without violating independence assumptions or requiring simple averaging across sessions. Repeated measure correlation plots demonstrate the linear fit for each participant, providing a visual representation of a particular speech-depression relationship across participants. Statistical significance was set to an alpha level equal to 0.0002 taking multiple comparisons into consideration through the Bonferroni correction method (0.05/262 features).
Results
Demographics
The study included 16 participants (11 females, 5 males) with an age range of 21–54 (M = 30.75 ± 9.28). Four participants reported to be on emotional or behavioral medications and five reported using medications for their physical health (Table 2). The daily assessments had a completion rate of 93% for both speech assessments and surveys with only 1 participant discontinuing participation in the second half of the study due to personal reasons. At baseline (on Day 2 as Day 1 was practice), participants reported a mean depression score of 6.47 ± 6.24 on PHQ-9 assessment.
Participant demographics.

Daily speech assessments relate to depression
We examined correlations between speech characteristics and depression symptoms collected daily for 26 sessions. At the intra-individual level, we found a significant relationship between linguistic features such as sentiment scores (i.e. a measure of the average valence or dominance score of each word used) and depression scores reported on the PHQ-9. According to repeated measures correlations, sentiment dominance, rrm (370) = −0.31, 95% CI [−0.40, −0.22], p < 0.001, and sentiment valence, rrm (370) = −0.34, 95% CI [−0.43, −0.25], p < 0.001, were related to depression scores (Figure 2(a) and 2(b)), with higher scores relating to more negative and less dominant words used. The sentiment features were calculated by taking the average valence scores, representing the positivity or negativity of each word, and dominance scores, representing whether a word denotes being in control or feeling controlled, for all words in the transcript that had normative values available. 47 These associations remained significant following a Bonferroni correction for multiple comparisons at the alpha level of 0.0002.

Daily assessments, through repeated measure analyses (rmcorr), capture the intra-individual associations between depression scores on modified PHQ-9, and acoustic and linguistic speech features. Each dot represents the feature value and corresponding PHQ-9 score from each assessment. Each participant is represented with a different color with corresponding lines showing the rmcorr fit for each participant. Linguistic features including (A) sentiment dominance and (B) valence were negatively correlated with depression scores. Among the acoustic features, (C) intensity range was negatively associated with depression while (D) jitter showed a positive relationship.
We also observed significant correlations between acoustic features and depression scores in the repeated measures analyses. At the intra-individual level, higher depression scores were associated with lower vocal intensity range (i.e. speech volume), rrm (370) = −0.22, 95% CI [−0.32, −0.12], p < 0.001, but greater jitter, rrm (370) = 0.24, 95% CI [0.14, 0.34], p < 0.001 (Figure 2(c) and (d)). Intensity range is the difference between the maximum and minimum of the intensity curve of the recording, representing the range of perceived loudness. Jitter is a calculation of the average absolute difference between consecutive periods in an acoustic signal, used as a measure of vocal quality. Significance remained after a Bonferroni correction for multiple comparisons at the alpha level of 0.0002
Unclear link between speech and depression in bi-weekly data
Depression scores exhibited daily variability within individuals over 20+ sessions (Figure 3(a)). We investigated whether the speech-depression relationships observed in daily data, discussed above, could be detected from our bi-weekly assessments alone, whose sessions are spaced 2 weeks apart. We chose this cadence because the commonly used PHQ-9 asks participants to reflect on their feelings from the past 2 weeks. Thus, a 2-week data collection is typical. We note that by virtue of being bi-weekly, this analysis contained fewer observations and therefore had reduced power compared to the daily assessment analysis.

Daily fluctuations of individual depression scores are not captured with bi-weekly assessments. (A) Participants’ PHQ-9 scores in daily assessments (20+ days) are plotted separately, depicting daily symptom fluctuations within individuals. Each color represents a different participant in the study, with boxplots depicting median PHQ-9 scores and their variation. Regarding linguistic features, the linear relationship between sentiment dominance and depression is negative on Day 2 (B) but positive on Day 30 (C), both of which are not significant. Assessments over three sessions (D) are not capturing the negative association between sentiment scores and depression observed in daily assessments in repeated measures analyses through rmcorr. For the acoustic features, the linear relationship between jitter and depression is negative on both Days 2 (E) and 30 (F), both of which are also not significant. Repeated measure analysis over three sessions (G) through rmcorr is also not capturing the positive relationship between jitter and depression that we have seen in the daily analyses. (B), (C), (E) and (F) show simple regressions: each dot represents an independent observation on specific time points. The purple line is the simple regression fit. In (D) and (G), rmcorr: each participant is represented with different colors with corresponding lines showing the rmcorr fit for each participant.
When we restricted our analyses to bi-weekly time points (i.e. Days 2, 16, and 30), we found that acoustic and linguistic features were not significantly associated with depression scores as reported using the standard PHQ-9. This indicates the importance of large sample size, especially in the studies with relatively low number of study sessions. For example, although nonsignificant, the link between sentiment dominance and depression scores had a negative trend on Day 2, r2 = 0.08, F(1, 13) = 2.17, β = −0.02, p = 0.16, 95% CI [−0.04, 0.008], but had a positive trend on Day 30, r2 = 0.03, F(1, 12) = 1.38, β = 0.01, p = 0.26, 95% CI [−0.01, 0.03] (Figure 3(b) and (c)), showing that patterns were inconsistent with bi-weekly sampling and small sample size. Similarly, we investigated the relationship between sentiment dominance and depression in bi-weekly data, using repeated measures analysis. Three visits were not sufficient to capture the significant negative association between the sentiment dominance and depression scores reported within the daily assessments, rrm (28) = 0.01, 95% CI [−0.36, 0.39], p = 0.94 (Figure 3(d)).
Bi-weekly data also did not show any significant correlations between acoustic features and depression scores. For example, jitter in speech and depression had a negative, but not significant relationship on both Day 2, r2 = −0.04, F(1, 13) = 0.47, β = −0.0002, p = 0.50, 95% CI [−0.001, 0.0005], and Day 30, r2 = −0.07, F(1, 12) = 0.12, β = −0.0001, p = 0.74, 95% CI [−0.001, 0.0007] (Figure 3(e) and (f)). Repeated measure analysis over three time points was also not sufficient to capture the significant positive relationship reported between jitter and depression in the daily data, rrm (28) = −0.05, 95% CI [−0.41, 0.33], p = 0.80 (Figure 3(g)).
Discussion
This study provided evidence for the feasibility of daily speech assessments in monitoring depression scores and demonstrated the success of remote, app-based speech data collection. The Winterlight Speech Assessment app was easily accessible and required relatively less time and resources than in-person assessments. It also enabled collection of daily speech recordings, providing extensive data for each individual over a short study duration. Our daily assessments captured daily variations in individual depression scores. Fluctuations in depression symptoms have been previously reported in the literature. 32 Our results indicated that daily speech assessments could help characterize individual variability in depression scores as they capture increased variability in the depressive states of an individual. For example, those with high depression scores used more negative, less authoritative words (i.e. low sentiment and dominance scores), and their speech intensity range was reduced with increased vocal jitter. However, these speech-depression relationships were not detected in the bi-weekly assessments (i.e. over 1–3 sessions). Although the daily and bi-weekly assessments differed in the amount of data, we hypothesize that larger sample sizes would be required to detect the speech-depression associations in bi-weekly data. On the other hand, daily data even in small studies can more accurately characterize the relationship between depression, and linguistic and acoustic speech features at the individual level, capturing daily fluctuations and improving the sensitivity of assessments.
Individuals with higher depression scores tend to use less dominant and more negatively valenced words. Linguistic speech features, specifically sentiment dominance and valence, presented a significant association with depression scores measured with the PHQ-9. As the participants reported feeling more depressed, their sentiment dominance and valence scores decreased, meaning the words they chose to describe their daily feelings were not as positive and denoted feeling less in control. These findings are in line with the literature where depressed individuals were shown to use less positive or emotional words.23,24 More importantly, our findings revealed this relationship between the use of less dominant and more negative words and depression symptoms, in a non-clinical, normative population. A recent study also showed that subtle changes in speech can related to depression symptoms in non-clinical population. 51 These relationships may be stronger in clinical samples with higher depression severity. The linguistic speech features provide us a potential objective measure to monitor the symptoms of not only depressed individuals but also those at risk for or more vulnerable to experiencing depression symptoms. These findings also overlap with Beck's cognitive theory of depression: the negative thoughts are central to depression, which, in fact, precedes any other physiological or mood symptoms.52,53
In addition to the content of the speech, the way speech is produced (i.e. acoustic speech features) was also altered with depression symptoms. Our results revealed that higher depression scores were correlated with reduced intensity range and increased jitter (i.e. variability in speech frequency) in speech, which are consistent with the literature.17,18 Acoustic features are directly affected by laryngeal muscles, and the changes in acoustic features could imply changes to vocal prosody and muscle tension. 54 Depressed patients have previously been reported to exhibit reduced speaking intensity. 55 This could be one of the factors contributing to monotonous speech prosody observed in patients with depression. 31 Similarly, previous literature reports greater jitter in the speech of patients with depression which could be the signature of muscle tension, resulting in more rough or hoarse speech. 56 Observing similar findings in a non-clinical population suggests that speech has the potential as a digital measure for detecting and monitoring even the mild symptoms of depression.
Longitudinal studies enable detection of speech changes over time, accounting for symptom fluctuations in psychiatric disorders. For example, changes in speech rate over time were shown to be correlated with depression scores in patients with major depressive disorder and bipolar disorder. 57 Similarly, speech articulatory coordination was reported as a way of detecting depression symptoms in patients who were receiving treatment. 58 Speech was also investigated in response to antidepressant treatment and as a biomarker for depression severity. Although patients with depression initially showed longer speech pauses, their speech was shortened following treatment. 31 These studies are crucial in assessing speech and symptom fluctuations. However, following up with participants over time, at multiple time points, requires extensive time, effort and resources. In this validation study, we propose that daily speech assessments as an efficient and effective tool for data collection and tracking individual differences over time.
One of the limitations of the study was that the data was collected during the COVID-19 pandemic. The stress related to work and life adjustments, reduced social interactions, and the resulting anxiety and worry might have impacted self-reported depression symptoms as well as the content of participants’ speech. Regardless of the source of the depression-like symptoms, we were able to observe a relationship between speech features and depression scores at the individual level. However, future studies should investigate the differences between clinical and non-clinical populations using daily speech assessments and evaluate the robustness of speech-depression relationship over time. In addition, the scales of questions in daily and bi-weekly assessments were not ideally matched. We implemented the original PHQ-9 in the bi-weekly assessments such that each question ranged between 0 and 3, referring to the frequency of a symptom occurring within the last 2 weeks. In daily assessments, the PHQ-9 was modified so that each question remained the same, but the question referred to the current day and ranged between 1 and 7. The larger scale was implemented to better capture the daily fluctuations, which was later rescaled for comparison with the bi-weekly assessments. Future research should implement assessments with similar scales to control for any potential influences of scale differences on individuals’ choice of scores.
Although our sample size was relatively small, we assessed daily speech and depression scores of each participant, sampling them at multiple time points. This study was conducted as an exploratory study to test the effectiveness of daily speech assessments. Repeated measures analyses with 20+ time points allowed us to focus on intra-individual variability, and thus, enabled us to use a smaller sample. The power of repeated measures analyses through rmcorr, increases exponentially by either the sample size or the number of observations. Although repeated measure analyses on daily assessments had a relatively high power, it is necessary to investigate the findings from bi-weekly assessments in more than three time points. These findings should be replicated in larger samples as well as in more sophisticated analyses such as deep learning. Our focus on this paper was to validate that daily speech assessments provide a feasible, objective digital tool, and to identify candidate speech features that track fluctuations in symptoms. Future research should build on this work, and others, to implement deep learning or classification models to potentially develop speech biomarkers based on daily assessments and investigate how speech can potentially inform symptom changes in remission and relapse.
Conclusion
The present study tested the potential of using daily speech assessment as a digital tool for monitoring depression symptoms. Here, we demonstrated that daily speech assessments can capture signals relating to the daily depression symptom fluctuations, providing a replication of the speech-depression associations reported in the literature. Our findings highlight that this speech-depression relationship is not only specific to high severity clinical populations and suggests that speech has the potential to be used as a digital measure for detecting those at risk of or more vulnerable to depression. Speech, as a promising digital measure, not only provides an opportunity to objectively assess depression symptoms, but also allows for remote data collection. While many other techniques are costly and require in-person administration, speech assessments are accessible and allow for frequent administration, which can complement more in-depth clinical assessments and help make tools for monitoring symptoms more accessible. Daily speech assessment holds the potential to be used as a digital measure for monitoring symptoms in depression and many other psychiatric diseases.
Supplemental Material
sj-docx-1-dhj-10.1177_20552076231180523 - Supplemental material for Evaluating the utility of daily speech assessments for monitoring depression symptoms
Supplemental material, sj-docx-1-dhj-10.1177_20552076231180523 for Evaluating the utility of daily speech assessments for monitoring depression symptoms by Melisa Gumus, Danielle D DeSouza, Mengdan Xu, Celia Fidalgo, William Simpson and Jessica Robin in DIGITAL HEALTH
Footnotes
Acknowledgements
The authors would like to thank the employees of Winterlight Labs for their help and support throughout the study and the study volunteers who participated in the research.
Contributorship
MG, DDD, CF, WS, and JR designed the study. MG conducted the study, collected/analyzed the data, interpreted the results, and wrote the first draft. MX assisted with analyses. DDD helped with interpretation. JR supervised the project. All authors reviewed and edited the manuscript.
Declaration of conflicting interests
The authors declared the following potential conflicts of interest with respect to the research, authorship, and/or publication of this article: MG, MX, CF, WS and JR are employees of Winterlight Labs.
Ethics approval
The study was approved by the Advarra Research Ethics Board.
Funding
The authors disclosed receipt of the following financial support for the research, authorship, and/or publication of this article: This study is funded by Winterlight Labs.
Guarantor
Not applicable.
Supplemental material
Supplemental material for this article is available online.
References
Supplementary Material
Please find the following supplemental material available below.
For Open Access articles published under a Creative Commons License, all supplemental material carries the same license as the article it is associated with.
For non-Open Access articles published, all supplemental material carries a non-exclusive license, and permission requests for re-use of supplemental material or any part of supplemental material shall be sent directly to the copyright owner as specified in the copyright notice associated with the article.