
Abstract
The novel coronavirus disease 2019 (COVID-19) is a contagious disease with high transmissibility to spread worldwide, reported to present a certain burden on worldwide public health.
This study aimed to determine epidemic occurrence probability at any reasonable time horizon in any region of interest by applying modern novel statistical methods directly to raw clinical data. This paper describes a novel bio-system reliability approach, particularly suitable for multi-regional health and stationary environmental systems, observed over a sufficient period of time, resulting in a reliable long-term forecast of the highly pathogenic virus outbreak probability.
For this study, COVID-19 daily recorded patient numbers in most affected Sweden regions were chosen. This work aims to benchmark state-of-the-art methods, making it possible to extract necessary information from dynamically observed patient numbers while considering relevant territorial mapping.
The method proposed in this paper opens up the possibility of accurately predicting epidemic outbreak probability for multi-regional biological systems. Based on their clinical survey data, the suggested methodology can be used in various public health applications.
Key findings are:
A novel spatiotemporal health system reliability method has been developed and applied to COVID-19 epidemic data. Accurate multi-regional epidemic occurrence prediction is made. Epidemic threshold confidence bands given.
Introduction
The main motivation of this study was to apply a novel reliability method, newly developed by the authors, to a contemporary unfiltered health system data set.
Statistical aspects of COVID-19 (SARS-CoV-2) and other similar recent epidemics were receiving much attention in the modern research community. 1 Generally, it is challenging to calculate realistic biological system reliability factors and outbreak probabilities under actual epidemic conditions by using conventional theoretical statistical methods.2–11 The latter is usually due to many degrees of system freedom and random variables governing dynamic biological systems spread over extensive terrain.12–16 In general, the reliability of a complex bio-system may be accurately assessed straightforwardly by having enough measurements or by using direct Monte Carlo simulations (if such a model is available). For COVID-19, however, the only available observation numbers are limited by the beginning of the year 2020. Motivated by the latter argument, the authors have introduced a novel reliability method for biological and health systems to predict and manage epidemic outbreaks more accurately. His study focused on COVID-19 epidemics in Sweden, focusing on cross-correlations between different regions within the same climatic zone. Sweden was chosen because of its COVID-19 origin and extensive health observations and related research available online.4,17–29 For other studies related to statistical variations per country. 17
In this paper, an epidemic outbreak is viewed as an unexpected incident that may occur in any region of a given country at any time; therefore, the spatial spread is accounted for. Moreover, a specific non-dimensional factor
Biological systems are subjected to ergodic environmental influences. The other alternative is to view the process as being dependent on specific environmental parameters whose variation in time may be modelled as an ergodic process on its own.
The incidence data of COVID-19 in 21 Sweden regions from February 2020 until today were retrieved from the public website. 30 As this valuable dataset is per Sweden region, the biological system under consideration can be regarded as a multi-degree of freedom (MDOF) dynamic system with highly inter-correlated regional components/dimensions. Some recent studies have already used statistical tools to predict COVID-19 development. For the linear log model, see Chu. 2
Note that while this study aims to reduce the risk of future epidemic outbreaks by predicting them, it is solely focused on daily registered patient numbers and not symptoms. For long-lasting COVID-19 symptoms, the so-called ‘long COVID’, and its risk factors and whether it is possible to predict a protracted course early in the disease. Figure 1 presents the map of Sweden's regions (counties).

Left: Map of Sweden with regions (counties) with recorded COVID cases. Right: Coronavirus image.
Methods
Let one consider a MDOF bio-system represented by either response or environmental load, or combined response/load vector

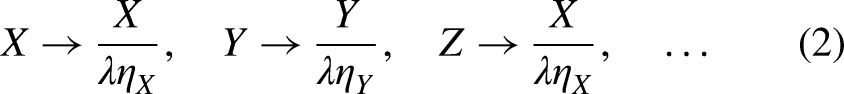

Example of how two components, X and Y, are merged to create a new synthetic vector
Now the non-decreasing synthetic vector
Figure 3 presents a schematic flowchart, sketching the suggested methodology as a tool for epidemic spread surveillance.

Flowchart, sketching suggested methodology.
Results
Prediction of influenza-like epidemics has long been the focus of attention in epidemiology and mathematical biology. It is well known that public health dynamics is a highly non-linear multidimensional and spatially cross-correlated dynamic system that is always challenging to analyse. Previous studies have used a variety of approaches to model influenza-like cases. This section illustrates the efficiency of the above-described methodology using the new method applied to the real-life COVID-19 datasets, presented as a new daily recorded infected patient time series spread over large terrains.
COVID-19 and influenza are contagious diseases with high transmissibility to spread worldwide with considerable morbidity and mortality. They occur most frequently seasonally in late autumn, winter and early spring, reaching their peak prevalence mostly in winter. Seasonal influenza epidemics caused by influenza A and B viruses typically occur annually during winter in temperate regions and present an enormous burden on worldwide public health, resulting in around 3–5 million cases of severe illness and 250,000–500,000 deaths worldwide each year, according to the World Health Organization (WHO). 3
This section presents a real-life application of the above-described method. The statistical data in the present section are taken from the official Sweden website.
30
The website provides the number of newly diagnosed cases every day in Sweden from 22 January 2020 to 6 May 2022. Patient numbers from 21 different Sweden regions were chosen as components
Figure 4 presents new daily recorded patients number plotted as a surface. Figure 5 presents the number of new daily recorded patients as a 21D vector

New daily recorded patients number plotted as a surface: Provinces and time dependency.

Number of new daily recorded patients as 21D vector
Figure 6 (left) presents 100 years return level extrapolation according to equation (9) towards epidemic outbreak with 100 year return period, indicated by the horizontal dotted line, and somewhat beyond,

Left: 100 years return level (horizontal dotted line) extrapolation of
Note that while being novel, the above-described methodology has a clear advantage of utilising available measured data sets quite efficiently due to its ability to treat health system multi-dimensionality and perform accurate extrapolation based on a quite limited data set. Note that the predicted non-dimensional
The second-order difference plot (SODP) originated from the Poincare plot. SODP provides observing the statistical situation of consecutive differences in time series data.
Figure 6 (right) presents the SODP plot. This kind of plot can be used for data pattern recognition and comparison with other data sets, for example, for the entropy artificial intelligence (AI) recognition approach. 36 Note that EVT is asymptotic and 1DOF, while this study introduces MDOF and sub-asymptotic approaches. To summarise, the predicted non-dimensional λ level, indicated by the star in Figure 6 (left) represents the probability of world cancer deaths in the years to come. The methodology's limitation lies in its assumption of the underlying bio-environmental process quasi-stationarity.37,38
Discussion
Traditional health systems reliability methods dealing with observed time series do not have the advantage of dealing efficiently with systems possessing high dimensionality and cross-correlation between different system responses. The key advantage of the introduced methodology is its ability to study the reliability of high dimensional non-linear dynamic systems.
Despite the simplicity, the present study successfully offers a novel multidimensional modelling strategy and a methodological avenue to implement the forecasting of an epidemic during its course.
This paper studied recorded COVID-19 patient numbers from 21 different Sweden regions, constituting an example of a 21 dimensional (21D) observed in 2020−2022. The novel reliability method was applied to new daily patient numbers as a multidimensional system in real-time. The theoretical reasoning behind the proposed method is given in detail. Note that the use of direct either measurement or Monte Carlo simulation for dynamic biological system reliability analysis is attractive; however, dynamic system complexity and its high dimensionality require the development of novel robust and accurate techniques that can deal with a limited data set at hand, utilising available data as efficient as possible.
The main conclusion is that Sweden's public health system under local environmental and epidemiologic conditions is well managed. The predicted 100-year return period risk level
Various authors with different approaches have shown the usage of statistics through EVT and other models in medicine. One such method used the block maxima approach, while another used the Peak Over Threshold approach to estimate the distribution of extremes. Even though both these studies showed their suitability for estimating the extreme values, each of them had its limitations, with one of them requiring a large amount of data.
This study further aimed to develop a general-purpose, robust, and straightforward multidimensional reliability method. The method introduced in this paper has been previously validated by application to a wide range of simulation models, but for only one-dimensional system responses and, in general, very accurate predictions were obtained. Both measured and numerically simulated time series responses can be analysed. It is shown that the proposed method produced a reasonable confidence interval. Thus, the suggested methodology may become appropriate for various non-linear dynamic biological systems reliability studies. Finally, the suggested methodology can be used in many public health applications. The presented COVID-19 example does not limit areas of new method applicability.
The major limitations of the suggested approach are as follows:
Manipulated underlying data set Underlying trend System non-stationarity
While, as mentioned, C is not a major obstacle for the suggested method, future works may extend current findings to cope with B's limitation, namely to identify the underlying trend.
Footnotes
Availability of data and materials
The datasets analysed during the current study are available online. 30 The authors confirm that all methods were performed following the relevant guidelines and regulations according to the Declarations of Helsinki.
Contributorship
All authors contributed equally to this work.
Declaration of conflicting interests
The authors declared no potential conflicts of interest with respect to the research, authorship, and/or publication of this article.
Ethical approval
Not applicable.
Funding
The authors received no financial support for the research, authorship, and/or publication of this article.
Informed Consent
Not applicable, as no patients were involved in this study.