
Abstract
Background
The global demographic situation has been significantly impacted by the COVID-19 pandemic. The objective of this study was to develop a model that predicts the risk of COVID-associated mortality using clinical and laboratory data collected within 72 h of hospital admission.
Materials and methods
A total of 3024 subjects with PCR-confirmed COVID-19 were admitted to Almazov National Research Medical Center between May 2020 and August 2021. Among them, 6.25% (n = 189) of patients had a fatal outcome. Five machine learning models and the Boruta-SHAP feature selection method were utilized to assess the risk of mortality during COVID-19 hospitalization.
Results
All methods demonstrated high efficacy, with ROC AUC (Receiver Operating Characteristic Area Under the Curve) values exceeding 80%. The selected Boruta-SHAP features, when incorporated into the random forest model, achieved an ROC AUC of 93.1% in the validation.
Conclusion
Throughout the study, close collaboration with healthcare professionals ensured that the developed tool met their practical needs. The success of our model validates the potential of machine learning techniques as decision support systems in clinical practice.
Keywords
Introduction
The COVID-19 pandemic has had a significant negative impact on the global demographic situation. 1 According to the WHO Coronavirus (COVID-19) Dashboard, approximately 7 million deaths associated with SARS-CoV-2 infection have been reported since the beginning of the pandemic. 2 Since that time, researchers are focused on identifying risk factors for COVID-19 mortality to inform effective prevention, treatment, and patient management strategies. 3 A systematic review, published by M. Sepandi et.al, investigated the factors influencing mortality rates among COVID-19 patients. The study identified several key determinants associated with mortality, including age, gender, comorbidities, and clinical symptoms. These findings underscore the significance of considering patient demographics and underlying health conditions when assessing the risk of severe outcomes in COVID-19 patients. 4 The recent review of healthcare systems in 28 countries highlighted that the use of medical devices and technologies played a crucial role in maintaining their sustainability. 5 In this context, predictive measurements and risk assessment systems using artificial intelligence and machine learning models are considered to be crucial technologies.6,7 At the same time, a recently published meta-analysis by Yu Xin and coauthors, aimed at assessing the value of artificial intelligence applications in predicting mortality among COVID-19 patients, showed high accuracy and significant prognostic value in predicting mortality among COVID-19 patients. 8 Thus, the lack of specialized and validated comprehensive scales for assessing the risk of COVID-19 at the beginning of the pandemic created high demand for to the development of an algorithm for predicting mortality risk upon hospital admission. The objective of this study was to develop a model that predicts the risk of COVID-associated mortality using clinical and laboratory data collected within 72 h of hospital admission.
Material and methods
Data processing
The study investigated retrospectively data from 3161 confirmed COVID-19 patients hospitalized at the Almazov National Medical Research Center from May 13, 2020, to the end of August 2021 (Figure 1).

Data processing.
Symptoms, concomitant diseases, vital signs at admission and outcomes were downloaded from the electronic medical records (EMR). Laboratory results were collected for all patients during the first 72 h of admission through the hospital information system. Confirmation of cases was based on real-time polymerase chain reaction (RT-PCR) for SARS-CoV-2 of nasal or oropharyngeal swab samples on the first days of hospitalization. The outcome of current study was death (outcome = 1) versus discharge (outcome = 0) from the hospital.
Significant features obtained within the initial 72-h period of hospitalization, relevant for the development of machine learning algorithms, are outlined in Table 1.
Key features for machine learning development, identified within the first 72 h of hospitalization.

Drop duplicated, drop outlier, and data imputation
The 15 duplicated records were removed from dataset and 122 were dropped during outlier Grubbs’ test, which could lead to less effective and less useful models. K-Nearest Neighbors method used to impute missing values through the multivariate imputer that estimates each feature from all the others.
Feature selection
During analysis using Boruta-SHAP feature selection method, 15 most significant features (Figure 2) were selected according to in the opinion of the algorithm affecting survival patients. This method combines the Boruta feature selection algorithm with Shaply values, reducing the number of features from 24 to 15. In machine learning tasks, there are often too many variables to handle effectively. When manual input is required, the risk of errors increases significantly. Additionally, some features can be highly redundant, introducing noise into the dataset and making their inclusion in training data unnecessary. This is where feature space reduction becomes essential. It is crucial to ensure that meaningful features present in the data are not lost during this transformation. The problems encountered when using high-dimensional data include increased risk of overfitting the machine learning model, difficulty in clustering similar feature, increasing space and computational time complexity. These issues highlight the importance of feature reduction as a preprocessing step in machine learning. However, this feature reduction did not worsen the model's performance; in fact, it improved the model's quality and reduced the risk of input errors when using the model in risk calculators.

Feature importance plot. HR, heart rate; SpO2, oxygen saturation; BMI, body mass index; RR, respiratory rate; SBP, systolic blood pressure; DBP, diastolic blood pressure; CVD, cardiovascular disease.
Final dataset information is presented in Supplementary Table 1.
Model training and evaluation
Two data sets were created using features confirmed by each feature selection method. Then datasets were randomly split into training (2419) and testing (605) sets while preserving the same proportion of mortality in all datasets due to the small percentage of mortality in datasets.
Development of the predictive model
Metric AUC with CI.
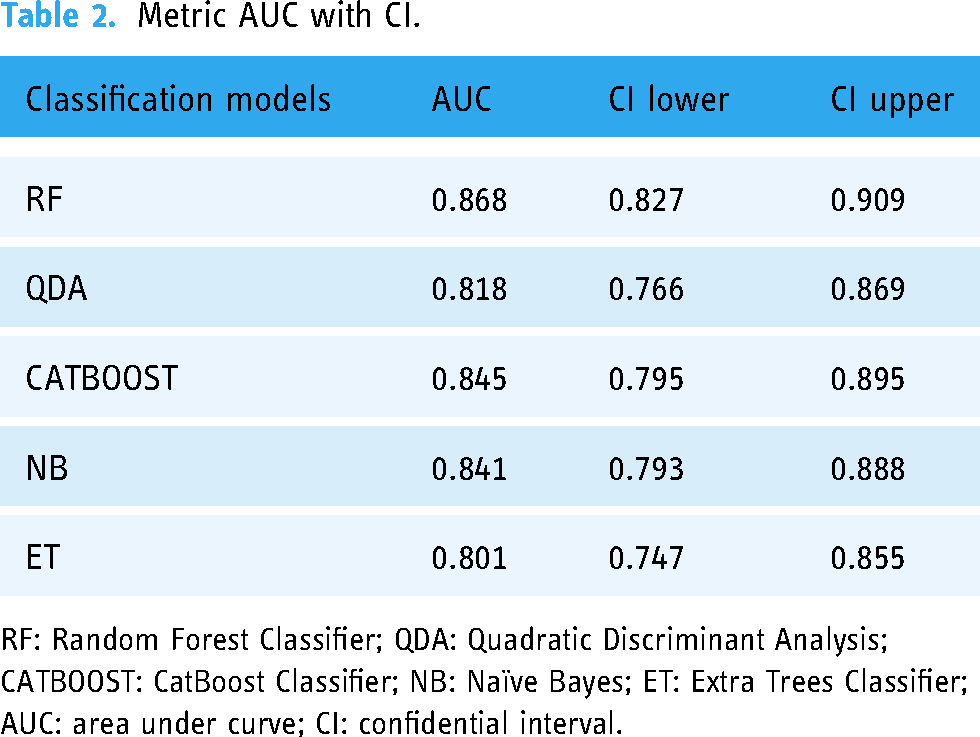
RF: Random Forest Classifier; QDA: Quadratic Discriminant Analysis; CATBOOST: CatBoost Classifier; NB: Naïve Bayes; ET: Extra Trees Classifier; AUC: area under curve; CI: confidential interval.
Using accuracy for evaluating model performance was inappropriate due to the skewness of the data. Precision, F1-Score, sensitivity, specificity, and area under the curve (AUC) of the receiver operating characteristic (ROC) score were calculated to evaluate model performance on testing datasets. Additionally, the ROC curve visualized model performance. After each iteration of model training and validation, we fine-tuned model parameters. Also, we tuned parameters like the number of estimators, the maximum depth for the RF model. These fine-parameter changes were used to maximize the accuracy and generalizability of our AI models. Finally, we tested our models performances on an external dataset from another hospital to evaluate the generalizability of our models. The final metrics are shown in Table 1.
Selection of the best-performing model
We used the Delong test which provides the ability to statistically compare the area under the ROC (AUROC) for two or more classifiers. As a result, we choose an RF model with statistically significant results.
Optimal probability threshold point
Two systems with binary (high risk, low risk) and ternary (very high risk, high risk, low risk) classifications were suggested. The optimal cutoff scores were selected based on the optimal point of ROC after reviewing the probability graph (Figure 3).

Threshold plot for custom probability.
A confusion matrix was used to visualize the performance of cutoff scores in a randomly selected sample from the testing dataset (Supplementary Figure 1).
Primary data analysis
Data collection and preparation
Following data collection and preparation, we included the features (variables) outlined above. Missing values in variables were retrieved from patient electronic health records (EHRs) by a research assistant or replaced with imputed values. The binary outcome of SARS-CoV-2 infection served as the classification label. To simulate a prospective validation of the derived model, we divided the dataset into training and testing cohorts at a ratio of 80:20, respectively. Data were entered and processed using Microsoft SQL and then exported to a CSV format file for analysis with the pandas Python package.
Descriptive statistics
Results were reported as mean with standard deviation for continuous variables, percentages for categorical variables, and median with interquartile range for time variables.
Feature selection
For feature selection, we employed BorutaShap, a wrapper feature selection method that combines the Boruta algorithm with Shapley values. This approach has demonstrated superior performance compared to the original Permutation Importance method, both in terms of speed and the quality of the generated feature subset. BorutaShap not only provides a more refined subset of features but also yields accurate and consistent global feature rankings, which are valuable for model inference. We utilized univariate analyses (Student's t-test, chi-squared test, Fisher's exact test, or Mann–Whitney U test, depending on the distribution) as a feature selection strategy. Variables with a p-value less than 0.05 in the training cohort were selected as input features for constructing the ML models.
Machine learning model development and evaluation
Supervised machine learning (ML) algorithms, including random forest, gradient boosting, and extra trees classifier, were employed to construct prediction models. These models were trained on the training cohort, and their performance was evaluated in terms of area under the receiver operating characteristic curve (AUC) on the testing cohort. Additionally, we reported classification performance on the testing cohort using accuracy, F1-score, precision (positive predictive value [PPV]), recall (sensitivity), specificity, negative predictive value (NPV), and area under the precision-recall curve (average precision [AP]) for each model.
Software and packages
All ML analyses were performed using Python 3.11 programming language (Python Software Foundation, Wilmington, DE) with the scikit-learn 1.4.2 package installed. 5
Results
After training the model on a set of 15 features and tuning up hyperparameters, we obtained the model metrics with the following characteristics: Accuracy—0.9215, AUC—0.9274, Recall—0.7225, Precision—0.4286, F1-score—0.4865, Kappa—0.4448, MCC—0.4496, Specificity—0.916.
The model obtained as a result of machine learning is often a black or gray box, which makes it difficult to understand and interpret them. To understand what are the main features that affect the output of the model, we need explicable machine learning methods that reveal some of these aspects. One of these methods is the SHAP method, which is used to explain how the features affect the model and allows local and global analysis of the dataset and the problem under consideration. SHAP shows the contribution or the importance of each feature on the prediction of the model but does not evaluate the quality of the prediction itself. The absolute SHAP value shows how much a single feature affected the prediction, so Total protein contributed the most, HR and Creatinine the second one, and Lung involvement % was the feature with the lowest contribution to the prediction. These SHAP values are valid for selected patients.
To simplify the clinical interpretation of the outcome risk, a categorical model was proposed: a value from 0 to 0.2 corresponds to a low risk, from 0.2 to 0.5 characterizes an average risk, and from 0.5 to 1.0 ‒ high.
Discussion
Assessing the severity of COVID-19 and predicting outcomes in patients remains an unresolved issue, which can sometimes lead to incorrect clinical decisions. This highlights the need to develop auxiliary tools for predicting the course of the disease.9,10
In this research, a machine learning model was developed during the COVID-19 pandemic using a large dataset of clinical, laboratory, and instrumental data from 3024 patients hospitalized at the Almazov Medical Centre. The key feature of this model is its comprehensive assessment of factors that influence the disease's outcome. It is important to note that a large number of features may not always be helpful in forecasting using a machine learning model, as it can lead to overfitting and decrease the model's quality on unseen data. 11 To address this, Boruta-SHAP was used to select the most important features. This method combines the Boruta feature selection algorithm with Shaply values, reducing the number of features from 24 to 15. This feature reduction did not worsen the model's performance; in fact, it improved the model's quality and reduced the risk of input errors when using the model in risk calculators.
The impact of model performance in predicting outcomes is shown in Supplementary Figure 2 for the high-risk patient and Supplementary Figure 3 for the low-risk fatal patient.
Various tools have been developed since the start of the pandemic. For example, the Fight COVID MKE COVID Risk Assessment Calculator provides an assessment of estimated decrease in life expectancy and individual risk of death considering factors such as social isolation, anxiety from conflicting media information, and limited access to medical care. 12 Another model was proposed to optimize the work of primary care physicians in predicting the risk of hospitalization for COVID-19 patients. This calculator identified key risk factors such as sex, age, race and ethnicity, comorbidities, smoking status, and COVID-19 symptoms. 13 However, these algorithms do not allow for the prognosis of disease progression and risk of death in patients with moderate to severe cases of COVID-19, limiting their use at the hospital level. To address this constraint and reduce the burden on the healthcare system, well-known scales like NEWS (National Early Warning Score)14,15 and NEWS2 (National Early Warning Score 2) have been suggested to optimize patient triage. It is important to note that these scales were not originally developed to assess the course of COVID-19, and they do not take into account biomarkers of cytokine storm. Another tool available for predicting mortality in COVID-19 patients is the Quick COVID-19 Severity Index Score (q-COVID), which was developed in the UK. 14 This algorithm considers comorbidities, the degree of their compensation, history of immunosuppressive therapy, and social factors to calculate the risk of death. It can make forecasts within the first 24 h of the disease and is comparable in effectiveness to the NEWS2 scale. However, it should be noted that the q-COVID scale requires a detailed collection of anamnesis data, limiting its use in certain population groups and in settings with a heavy load on infectious hospitals. Additionally, its sensitivity and specificity may vary when applied to patient populations other than the British one. When comparing the q-COVID scale with the calculator proposed in this study, it is important to highlight that the algorithm presented in this paper can be adapted for effective use and prediction even in situations where anamnestic and clinical laboratory data are lacking.
A systematic review and meta-analysis by Ruiyao Chen et al. investigated the potential of machine learning (ML) in accurately predicting prognostic outcomes for patients with COVID-19. The study revealed promising results, with ML demonstrating significant efficacy in predicting mortality. Specifically, the pooled sensitivity of ML models for predicting mortality was 0.86 (95% CI, 0.79–0.90), while the specificity was 0.87 (95% CI, 0.80–0.92), resulting in an area under the curve (AUC) of 0.93 (95% CI, 0.90–0.95). These findings highlight the potential of ML as a valuable tool for prognostication in COVID-19 patients. Notably, the performance of our proposed model aligns favorably with established international counterparts, suggesting its comparable efficacy in predicting patient outcomes. 16
According to L. Wynants et al., most published prediction model studies were poorly reported and at high risk of bias, potentially leading to unreliable predictive performances when applied in daily practice. The authors highlighted the importance of rigorous development, validation, and reporting of prediction models for COVID-19 to ensure their reliability and utility in clinical decision-making. 17
Machine learning models, particularly deep neural networks and ensemble methods, are often characterized as "black boxes". 18 Their complex internal workings involve numerous parameters and intricate decision boundaries, making them difficult to understand and interpret. While these models can achieve high predictive accuracy, the lack of interpretability presents a significant challenge for researchers and practitioners, hindering our ability to understand the reasoning behind predictions and the importance of individual features.19,20 The issue of interpretability arises from the fact that these models learn abstract representations of input data, often lacking a direct semantic interpretation. This means that the features learned by the model may not be easily understood or mapped to human-understandable concepts. While methods exist to address this issue, they are not always effective in providing clear explanations. 21
To bridge the gap between model performance and human understanding, explicable machine learning methods are crucial. These methods aim to elucidate the model's decision-making process, providing insights into the relationship between input features and predicted outcomes. One such method is the SHAP (SHapley Additive exPlanations) method. SHAP offers a framework for explaining individual predictions by attributing the prediction to individual features. 22 The SHAP value represents the contribution of a feature to the overall prediction, allowing for both local and global analysis of the dataset. SHAP waterfall plots provide a visual representation of the contribution of each feature to a specific prediction. 23 For example, in a medical context, a SHAP waterfall plot for a patient with a death outcome (outcome = 1) might reveal that Total protein, Creatinine, RR, and Age contributed most to the prediction of death. Similarly, a SHAP waterfall plot for a patient with a discharge outcome (outcome = 0) might show Total protein, HR, RR, and Urea as the most influential features. The interpretability provided by SHAP can be used to develop clinically relevant risk models. By categorizing the model's output into low, average, and high risk based on the SHAP values, clinicians can gain a more intuitive understanding of the model's predictions and apply them to patient management. 24
This study utilizes a novel approach to feature selection and model comparison for predicting mortality in hospitalized COVID-19 patients. The methodology combines the BorutaShap algorithm with the DeLong test, providing a robust and statistically sound framework for identifying relevant features and evaluating model performance. BorutaShap is a wrapper feature selection method that leverages the strengths of both the Boruta algorithm and Shapley values. 25 This combination has demonstrated superior performance compared to the traditional Permutation Importance method, achieving faster execution times and generating higher quality feature subsets. Beyond feature selection, BorutaShap offers a significant advantage by providing accurate and consistent global feature rankings, enabling insightful model inference. The DeLong test is a nonparametric statistical method specifically designed to compare the Area Under the Curve (AUC) values of two or more predictive models. 26 This test is employed to determine if there is a statistically significant difference in the predictive power of the models. The DeLong test calculates the covariance matrix between the AUC estimates of the models, considering the correlation between them. This approach allows for a robust assessment of the statistical significance of the differences in AUC values, eliminating the need for assumptions about the underlying data distribution
The integration of the BorutaShap algorithm and the DeLong test distinguishes this research from prior studies focusing on predictive modeling for COVID-19 patient mortality. This methodology offers a comprehensive and statistically rigorous framework for identifying the most relevant features and evaluating the performance of different predictive models.
To sum up, the COVID-19 pandemic has presented unprecedented challenges for healthcare systems worldwide, particularly in managing critically ill patients. 27 Accurate prediction of lethal outcomes in these individuals is crucial for timely interventions and optimized care. While traditional clinical scores have played a role in risk assessment, recent advancements in machine learning offer a promising avenue for improving prognostication. 28 For instance, G. Lichtner et al. explore the potential of leveraging machine learning models trained on non-COVID-19 viral pneumonia patients to predict ICU mortality in critically ill COVID-19 patients. 29 Remarkably, these models have demonstrated a superior accuracy in forecasting lethal outcomes compared to traditional clinical scores, paving the way for a more precise and personalized approach to patient care.
However, it is important to acknowledge the limitations of the calculator described in this publication. These limitations include the absence of outpatients with mild severity in the sample and a small number of young patients, which restricts its use in outpatient care. To improve the calculator, further studies with an expanded patient database are necessary.
Conclusions
Predictive models are an essential part of the medical decision support system, but unfortunately not all medical institutions can independently create them based on their data and needs. This is mainly due to the fact that each medical institution may have its own set of tests conducted in the first 72 h. Mathematical forecasting models based on machine learning require a strict number of input parameters and their consistency, which makes it difficult to use them in different medical institutions, and skipping parameters leads to a decrease in the accuracy of the methods. There was a problem of choosing a model that is able to independently choose the optimal parameters from their availability necessary for a qualitative forecast.
Supplemental Material
sj-docx-1-dhj-10.1177_20552076241287919 - Supplemental material for Artificial intelligence for predicting mortality in hospitalized COVID-19 patients
Supplemental material, sj-docx-1-dhj-10.1177_20552076241287919 for Artificial intelligence for predicting mortality in hospitalized COVID-19 patients by Igor N. Korsakov, Tatiana L. Karonova, Arina A. Mikhaylova, Alexander A. Loboda, Alyona T. Chernikova, Anna G. Mikheeva, Marina V. Sharypova, Alexandra O. Konradi and Evgeny V. Shlyakhto in DIGITAL HEALTH
Footnotes
Acknowledgments
We acknowledge the healthcare professionals from the Almazov National Medical Research Centre for their assistance with collecting the data.
Contributorship
Igor N. Korsakov: conceptualization, project administration, data collection, data analysis and interpretation, writing; Tatiana L. Karonova: conceptualization, project administration, writing and editing; Arina A. Mikhaylova: Alexander A. Loboda: data interpretation, writing and editing; Alyona T. Chernikova: data review and editing; Anna G. Mikheeva: writing and editing; Marina V. Sharypova: writing and editing; Alexandra O. Konradi: conceptualization and project administration; Evgeny V. Shlyakhto: conceptualization and project administration; All authors have read and agreed to the published version of the manuscript.
Declaration of conflicting interests
The authors declared no potential conflicts of interest with respect to the research, authorship, and/or publication of this article.
Ethical approval
Not applicable, because this article does not contain any studies with human or animal subjects.
Funding
The author(s) disclosed receipt of the following financial support for the research, authorship, and/or publication of this article: This work was financially supported by the Ministry of Science and Higher Education of the Russian Federation (Agreement No. 075-15-2022-301).
Informed consent
Not applicable, because this article does not contain any studies with human or animal subjects.
Supplemental material
Supplemental material for this article is available online.
References
Supplementary Material
Please find the following supplemental material available below.
For Open Access articles published under a Creative Commons License, all supplemental material carries the same license as the article it is associated with.
For non-Open Access articles published, all supplemental material carries a non-exclusive license, and permission requests for re-use of supplemental material or any part of supplemental material shall be sent directly to the copyright owner as specified in the copyright notice associated with the article.