
Abstract
Background
As a common cancer-related death worldwide, pancreatic adenocarcinoma (PAAD) has significantly increased mortality in recent years. In recent years, tumor mutation burden (TMB) has been regarded as the most popular biomarker for PAAD immunotherapy. However, it remains unclear which gene mutations affect TMB and immune response in pancreatic adenocarcinoma.
Methods
The somatic mutation images of PAAD samples were downloaded from The Cancer Genome Atlas (TCGA) and the International Cancer Genome Consortium (ICGC). Based on the expression data of the TCGA and IGCC cohorts, various bioinformatics algorithms are used for evaluating the prognostic value and functional annotation of some frequently somatically mutated genes. Furthermore, the correlation between gene mutation and tumor immunity was also evaluated.
Results
The results showed that lysine methyltransferase 2C (KMT2C) and paternally expressed 3 (PEG3) are frequently mutated genes in PAAD. Patients with KMT2C and PEG3 mutations have higher TMB severity and a lousy prognosis. In addition, the mutations of KMT2C and PEG3 genes positively regulate the metabolic and protein-related pathways in PAAD. Meanwhile, significant differences in the composition of the immune cells were observed for KMT2C and PEG3 mutations PAAD patients, for providing additional guidelines for antitumor treatments in various KMT2C and PEG3 mutation states in PAAD.
Conclusion
This study reveals that KMT2C and PEG3 mutation may serve as biomarkers for predicting prognosis and guiding anti-PAAD immunotherapy for PAAD patients.
Introduction
Pancreatic cancer is one of the most aggressive malignancies, and one of the most challenging cancers to treat. 1 Pancreatic adenocarcinoma (PAAD) is the most prevalent type accounting for over 90% of all pancreatic malignancies diagnosed. 2 In recent years, immunotherapy has made excellent progress and shown promising results in the last few years. 3 Immune checkpoint inhibitors (ICIs) target proteins such as programmed death ligand 1 (PD-L1) and cytotoxic T lymphocyte-associated protein 4 (CTLA-4), which help the immune system identify and attack essential targets of cancer cells. 4 As a new biomarker, tumor mutation burden (TMB) has shown its potential as a predictive biomarker for a variety of applications, including the correlation between different levels of TMB and the response of various cancer patients to immunocheckpoint inhibitors (ICI). 5 Cancers with high TMB have been proven to respond better to ICIs, with PAAD being one such case. 6 According to recent clinical studies, PD-L1 alone may not accurately predict the response to immunotherapy, because only a few patients can benefit from immunotherapy. 7 Given the high costs and side effects of immunotherapy, there is a need to research and apply new and effective immunotherapy biomarkers. Somatic mutations are also predictive factors for immunotherapy, and in addition to TMB, somatic mutations are considered predictive biomarkers for high-grade solid tumors. 8 It has been reported that The Cancer Genome Atlas (TCGA) and International Cancer Genome Consortium (ICGC) have provided a detailed description of the genetic landscape associated with PAAD. Our study uses TCGA and ICGC data to describe the somatic mutation characteristics of PAAD patients. Following that, we performed a bioinformatic analysis of somatic mutations combined with TMB and clinical prognosis, identifying lysine methyltransferase 2C (KMT2C) and PEG3 mutations as critical events in PAAD progression. Furthermore, function-related pathway enrichment and immune infiltration analysis were carried out to explore the relationship between KMT2C and PEG3 mutations and immune function.
The present results indicated that some new potential biomarkers we identified could predict TMB, prognosis, and the efficacy of immunotherapy in PAAD.
Methods and materials
Obtaining data
TCGA (http://portal.gdc.cancer.gov/projects) provides transcriptome, somatic mutation, and clinical information on PAAD patients in the United States. Data on Chinese patients’ somatic mutations are obtained from ICGC (http://dec.iege.org/releases/current/project). Extraction and sorting are performed in Perl for analysis in R. The data included only patients who had complete clinical records. We excluded patients without gender, age, TNM staging, and survival information.
Definition of pancreatic cancer TMB
Total mutation bases per megabase are calculated as TMB, and only mutations causing amino acid changes are considered. For each PAAD sample of TCGA and ICGC, we used the TMB formula to calculate TMB expression. 9
Bioinformatic analysis
From the TCGA and ICGC databases, we extracted the top 30 genes with mutation frequency using R software (v4.0.2) and using GenVisRM to visualize mutations in these genes 10 and the R package to locate and identify genes with higher mutation frequencies in the two databases with the crossed analysis method. TMB and cross-mutation genes are evaluated and visualized in this R package. Expression and mutation matrix data for KMT2C and PEG3 are evaluated with GSEA software (v4.1.0) for GSEA analysis. 11 KEGG.v7.2 Select Gmf as the generator set database. Set the replacement value to 1000, and calculate the Normalized Enrichment Score (NES), the false discovery rate (FDR) value is used to determine a meaningful enrichment path. The CIBERSORT method uses transcriptome data to assess the proportion of 22 immune cells in tumor tissue. 12 The CIBERSORT deconvolution algorithm is used to obtain each tumor sample's immune cell ratio matrix data, and the filter condition top is set. The matrix data visualization uses the R package. Each TCGA sample was divided into a wild and a mutant group based on its KMT2C and PEG3 status. The R-Packages Limma and Vioplot are used to analyze the differences in the infiltration of immune cells into the two groups.
Statistical analysis
R (v4.0.2) is used for statistical analysis. Kaplan–Meier survival analysis and a log-rank test were used to calculate the survival curve, while univariate and multivariate Cox regression analyses were conducted to determine the prognostic risk factors. We analyzed the correlation between mutant genes and TMB by using the Mann–Whitney U test For all comparisons, the difference is considered to be significant at p < 0.05.
Results
Somatic mutation features in PAAD
We initially downloaded mutation data from TCGA and ICGC for 373 and 122 PAAD specimens, respectively. In descending order, the cumulative mutation frequencies of each gene were calculated. Figure 1 a and b shows that the top 30 mutated genes have the highest mutation frequencies and somatic mutation patterns. The top five mutations in the ICGC database are KRAS (67%), TP53 (65%), SMAD4 (25%), CKDKN2A (25%), and TTN (17%) (Figure 1a). Moreover, we identified 30 genes that mutated most frequently in PAAD patients from the TCGA database. As shown in Figure 1b, KRAS (90%), TP53 (60%), SMAD4 (20%), CDKN2A (15%), and TTN (10%) are the genes of the top five ranked mutation incidence in patients in TCGA database (Figure 1b). Interestingly, some frequently mutated genes of American and Chinese patients are the same, including KRAS, TP53, SMAD4, CDKN2A, TTN, RNF43, RYR1, GLI3, ARID1A, LRP1B, CSMD1, DNAH11, SYNE1, MUC16, KMT2C, and PEG3 (Figure 1c). The following analysis will then focus on these common mutation genes.

Oncoplot of frequently mutated genes in PAAD. (a) Oncoplot summarizes the mutations found in the ICGC PAAD cohort. The left axis shows the frequency of mutations, and genes are grouped according to their mutation frequency. The fields below show the different types of mutations. (b) An illustration shows the fence of common mutations associated with PAAD in the TCGA cohort. The left column of the diagram shows mutation frequency. The image on the right showed different mutation frequencies for the different genes. (c) The Venn diagrams of common mutant genes between ICGC and TCGA cohorts.
Gene mutations associated with TMB analysis
In order to explore whether the common mutations of these 15 genes are related to TMB, according to mutation status for 15 genes, pancreatic cancer patients in the TCGA and ICGC cohorts were divided into wild groups and mutation groups. The TMB values of KRAS, TP53, TTN, MUC16, GLI3, KMT2C, and PEG3 mutants in PAAD patients were significantly different from those of wild type (p < 0.05) (Figure 2a). Patients with mutations in the above genes have higher TMB.
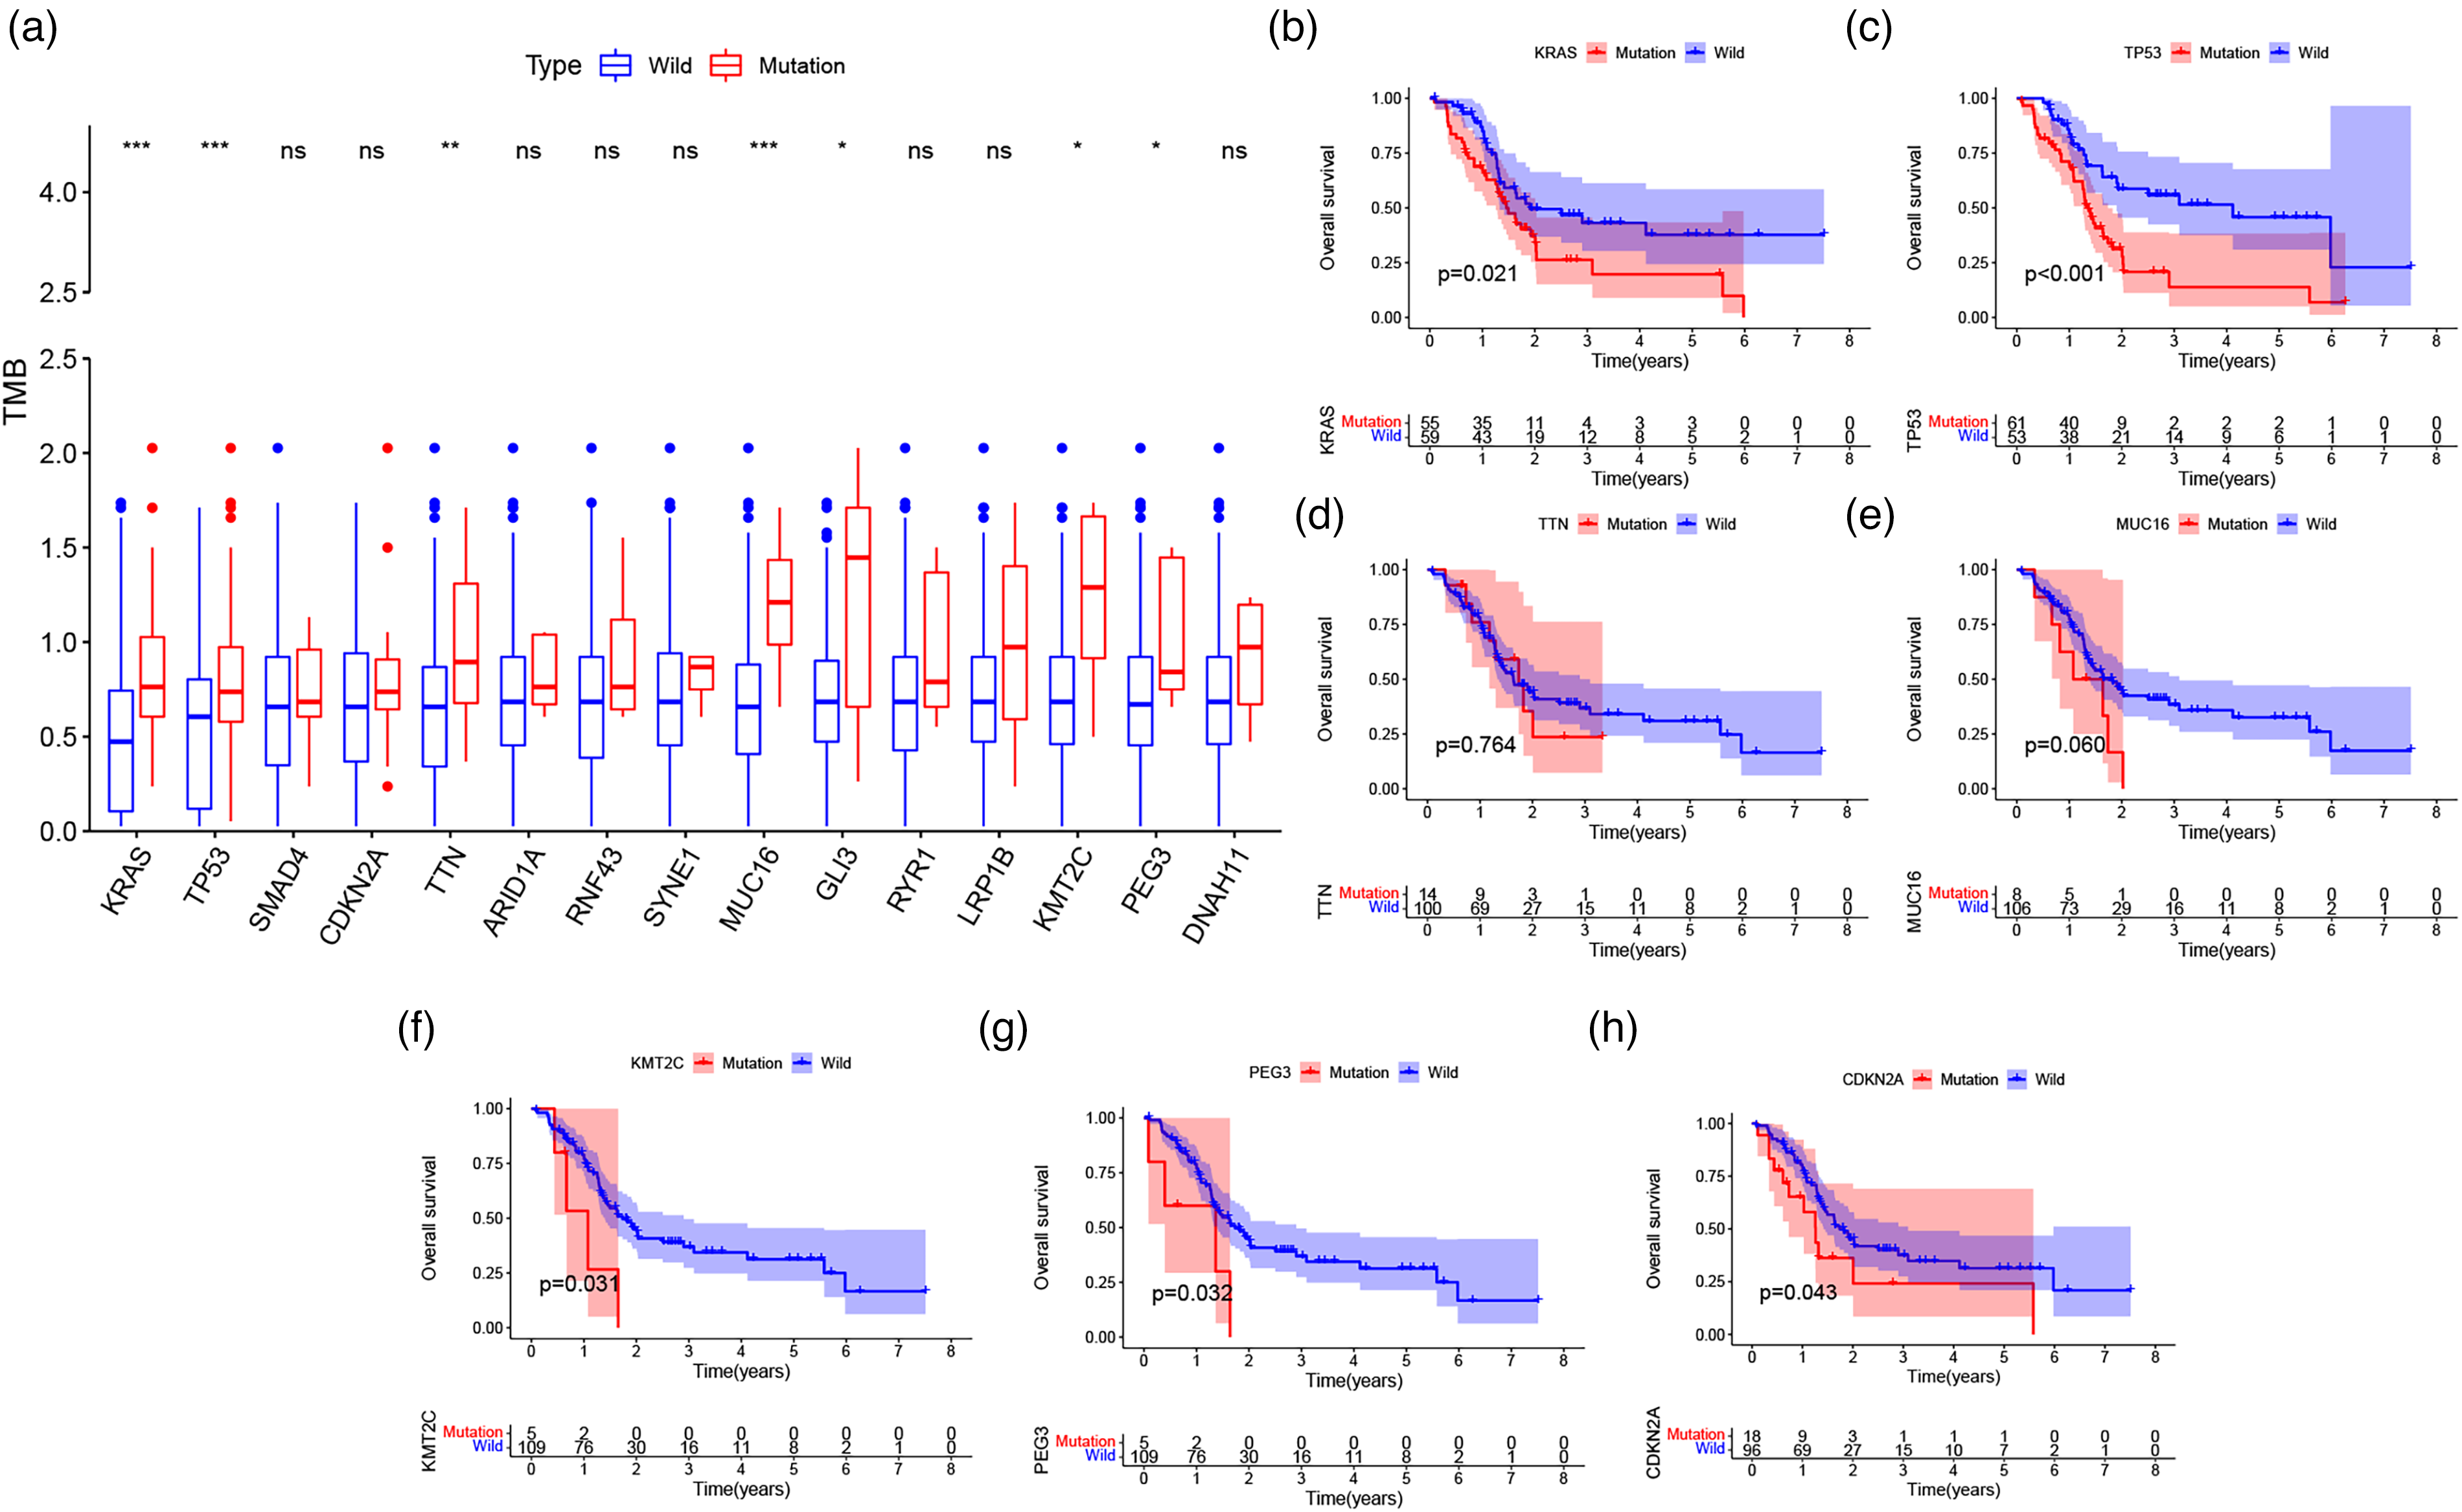
TMB is associated with gene mutations and clinical prognosis of PAAD patients. (a) The box plot shows that most gene mutations result in higher TMB. (b) PAAD patients with gene mutation or wild are analyzed through a Kaplan–Meier survival analysis.
KMT2C and PEG3 mutation were associated with survival prognosis
TMB is related to relapse-free survival (RFS) of PAAD. 13 Given that the associations found between the seven mutated genes and TMB include KRAS, TP53, TTN, MUC16, GLI3, KMT2C, and PEG3, we therefore speculate that these genes are related to the clinical outcomes. The patients of TCGA and ICGC databases were divided into wild-type and mutant groups based on their gene mutation status. The Kaplan–Meier analysis for each group is based on the survival data of patients. Our results indicate that KRAS, TP53, KMT2C, and PEG3 mutations are closely associated with a poor prognosis (p = 0.021, p < 0.001, p = 0.031, p = 0.032) (Figure 2 b and g). Although TMB between wild-type and mutant CDKN2A was not statistically significant, Kaplan–Meier analysis showed a poor future prognosis for mutant CDKN2A (p = 0.043) (Figure 2h). Many studies have found that the mutations of KRAS and TP53 in PAAD patients have a poor prognosis in clinical practice .14, 15 KMT2C and PEG3 are used for further analysis due to less research in PAAD. Based on these tools, we intend to use Cox regression analysis to determine that KMT2C and PEG3 mutation are independent prognostic factors for PAAD. The OS of patients with KMT2C and PEG3 mutations was significantly shortened (p = 0.049; p = 0.052). Univariate Cox analysis showed that the HRs of KMT2C and PEG3 were 2.803 (95% CI 1.004–7.828; p = 0.049) and 2.760 (95% CI 0.992–7.680; p = 0.052), respectively. The multivariate Cox analysis also showed similar results for Overall Survival (OS) of patients with KMT2C and PEG3 mutations and the hazard ratios (HRs) of them were 3.067 (95% confidence interval (CI) 1.092–8.613; p = 0.033) and 3.546 (95% CI 1.127–11.161; p = 0.030), respectively, which indicated that KMT2C and PEG3 were the independent prognostic factors in PAAD (Figure 3a and b).

Forest plots for the results of the univariate and multivariate Cox regression analysis between overall survival and KMT2C (a) or PEG3 (b) mutation expression in PAAD patients.
Enhancement pathways identified in KMT2C and PEG3 mutation patients
Our next step was examining enrichment pathways in the KMT2C and PEG3 mutations groups. In the GSEA experiment, the KMT2C and PEG3 mutation groups had significantly enriched signaling pathways. The pathways in the KMT2C group included aminoacyl-tRNA biosynthesis, a folate carbon pool, degradation of other glycans, and selenium-amino acid metabolism (Figure 4a). Another signaling pathway that was enriched in PEG3 was protein export and proteasome (Figure 4b). All of the enhancement pathways identified in KMT2C were related to amino acid metabolism and glycometabolism. In the past few years, it has become increasingly clear that the response of immune cells to tumors mainly depends on their specific metabolic procedures, which is related to the type and function of immune cells, metabolic reprogramming is one of the major characteristics of tumors, and abnormal amino acid metabolism and glycometabolism are the most prominent feature of tumor metabolism. 16 Protein export and proteasome signaling pathways are also required for essential immune functions of immune cells as a molecular target for immune responses. 17
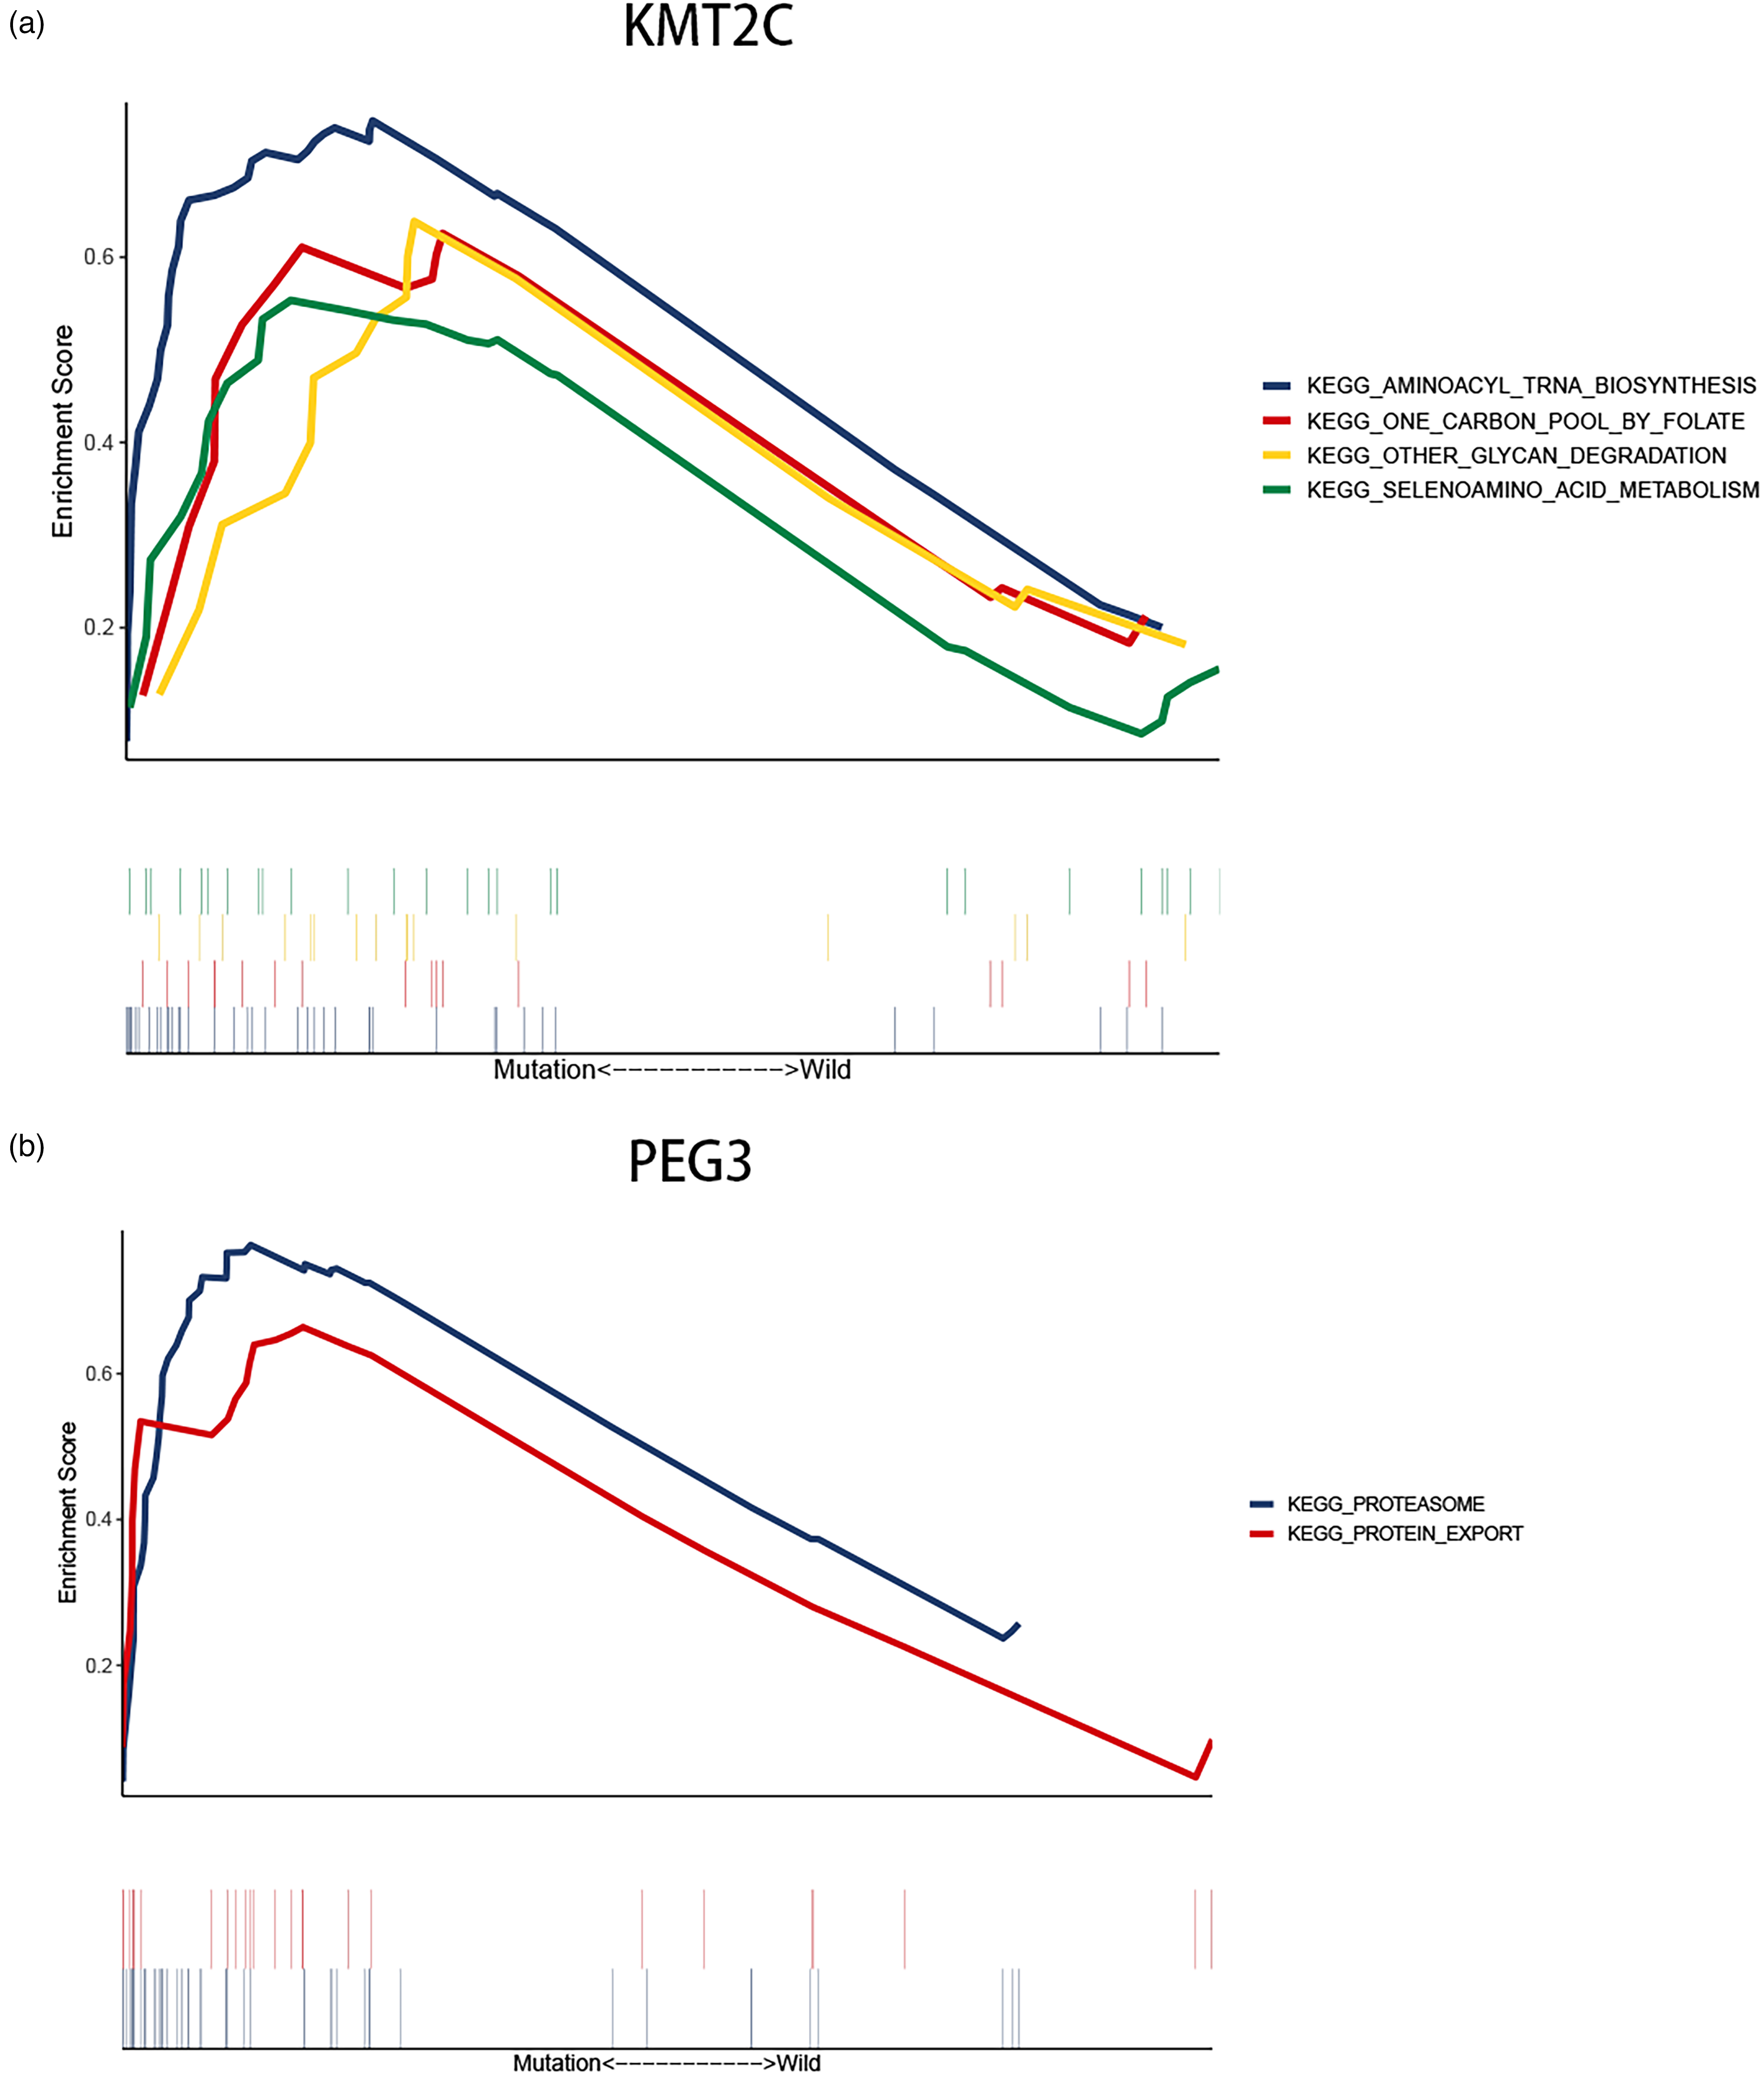
Gene sets enrichment of mutation genes. (a) Gene sets enriched pathways of GSEA in KMT2C mutated group. (b) Gene sets enriched pathways of GSEA in PEG3 mutated group.
Immune cells infiltrating PAAD tumors associated with KMT2C and PEG3 mutations
To determine the proportion of immune cells in each tumor tissue sample, we first used the CIBERSORT deconvolution algorithm. According to the results, infiltrating immune cells varied greatly between samples, and T cells and macrophages were found in higher proportions in the total samples (Figure 5). Then, divide the samples into groups based on wild-type or mutant-type, and examine the amount of immune cell infiltration in the two groups. Last but not least, in correlation analysis, activated memory CD4 T cells were positively correlated with CD8 T cells but negatively correlated with activated M0 macrophages and NK cells. In addition, the strongest parallel relationship exists between naive B cells and plasma cells, and a negative correlation exists between naive B cells and macrophages M2 (Figure 6). Next, in the violin plot, these samples of KRAS, P53, KMT2C, and PEG3 were divided into wild and mutant groups, and immune cell infiltration was assessed in each group. The infiltration in ratio of macrophage M0 was higher in the KRAS and P53 mutant group than in the wild group (p = 0.005, p = 0.027). KRAS mutants (Figure 7a) showed lower infiltration rates of naive B cells, CD8 T cells, and resting NK cells. (p = 0.031, p = 0.006, p = 0.025). Nevertheless, plasma cell infiltration rates were lower among P53 mutants than in wild individuals (p = 0.007) (Figure 7b). The KMT2C mutant group did not have significant immune cell infiltrates compared with the wild group (Figure 7c). However, compared with the mutant group, the PEG3 wild group had higher infiltration ratios of T cells CD4 naive and T cells CD4 memory resting (p = 0.001, p = 0.024) (Figure 7d).

Overall view of relative infiltrations for 22 types of immune signatures in PAAD tissues.

The correlation graph of immune cells.
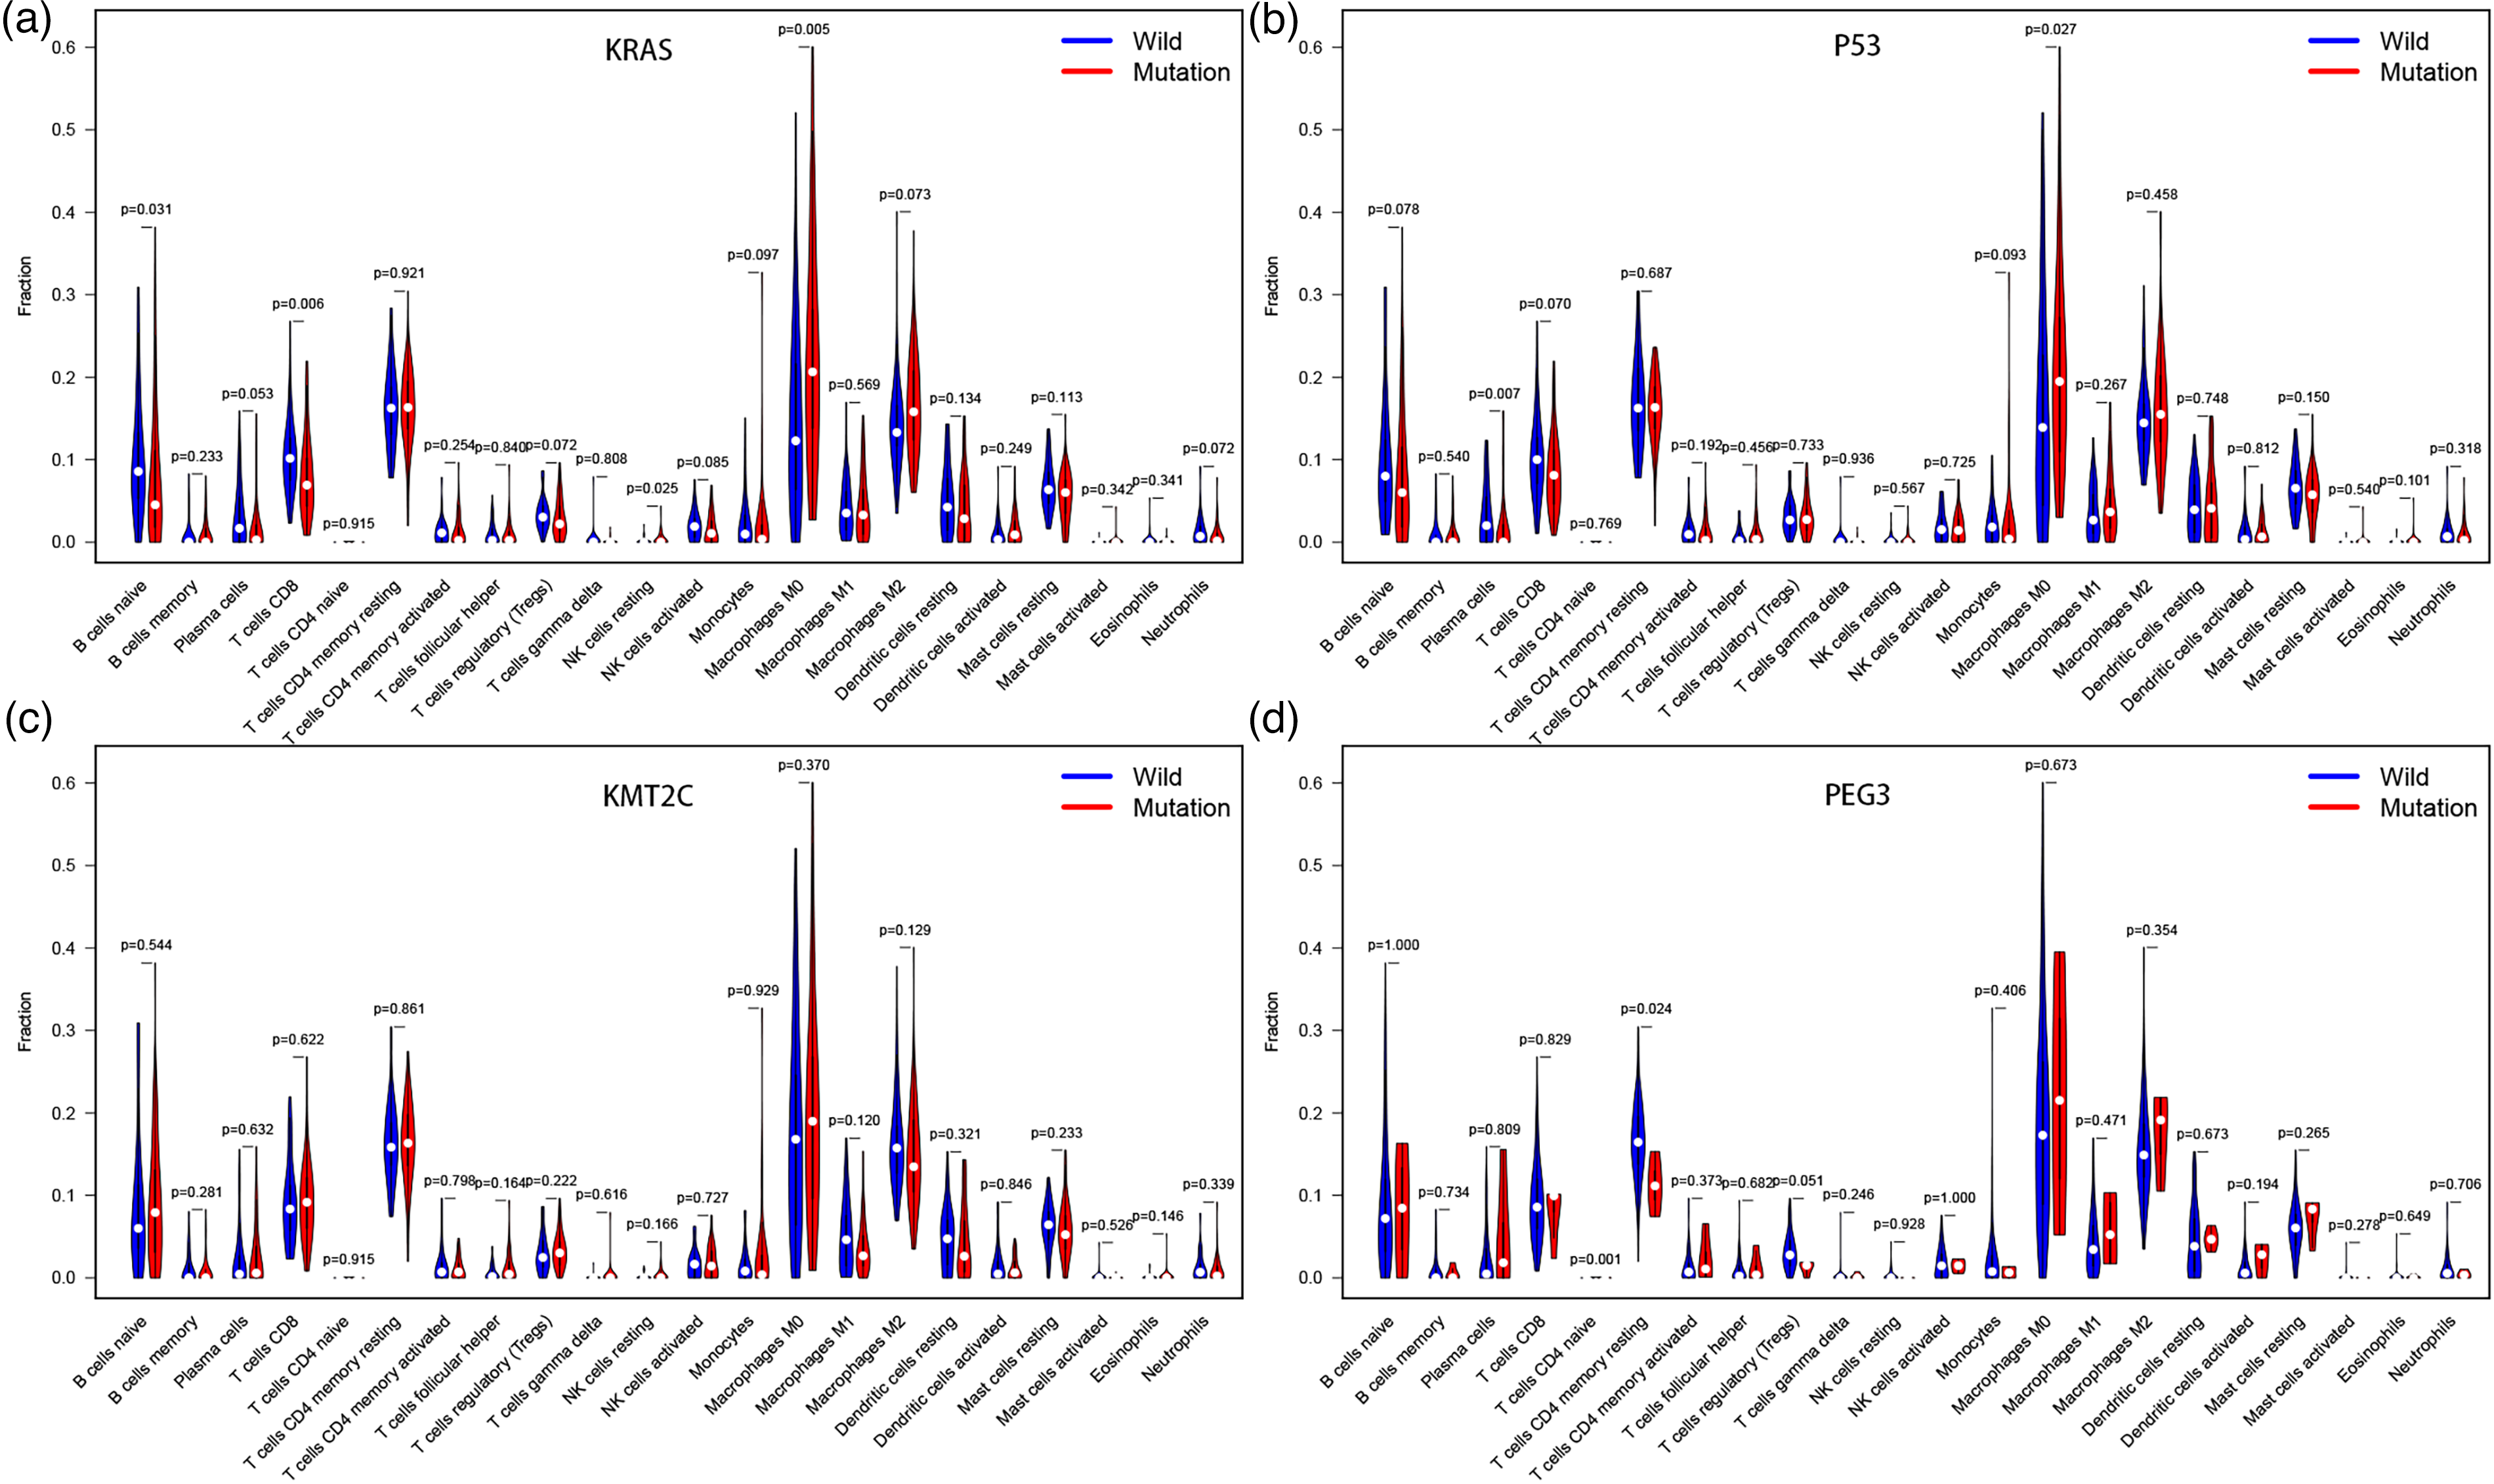
This violin plot illustrates the mutation-type and wild-type of (a) KRAS, (b) P53 (c) KMT2C, and (d) PEG3 differentially infiltrate immune cells. Blue stands for the wild-type group and red stands for the mutant group. The p-value is annotated in the plot.
Discussion
Our research characterized the somatic mutation landscape of PAAD samples in the ICGC and TCGA databases. It was determined that KMT2C and PEG3 mutation were related to TMB and patient clinical outcomes. In addition, signaling pathways associated with the metabolism and protein are significantly abundant in these mutant samples. Moreover, PEG3 mutant samples showed lower levels of T cells CD4 naive and T cells CD4 memory resting infiltration, which is consistent with the previously established evidence that the immune pathways and cells are associated with the antitumor immune response. 18
KMT2C gene is a member of the myeloid/lymphoid or mixed-lineage leukemia (MLL) family, located on 7q36.1, with 65 exons, encodes a nucleoprotein that is methylated to histone 3 lysine4 (H3K4), which believed to be involved in tissue growth regulation, tumorigenesis, and transcriptional coactivation. 19 In diffuse-type gastric adenocarcinomas, KMT2C mutations promote epithelial-to-mesenchymal transitions due to down expression of the KMT2C gene . 20 PEG3, an imprinted gene located on 19q13.4, encodes a high molecular weight C2H2 type zinc finger protein, which may be a transcription factor. 21 This gene is expressed in the brain, placenta, ovary, testis, pancreas and other tissues, whose protein is located in the nucleus of neurons and glial cells. Previous studies have suggested that PEG3 may be a promoter of apoptosis through P53-mediated pathways and may be involved in regulating tumor necrosis factor (TNF) and Wnt-mediated signaling pathways, which play a pivotal role in tumor suppression.22, 23 The methylation or heterozygosity of PEG3 often promotes the progression of epithelial tumors like cervical and ovarian cancer.24, 25 Some research indicated that downregulation of PEG3 protein expression could promote glioma stem cell proliferation and reduce apoptosis. 26 The zinc finger protein PEG3 belongs to the c2h2 family. It is known to be involved in p53-mediated apoptosis as well as the proliferation of cells. PEG3 has multiple transcript variants encoding different isoforms due to alternative splicing, one of which has shown tumor suppressor activity in glioma cells and another which shows tumorigenesis in ovarian cells.27, 28 It was inferred that PEG3 mutation might decrease the inhibition of the Wnt signaling pathway and induction of apoptosis with p53, contributing to the dysfunction of tumor suppressor and proliferation and metastasis of tumor cells.
PAAD is a very heterogeneous tumor involving KRAS, TP53, SMAD4, CDKN2A, TTN and KMT2C, and other known genetic mutations . 29 We found that mutations in KMT2C and PEG3 are also associated with TMB and clinical outcomes in PAAD. The TMB represents the total number of somatic mutations in a tumor. In addition to causing mutation-derived neoantigens, a high TMB can make tumors more immunogenic by inducing a T-cell-mediated immune response and releasing new antigens.30–33 Therefore, we hypothesize that KMT2C and PEG3 mutations result in a higher TMB level in PAAD, activating the immune system to attack cancer. 34
During the progression of metastatic epithelial cancer, antigen mutations have recently been found in peripheral blood samples from patients with KMT2C mutations. Antitumor immunity is maintained and enhanced by cytotoxic T cells (CTLs) activated by CD4 T cells. Infiltrating Tregs may not be conducive to tumor protection. 35 Furthermore, in our research, the T cell CD4 memory resting infiltration rate in the PEG3 wild-type samples was also higher and correlated positively with CD8 T cells but negatively with Tregs. Therefore, we speculate that PEG3 mutations may up-regulate CD4 and CD8 T cells and down-regulate Treg cells in PAAD. In conclusion, our results suggest that KMT2C and PEG3 mutations stimulate immunological changes in cancer-infiltrating cells that contribute to antitumor immunity of PAAD.
Our study was limited by the lack of relevant drug response data about PAAD in the TCGA and ICGC databases. Thus, we have no way of knowing whether the KMT2C or PEG3 mutation is associated with PAAD patients’ prognosis or if they can cause the same immune response under the influence of treatment. Although KMT2C and PEG3 are frequently mutated in TCGA and ICGC PAAD samples, their effects on different races may be heterogeneous. Consequently, further testing of KMT2C or PEG3 mutations and prognosis in Chinese PAAD specimens, as well as analysis of infiltrating immune cells and signaling pathways is needed.
In summary, mutations in KMT2C and PEG3 are related to TMB, patient survival, metabolic pathway, and immune Infiltration, which might have a significant clinical impact on PAAD.
Footnotes
Contributorship
As the primary author, Yili Huang conceived, designed, performed, analyzed data, and wrote the draft manuscript. Research was designed, performed, analyzed, overseen, and edited by Xiaole Zhu and Jinsong Liu. All authors read and approved the manuscript.
Data availability statement
This article contains all data generated or analyzed during this study.
Declaration of conflicting interests
The author(s) declared no potential conflicts of interest with respect to the research, authorship, and/or publication of this article.
Ethics approval and consent to participate
Ethics and consent are not applicable to this observation and review study.
Funding
The author(s) received no financial support for the research, authorship, and/or publication of this article.
Guarantor
Not applicable.