
Abstract
Objectives
Technology in the form of mobile apps has played an essential role in facilitating, tracking, and maintaining health and fitness activities during the pandemic. When countries opted for partial or complete lockdowns to contain the spread of the coronavirus disease 2019 virus, it led to people working on their health and fitness-related activities from their homes, just as they continued working from home. This paper aims to quantify the impact of coronavirus disease 2019 on the development of health and fitness mobile apps. Specifically, we compute the effect of coronavirus disease 2019 on the growth of different sub-categories of health and fitness apps.
Methods
We scraped data about a population of 78,890 health and fitness apps from the iOS App Store. First, categories of health and fitness apps are identified using text analysis on the descriptions of apps. Second, the rise in the development of new apps is analyzed. To quantify the impact of coronavirus disease 2019 on the growth of the health and fitness apps, multiple time-series forecasting models are created for different categories of health and fitness apps.
Results
The text analysis identified twelve different types of health and fitness apps on the app market. Our models estimated that the number of health and fitness apps on the iOS app market exceeded the expected growth by 29.9% after the pandemic. The results of all categories of health and fitness are discussed in the paper.
Conclusions
Our analysis found significant growth in the development of new health and fitness apps after the pandemic outbreak. The post hoc study of the population of health and fitness apps presented the current state of this particular area of the app market. In addition, it provided potential growth areas in app markets where there are fewer apps.
Introduction
The stay-at-home orders during the coronavirus disease 2019 (COVID-19) pandemic, which is a collective, forced people to perform health and fitness (H-F)-related activities at home, just as they had to work from home. 1 Collective trauma is defined as a significant event that negatively affects the population. 2 The pandemic declined people's physical activity as observed by Janovský et al. 3 and Konda et al. 4 Specifically, the pandemic hampered fitness activities in gyms and encouraged people to explore alternate fitness activities such as workouts at home, yoga, and meditation, as Kaur et al. 5 discussed. Technology has played a pivotal role in maintaining H-F activities during the pandemic through mHealth (mobile health) and mobile apps.6,7 Mobile apps and smart technologies have not just assisted in containing the pandemic8–12 but also in motivating users to keep track of their H-F activities, as observed by Panicker and Chandrasekaran. 13 For instance, Sorkin et al. 14 reported increased use of digital technologies, including mobile apps for stress management during COVID-19 pandemic. Similarly, Srivastav et al. 15 and Garfin 1 discussed the role mobile apps can play in promoting physical activity during pandemic. Vandoni et al. 16 reported that tele-exercise through mobile apps helped combat sedentary behavior in children and adolescents with obesity during the pandemic. Due to the potential use of mobile apps for various purposes during the pandemic, developers have deployed more than expected new apps. 17 Previous research has focused on the role of mobile apps in a particular context during COVID-19 pandemic. However, an overall change in the development of new mobile apps during the pandemic has rarely been studied. To fill this research gap, we quantify the growth in mobile app development during the COVID-19 pandemic.
We focus on a population of H-F apps on the iOS app market. Note here; the previous research has explored the use and development of a specific type of apps related to COVID-19. However, our focus is on the entire genre of H-F apps. H-F genre on iOS App Store refers to the "Apps related to healthy living, including stress management, fitness, and recreational activities." 1 H-F mobile apps allow users to access and keep track of their H-F data continuously,18,19 which helps in changing health behavior,20,21 such as monitoring weight and diet, 22 managing a disease 23 or promoting medication adherence. 24 As discussed earlier, the pandemic has impacted access to H-F facilities and increased the use and development of new mobile apps. The actual impact during the pandemic on the mobile market is yet to be examined. Therefore, the objective of this paper is to investigate the growth of H-F-related apps after the outbreak of the COVID-19 pandemic. This objective allows us to quantify the extent to which the pandemic has increased the demand for H-F mobile apps.
The problem of forecasting the change in the use of mHealth due to a major event, such as a pandemic, is important to study so that developers can provide timely solutions to the users. By quantifying the potential impact of COVID-19 on the H-F apps not just provides insights into the current pandemic but also provides guidance on the impact of future pandemics on app markets. Our analysis suggests adjusting the estimation of an app market growth in future pandemics and other events affecting people's daily H-F routine.
Methods
Within the H-F genre, there are several sub-categories of apps. We focus on understanding the impact of COVID-19 on the growth of each sub-category of apps. To identify the sub-category of each app, we performed text clustering on the description of each app. Furthermore, to examine the impact of COVID-19 on the growth of H-F apps, we create multiple time-series forecasting models for each sub-category. First, we create exponential smoothing (ES) forecasting models to estimate the number of H-F apps developed during COVID-19 using pre-COVID-19 data. Second, the increase in the number of apps is computed using the difference between the estimated and actual number of apps. As a post hoc analysis, we also identify the sub-categories of apps where demand (measured through the number of ratings) is higher, but the number of apps on the app market is few.
Data collection
To perform analysis at the population level, we scraped data about all H-F apps available in the US version of the iOS App Store. Each app is assigned a primary and/or secondary genre in the App Store based on its primary and secondary objectives. The definition of each genre is provided in Appendix A. The steps performed to collect and analyze the data are presented in Figure 1. First, a web crawler was written using python programing language to extract each app's unique identification number (ids). At the time of data collection (February 7, 2021), there were 79,730 unique app ids where either the primary or the secondary genre was H-F. In the second step, an API written in node.js 2 was adapted to collect descriptive information about each app, including title, description, release date, primary genre, secondary genre, content rating, the average rating on a scale of 1–5, and the number of ratings. This step was performed from February 7, 2021 to February 26, 2021. There were some apps that were on the App Store but expected to be released for download at a future date. In addition, some apps had been removed from the app market during the data collection process. We removed all such apps from the analysis resulting in a sample of 78,890 apps, with 52,981 of them listing H-F as their primary genre and remaining with H-F as the secondary genre. The oldest app in the dataset was released on September 28, 2008. The description of the dataset is listed in Table 1, and the dataset is available to download on this link 3 .

Data collection and analysis flowchart.
Description of the dataset.

Average is computed for the 35,325 apps receiving at least one rating.
Text clustering
Next, to identify the sub-categories within the H-F apps, we performed text clustering on the descriptions of the apps provided by the developers. The app description written by the developer describes the objectives of an app. The features and functionalities of an app can be obtained from the description. The other nominal variables included title, developer name, etc., which do not entirely explain the purpose of an app. Therefore, we used the descriptions to understand the category based on their functionality. We used all 78,890 apps for creating clusters of apps using text mining. In our dataset, 19,083 apps had descriptions written in a non-English language. The language of each app description was detected using the langdetect package of python 4 . In our dataset, 44 languages were detected other than English, which included Spanish (3590 apps), German (2346 apps), Italian (2298 apps), Portuguese (2280 apps), French (1448), Dutch (1056), Japanese (908), and Russian (894). Before processing and cleaning the text data, we translated all non-English text to English using google translator. Next, data preparation steps were performed, which included converting all upper case to lower case, removing punctuations, numbers, stop words, and part of speech (auxiliary, conjunction, determiner, interjection, infinitive marker, negative participle, or possessive marker and pronoun), merging synonyms, and performing stemming. In addition, we considered terms present in at least 50 documents for efficient processing of the documents. The Log frequency weighting method and entropy term weighting methods were used.25,26 For dimensionality reduction, single value decomposition was used. Finally, for text clustering, the expectation-maximization algorithm 5 was adopted. 27 An iterative approach was used to stop the algorithm with a stopping criterion of non-overlap. Finally, we found 12 different clusters of apps with distinguishing features.
Time series forecasting models and measuring change during COVID-19 pandemic
To understand the impact of COVID-19 on app development, we created multiple forecasting models at the quarterly level. Thirteen different models were created—one each for 12 app categories and one for all apps together. Therefore, we had thirteen different series. Since COVID-19 was declared a pandemic in March 2020, we used the data until the first quarter of 2020 (pre-COVID-19) to forecast the next three quarters of 2020 (during COVID-19). In other words, the model was fitted to the number of apps developed during different quarters over the years pre-COVID-19. It was further used to forecast the number of apps in the following 3 quarters, which is considered the time interval of testing in our study. To estimate the expected number of new apps in the last three quarters of 2020, we created multiple ES models and ARIMA models. In each case, the ES model outperformed the ARIMA model based on Akaike Information Criterion (AIC). 28 Therefore, we explain ES models in the main paper. However, we include the results of the ARIMA models in Appendix B.
We created multiple ES models with a combination of trend and seasonality. For each H-F app sub-category, nine ES models were developed considering the combination of trend (none, additive and multiplicative) and seasonality (none, additive and multiplicative). The final model was selected based on the best AIC.
28
Two models that performed the best overall were the simple ES (with no trend and no seasonality) and Holt's linear trend method (HLTM, with the additive trend and no seasonality). The simple SE model (SESM) is an appropriate forecasting method when there is no clear trend and seasonality. The h-step ahead forecast for the period t + h at time t (ŷt+h|t) is given by a model in equation (1) and a level equation for estimating the level (ℓt) of series at time t in equation (2).

On the other hand, HLTM is suitable for a series with a trend. The model can be represented by the three equations below. First, equation (3) models the forecast for time t + h at time t (ŷt+h|t). Second, equation (4) estimates the level (ℓt) of series at time t. Finally, equation (5) estimates the slope (bt) of the series at time t. In the equations, 0 ≤ α ≤ 1 and 0 ≤ β* ≤ 1 are the smoothing parameters. For other forms of ES methods, refer to Hyndman and Athanasopoulos.
29


Results
Text clustering results
We identified 12 different categories of H-F apps through the text clustering method. For each text cluster, 20 descriptive terms, the label, and the number of apps are listed in Table 2. Notably, each app belongs to only one cluster. The top cluster comprising 13.6% of apps observed through our analysis includes apps recording fitness activity (cluster 1) which can be inferred through the keywords used in the descriptions such as "fitness," "workout," "exercise," "track," "automatically," "progress," and "weight". The second top cluster comprises about 13.2% of apps that provide support for sleep and stress management (cluster 2). The terms describing this cluster include "sleep," "stress," "mind," and "relax." The third top cluster includes about 12.9% of apps for sports-related activities and online training using games (cluster 3). The keywords for this cluster include "train," "game," "design," "test," "play," and "practice." Other categories include apps providing pregnancy and baby care, online pharmacies, recording health data, managing diet, scheduling classes in fitness clubs, providing medical information, offering products and services, recording running and bike riding, and offering nail and hair salon services.
Text clusters.

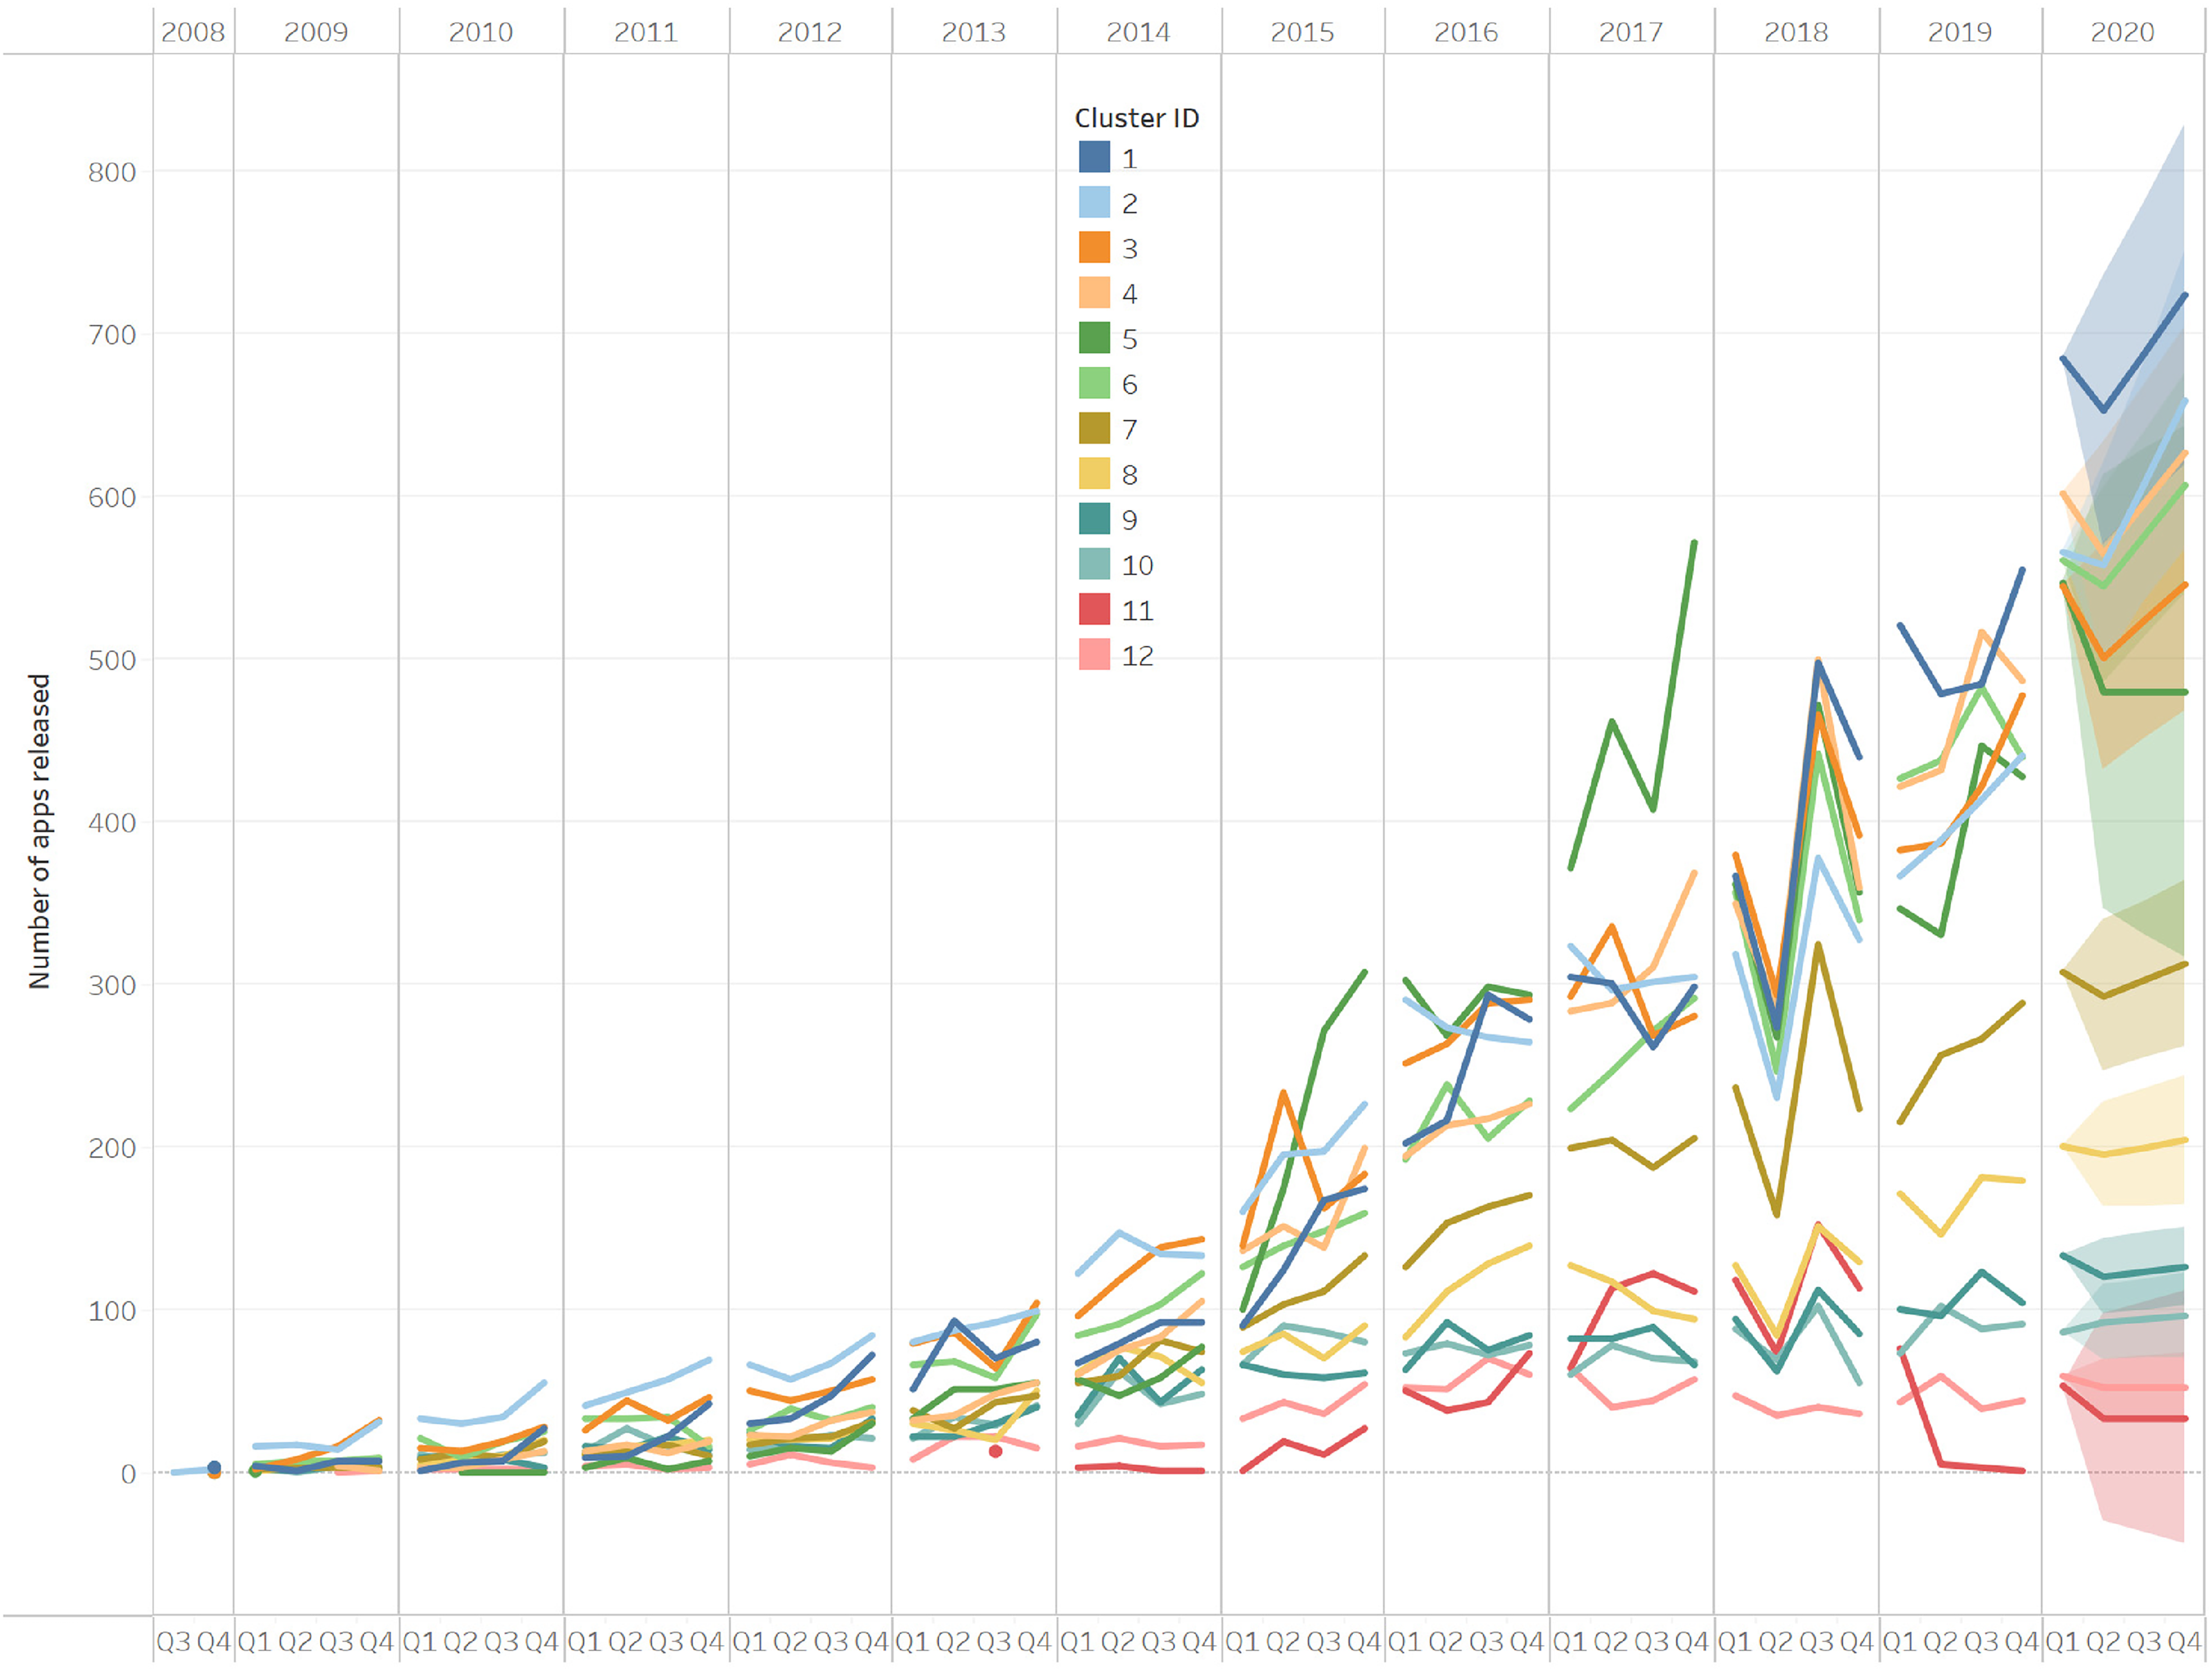
To understand the evolution of all apps and different app categories, we plotted their frequency over the yearly quarters in Figures 2(a) and 2(b), respectively. Specifically, Figure 2(a) presents trends in the release of all H-F apps over different quarters from 2008 to 2020. In contrast, Figure 2(b) shows trends of app categories identified through text clustering over quarters. The exact number of apps developed each year can be found in Appendix C. The top six clusters have been growing exponentially over the years. The growth of the smallest cluster (apps for online pharmacies—1.8%) had been slower than others. On the other hand, the growth of cluster 5, which includes apps by fitness centers and clubs where customers can sign up for classes, was slower in the first six years (2009–2014), but this cluster grew the fastest between 2014 and 2017. Interestingly, there was a dip in apps in this cluster in 2018 and 2019. A similar trend has been observed for cluster 11 in the last two years, where there has been a sudden dip in the number of newer apps for nail and hair salons in the previous two years. However, this cluster has seen significant growth from 2015 to 2018. The growth of clusters representing apps for running and biking (cluster 10) has been stagnant for the last 6 years. The same is true for apps for online pharmacies (cluster 12), where the growth has been flat over the previous 5 years. Moreover, all categories have grown significantly in 2020, which can be attributed to the increase in home exercise during COVID-19 and the change in daily H-F routines. The specific change in different app categories during COVID-19 is presented in the next section.

(a) Trends of all apps at the quarter level. (b) Trends of text clusters at the quarter level.
COVID-19 impact
To further understand the impact of COVID-19 on app categories derived through text clustering, the time-series forecasting models were created with a quarter as the unit of analysis. The visual representation of the forecast during the three quarters of 2020 can be seen in Figure 3. The summation of the estimates for last three quarters representing the COVID-19 time was taken to report the results. The forecasting results of the model of all apps together and each category are presented in Table 3. The table includes the root mean square error and mean absolute (MAE) for each model in addition to the actual number of apps developed after the outbreak of COVID-19 reported by adding the total number of apps in three quarters, estimated number of apps by the model reported by taking the sum of estimated apps in three quarters, the confidence interval of the estimates and the percentage of the difference between the estimated and actual number of new apps available during COVID-19. As listed in the last row of Table 3, our best model (HLTM) estimated a total of 12,981 H-F apps in the three quarters after the outbreak of the pandemic. However, there were 16,866 actual apps during the same time. Therefore, there is a growth of 29.9% than the estimates in the availability of H-F apps. Considering the 95% confidence interval, the lower bound of 11,381 suggests an increase of 48.2%, and the upper bound indicates a rise of 15.7%. Therefore, we can conclude that amid COVID-19, the actual number of H-F apps surpassed the estimates by 15.7%–48.2% based on a 95% confidence interval.
Forecasting results.
Forecasting results for text clusters.
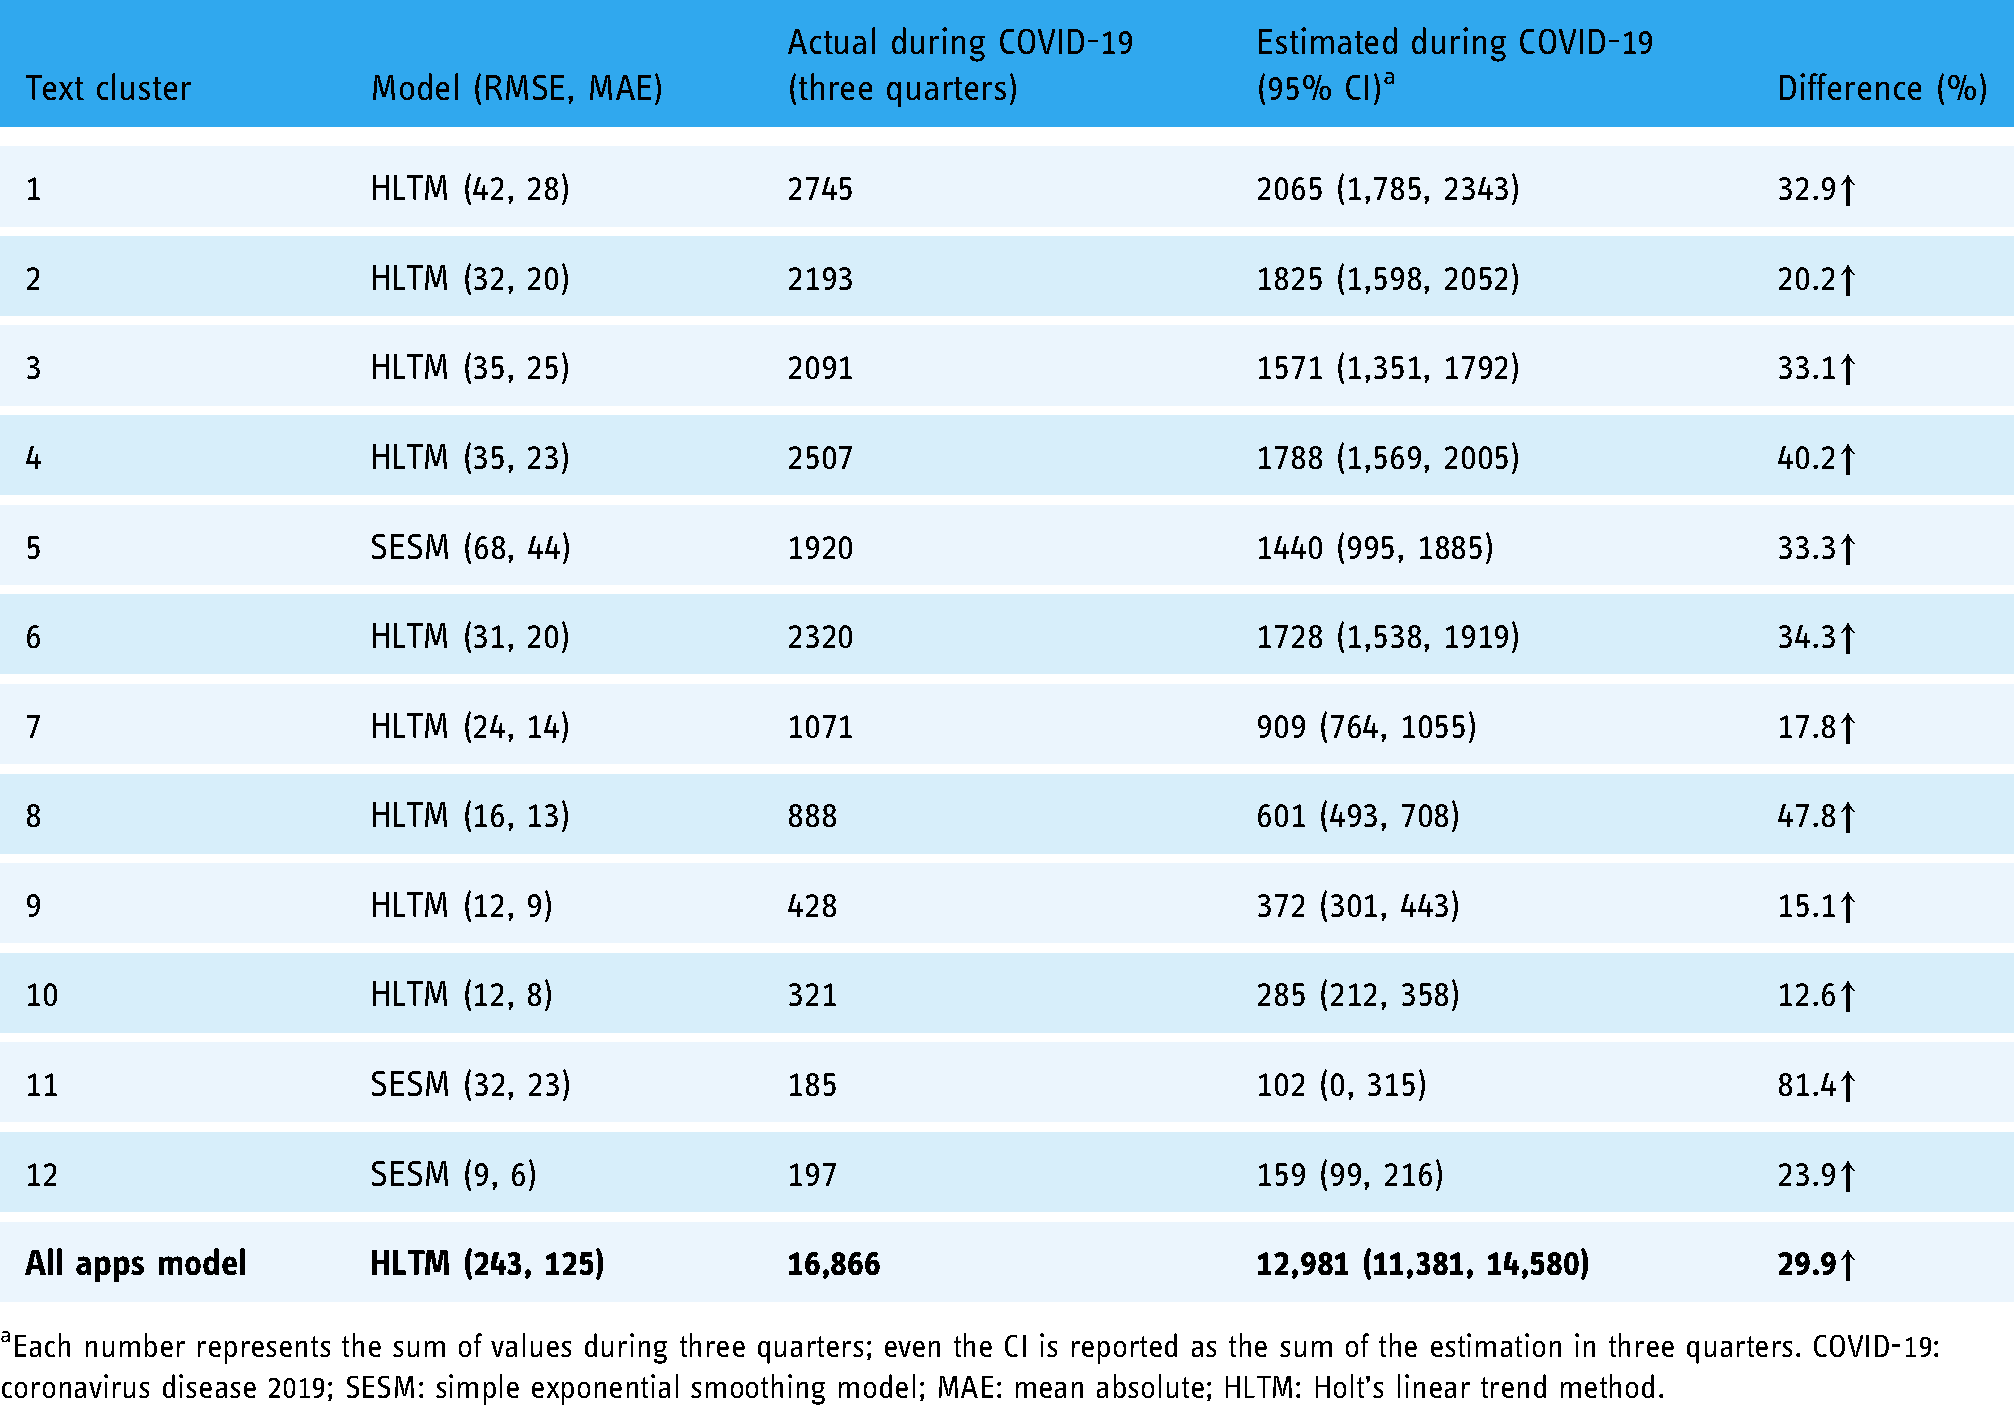
Each number represents the sum of values during three quarters; even the CI is reported as the sum of the estimation in three quarters. COVID-19: coronavirus disease 2019; SESM: simple exponential smoothing model; MAE: mean absolute; HLTM: Holt's linear trend method.
The analysis at the category level yielded exciting results. For complete results of forecasting, including parameter estimates, please refer to Appendix D. Except for clusters 12 (apps for online pharmacies), 5 (apps of fitness centers where users can sign up for the classes), and 11 (apps for nail and hair salons) where SESM was selected, HLTM performed the best. During COVID-19, that is, the last three quarters of 2020, cluster 4 (Commercial apps providing some products and services to the customers) has the highest number of apps (2507), whereas the estimated number of apps using the HLTM model is 1788, which means the actual number surpassed the estimated number by 40.2%. In other words, there was an additional 40% growth than the expectations in cluster 4 after the pandemic outbreak. Similarly, cluster 1 (automatic workout and fitness activity tracking apps) surpassed the estimate by 32.9%, cluster 2 (sleep and stress management apps) exceeded by 20.2%, cluster 3 (apps for sports-related activities and online training) by 33.1%, cluster 5 (Apps of fitness centers where users can sign up for the classes) by 33.3%, cluster 6 (Medical apps providing doctor access and treatment information) by 34.3%, cluster 7 (Apps recording health data through sensors) by 17.8%, cluster 8 (apps for diet management) by 47.8%, cluster 9 (apps supporting pregnancy and baby care) by 15.1%, cluster 10 (Apps for running and bike riding) by 12.6%, cluster 11 (Apps for nail and hair salon) by 81.4% and cluster 12 (Apps for online pharmacies) surpasses the estimate by 23.9%.
Post hoc analysis
Irrespective of the change in the growth of different categories of H-F apps during COVID-19, we were interested in identifying the different types of H-F apps where the demand is high, but the supply is low. This post hoc analysis is independent of the analysis presented in section 3.2. Through this analysis, we aim to identify potential areas of growth. Note here; we differentiate the development of new apps from the actual demand as the availability of new apps does not always mean higher demand. Therefore, this analysis does not provide the demand during COVID-19 but rather the general demand. To understand the demand for different categories of H-F apps, we use the variable "number of ratings" for each app. We use the number of ratings as the measure of demand instead of the number of downloads because at least 21% of the users abandon the app after using it only once. 6 It implies that using the downloads of an app as demand may involve measurement error. Indeed, a similar problem has been studied in the past, for example, Garg and Telang 30 argued for an indirect measure such as an app's ranking to measure the demand. We argue that the 'number of ratings’ at the least confirms that the users are genuine compared to the 'number of downloads,' which measures the number of installs and may not represent the actual users. In our analysis, our purpose is to identify the areas of potential growth, and it is safe to assume that the apps with more number of ratings are more popular than those with fewer ratings.
In Table 4, we list the average number of ratings 7 for each cluster of apps, indicating each cluster's demand. In addition, we list the average number of ratings of the top three apps in each cluster to understand the user base of such apps. On average, an app in the largest cluster, that is, apps for automatically tracking fitness activities (cluster 1) has 984.4 ratings, which is significantly greater than the average number of ratings across all apps (383.9). In addition, the number of ratings in the top three apps in this category is large, that is, 740,706. It implies that the high demand drives the growth of this cluster. The same is true for the second largest cluster (cluster 2), which has a higher demand. However, interestingly, the third-largest cluster containing apps for sports activities has a significantly smaller number of ratings than the average (115.8 vs. 383.9), indicating the demand is low for these types of apps. On the other hand, the smaller cluster of apps where demand is high may provide opportunities for developing new apps. For instance, the size and growth of cluster 9 containing parenting and baby care apps are small. However, the average number of ratings for this cluster of apps is 953.1, which is significantly greater than the average number of ratings across all apps (383.9). Other small clusters with high demand include cluster 8, containing apps for diet management. The top app in this category is MyFitnessPal, with more than 1.1 million user ratings in our dataset and more than 200 Million users in 2020, according to BusinessofApps. 31 Clearly, such a large user base of H-F with Food and Drinks features presents an area of growth. Similarly, the demand for apps in cluster 10 containing apps for running and bike riding is high. The top app in this category is "AllTrails: Hike Bike & Run", with more than 500,000 ratings in our dataset, indicating a higher demand for such an app. Note here, that all apps in a cluster have H-F features. Therefore, our conclusions are limited to only apps with H-F features. There may be similar categories of apps on app markets without H-F features.
Average demand for different categories of apps.

Discussion
In this paper, we presented descriptive and predictive analytics on a novel dataset comprising a population of H-F apps from the Apple App Store. Through descriptive analytics, unique insights were gained about the trends of different categories of H-F apps developed through text clusters. The post hoc analysis allowed us to identify the areas that need further exploration. Besides, the predictive analytics allowed us to quantify the impact of COVID-19 on the development of new H-F apps 8 . The availability of more than expected apps indicates the greater need for these apps during COVID-19. Overall, our model suggests the availability of an additional 29.9% of apps during COVID-19. This result has implications for the app markets as it presents the impact of a pandemic on their growth. In other words, we measured the effect of a major event on its growth, which can be incorporated into the estimation during future pandemics.
Our results indicate the overall change in the dynamic of the use of mHealth during COVID-19. The national awareness campaigns made the public more conscious of their health. The health consciousness appears to have motivated the public to adopt digital solutions in the form of mHealth. 32 Our results corroborate this finding as we observed the availability of numerous H-F apps after the pandemic outbreak.
During the pandemic, mobile technology enabled the public to remain connected to health systems and obtain necessary health-related guidance, as discussed by Giansanti. 33 Our results suggested an increased deployment of apps to connect the public to healthcare systems through telemedicine. Healthcare systems across the globe have adopted mobile technology to provide healthcare-related solutions, as discussed by Bashshur et al. 34 At the same time, mHealth offered immense support to pregnant ladies to fight the disease and take self-care for their health. 35 Our analysis also found more than expected growth in the apps related to pregnancy and baby care. Our models also suggested a significant growth in the availability of sleep and stress management apps. Mobile apps have become a valuable resource for people suffering from sleep issues and stress. 36 Overall, through our research, we have been able to identify the areas where mHealth proved to be helpful after the outbreak of the COVID-19 pandemic.
To summarize the contributions of our paper, we adopt the framework presented by Berthon et al. 37 In this framework, the authors suggested describing the contributions through four tuples—Problem, Theory, Method and Context. The number of tuples contributed is termed the degrees of freedom. In our paper, we have two degrees of freedom as we contribute to the two tuples—problem and context. First, we contributed to the problem of estimating the growth of digital health in the form of mHealth during the pandemic. Second, we contributed to the context of H-F apps in an app market. We compiled a novel dataset containing a population of H-F apps on an app market. Miranda et al. 38 discussed that creating a novel dataset is considered an analytics contribution. To the best of our knowledge, this is the first study of its kind where the population of H-F apps has been analyzed using text analysis and forecasting techniques. There are papers analyzing the text of mHealth literature, but that problem is very different from others. For example, Ozaydin et al. 39 used hierarchical clustering for analyzing the research papers. By studying the population of H-F apps, we are able to study the current state-of-the-art in H-F apps comprehensively.
Our analysis has a few limitations. First, any data pulled from an App store has the limitation of what was current as of that time. However, we have a complete dataset till 2020, and therefore, we have a complete analysis until the end of 2020. Second, we pulled data from only one app store—Apple. It is obviously the first and major player in the app market. Several other app markets (e.g., Google Play Store with the largest user base) are also available, but this limitation is somewhat mitigated because the same apps are available on different app markets, and analyzing multiple app markets will most likely provide us with the same results. Third, our analysis provided growth of H-F apps in the app market, which does not capture the usage of apps. Future research using survey methods will report the impact of a pandemic on app usage. Finally, we focused on the H-F genre in the app market. However, future studies can perform the same analysis on other genres of apps on app markets.
Conclusions
Our study provides valuable insights into the evolution of H-F apps using a novel dataset. Our study provides a reference point for estimating app growth during future pandemics. In addition, it guides app developers by identifying areas with opportunities. Through this paper, we share our dataset on this link 9 with other researchers so that they can conduct more research. Therefore, our paper will give rise to more research papers in this domain.
Supplemental Material
sj-docx-1-dhj-10.1177_20552076221129070 - Supplemental material for Growth in the development of health and fitness mobile apps amid COVID-19 pandemic
Supplemental material, sj-docx-1-dhj-10.1177_20552076221129070 for Growth in the development of health and fitness mobile apps amid COVID-19 pandemic by Pankush Kalgotra, Uzma Raja and Ramesh Sharda in Digital Health
Footnotes
Declaration of Conflicting Interests
The authors declared no potential conflicts of interest with respect to the research, authorship, and/or publication of this article.
Contributorship
PK designed the study, collected the dataset and performed analysis. UR and RS were involved in interpreting the results. All authors reviewed and edited the manuscript and approved the final version of the manuscript.
Guarantor
PK
Funding
The authors received no financial support for the research, authorship, and/or publication of this article.
Supplemental material
Supplemental material for this article is available online.
Notes
References
Supplementary Material
Please find the following supplemental material available below.
For Open Access articles published under a Creative Commons License, all supplemental material carries the same license as the article it is associated with.
For non-Open Access articles published, all supplemental material carries a non-exclusive license, and permission requests for re-use of supplemental material or any part of supplemental material shall be sent directly to the copyright owner as specified in the copyright notice associated with the article.