
Abstract
Background:
Older kidney transplant recipients have inferior outcomes compared to younger recipients, and this risk may be compounded by donor characteristics.
Objective:
We applied an unsupervised machine learning clustering approach to group older recipients into similar phenotypes. We evaluated the association between each cluster and graft failure, and the impact of donor quality on outcomes.
Design:
This is a nationally representative retrospective cohort study.
Setting and Patients:
Kidney transplant recipients aged ≥65 years identified from the Scientific Registry of Transplant Recipients (2000-2017).
Measurements and Methods:
We used unsupervised clustering to generate phenotypes using 16 recipient factors. Donor quality was evaluated using 2 approaches, including the Kidney Donor Risk Index (KDRI). All-cause graft failure was analyzed using multivariable Cox regression.
Results:
Overall, 16 364 patients (mean age 69 years; 38% female) were separated into 3 clusters. Cluster 1 recipients were exclusively female; cluster 2 recipients were exclusively males without diabetes; and cluster 3 recipients were males with a higher burden of comorbidities. Compared to cluster 2, the risk of graft failure was higher for cluster 3 recipients (adjusted hazard ratio [aHR] = 1.25, 95% confidence interval [CI] = 1.19-1.32). Cluster 3 recipients of a lower quality (KDRI ≥1.45) kidney had the highest risk of graft failure (aHR = 1.74, 95% CI = 1.61-1.87) relative to cluster 2 recipients of a higher quality kidney.
Limitations:
This study did not include an external validation cohort. The findings should be interpreted as exploratory and should not be used to inform individual risk prediction nor be applied to recipients <65 years of age.
Conclusions:
In a national cohort of older kidney transplant recipients, unsupervised clustering generated 3 clinically distinct recipient phenotypes. These phenotypes may aid in complementing allocation decisions, providing prognostic information, and optimizing post-transplant care for older recipients.
Introduction
Older adults represent a growing proportion of kidney transplant recipients but experience worse survival than younger recipients.1,2 Several age-related comorbidities may contribute to increased mortality among older recipients, including diabetes and cardiovascular disease. 3 Currently, few approaches exist to characterize older kidney transplant recipients. Adult kidney transplant candidates in the United States are risk stratified based on their Estimated Post-Transplant Survival (EPTS) score, which considers age, time on dialysis, prior solid organ transplant, and diabetes. 4 In older adults, incorporating a wider range of comorbidities into risk prediction tools could improve survival accuracy to better support kidney allocation decisions and post-transplant care.
Machine learning can analyze complex relationships in large data sets and is increasingly being applied in the field of solid organ transplantation.5,6 Unsupervised clustering, a machine learning approach, can identify patterns within a heterogeneous population and group similar individuals without prior knowledge of outcomes. 7 Prior unsupervised clustering studies in kidney transplantation have used donor, recipient, and peritransplant variables to derive clusters,8,9 but peritransplant variables are not always known at the time of kidney allocation. A more clinically relevant approach is to produce phenotypes separately for donors and recipients and subsequently assess outcomes for combinations of donor and recipient clusters at varying risk levels.
Our team previously used unsupervised clustering to generate phenotypes of deceased kidney donors among older transplant recipients, revealing 5 donor clusters with differential risks of graft failure. 10 While informative, we did not generate recipient clusters nor did we consider the combined impact of donor and recipient factors on post-transplant outcomes. In this study, we used unsupervised clustering to characterize older kidney transplant recipients. The primary objective was to generate recipient phenotypes and evaluate their individual post-transplant outcomes. Secondary objectives included (1) assessing outcomes for different combinations of donors and recipients, using the Kidney Donor Risk Index (KDRI) 11 or the 5 donor clusters identified in our previous study 10 to classify donors and (2) stratifying the primary analyses by each of these donor measures to investigate whether donor risk modifies the association between recipient risk and post-transplant outcomes.
Methods
Study Design and Population
This study used data from the Scientific Registry of Transplant Recipients (SRTR). The SRTR data system includes data on all donor, waitlisted candidates, and transplant recipients in the United States, submitted by the members of the Organ Procurement and Transplantation Network (OPTN). The Health Resources and Services Administration (HRSA), US Department of Health and Human Services provides oversight to the activities of the OPTN and SRTR contractors. The study population consisted of patients ≥65 years of age who underwent deceased donor kidney transplantation from 2000 to 2017. We excluded patients with a previous kidney transplant, those receiving multiorgan transplants, and those without complete data across recipient characteristics of interest. This study was approved by the Nova Scotia Health Research Ethics Board (#1027260).
Data Collection
We used 16 recipient variables to generate the recipient clusters for phenotyping: age, sex, race, height, weight, body mass index (BMI) category, functional status defined using the Karnofsky Performance Scale, cause of kidney failure, coronary artery disease (CAD), diabetes, hypertension, cerebrovascular disease, peripheral vascular disease, malignancy, peak panel reactive antibody (PRA) level, and dialysis vintage. Our approach was to utilize only those variables that would be available at the time of kidney allocation.
Variables that were not included in the cluster derivation but are important for post-transplant risk assessment constituted our adjustment set (Supplementary Table 1), including donor age, sex, race, height, weight, BMI category, cytomegalovirus status, diabetes, hypertension, hepatitis C virus, cerebrovascular cause of death, donation after cardiac death, vasodilator use, arginine use, inotrope use, serum creatinine level, KDRI ≥1.45, cold ischemia time, and number of human leukocyte antigen (HLA) mismatches.
Unsupervised Cluster Generation
Given that our data had multiple types (ie, numerical and categorical), we employed multiview clustering methods. By treating numerical and categorical features as distinct views, where each “view” provides a unique representation of the data, we were able to integrate multiple aspects of the data to generate more meaningful clusters. This approach overcomes limitations of traditional clustering algorithms typically designed for single-view data analysis.
Our methodology consisted of 3 modules: (1) feature engineering, (2) data embedding, and (3) multiview clustering (Supplementary Figure 1). In the feature engineering module, we used one-hot encoding to transform categorical features into a multidimensional vector of numerical values as one of the views for multiview clustering. Numerical features were normalized using maximum absolute scaling to preserve the sparsity of the data by ensuring values ranged approximately from −1 to 1, providing a second view for clustering. In the data embedding module, we reduced the dimensionality of the data using split autoencoders, a multiview variant of autoencoders. 12 We implemented split autoencoders on the one-hot encoded categorical feature set as view 1 and the maximum absolute scaled continuous feature set as view 2. The view with the larger number of features, view 1, was used to create an auto-encoded embedding, which was then used to reconstruct both the categorical and continuous views. In the multiview clustering module, we used an ensemble clustering approach with multiview k-means and k-medoids clustering methods, 13 as well as a co-training–based spectral clustering method. 14 We experimented with cluster numbers ranging from 2 to 5 clusters. We used the silhouette score, which measures both the cohesion within clusters and separation from other clusters, to determine the optimal number of clusters. The clustering model (where k = 2-5) with the highest silhouette score is regarded as the best model, and its k value indicates the optimal number of clusters within the data. The Davies-Bouldin score was used to further validate the quality of the clustering models. 15 The Davies-Bouldin score measures the ratio of average dissimilarity between and within clusters (lower score indicates better cluster separation and compactness). The combination of silhouette and Davies-Bouldin was used to select the best clustering model.
Donor Risk
We ascertained donor risk in 2 ways, using the KDRI 11 or using the donor clusters generated in our previous unsupervised clustering study. 10 The KDRI scores were dichotomized as low (<1.45) or high (≥1.45) risk. Our selected threshold of 1.45 corresponds to a Kidney Donor Profile Index (KDPI) of 85%, the cutoff for high-risk donor kidneys within the current allocation system. For the donor clusters, the detailed approach to clustering is described in the original paper. 10 Briefly, we used unsupervised clustering to generate internally validated phenotypes of deceased donors among older kidney transplant recipients in the SRTR using several donor variables known to be associated with graft failure. 10 This approach identified 5 unique donor clusters. 10 Their associated risks of graft failure are shown in Supplementary Figure 2. 10
Outcomes
The primary outcome was all-cause graft failure, defined as patient death or graft failure (permanent return to dialysis or need for preemptive re-transplantation). Secondary outcomes included death despite kidney function, death-censored graft failure, and delayed graft function (DGF; defined as needing dialysis within the first week following transplantation).
Statistical Analysis
All analyses were performed on the recipient clusters with the best silhouette score and Davies-Bouldin score results, using Stata/SE version 17.0. 16 Baseline characteristics were expressed as count (percentage) for categorical variables and as mean (standard deviation [SD]) or median (interquartile range [IQR]) for continuous variables. We assessed differences between clusters using the chi-square test for categorical variables and the Kruskal-Wallis test for continuous variables. We used unadjusted Kaplan-Meier survival curves to model all-cause graft failure in each recipient cluster. We compared curves using the log-rank test and assessed proportionality with visual examination of the log-log survival plots.
The association between recipient cluster assignment and the outcomes of all-cause graft failure, death despite kidney function, and death-censored graft failure was determined using Cox proportional hazards regression, presented as hazard ratios (HRs) with 95% confidence intervals (95% CIs). The outcome of DGF was assessed using logistic regression, presented as odds ratios (ORs) with 95% CIs. The multivariable models were adjusted for donor and peritransplant variables (see section “Data Collection”). In total, 21% of all cases had missing data. Missing values are described in Table 1. We imputed missing values using multivariate imputation by chained equations. 17 Our imputation model included all factors used to derive the recipient clusters, nonmissing donor factors, and the outcomes. We imputed 20 complete data sets to approximate the proportion of incomplete cases. The estimates from each imputed data set were pooled into 1 overall estimate using Rubin’s rules. 18
Baseline Characteristics by Recipient Cluster.

HLA = human leukocyte antigen; IQR = interquartile range; PRA = panel reactive antibody; SD = standard deviation.
Data are expressed as no. (%) of recipients unless otherwise indicated. Percentages may not total 100 because of rounding.
Data on donor height were missing for 1 patient, data on serum creatinine level were missing for 10 patients, and data on cold ischemia time were missing for 740 patients.
In a secondary analysis, we evaluated the association between combined donor-recipient risk and our outcomes. For each donor risk construct (binary KDRI variable and 5-level donor cluster variable), we used the recipient clusters to generate a multilevel categorical variable of combined donor and recipient risk (Supplementary Figure 2). We determined associations with the outcomes in multivariable regression analyses. In another secondary analysis, we assessed multivariable associations between recipient cluster assignment and the outcomes across subgroups of KDRI and the 5 donor clusters, to determine whether donor risk modifies the risk of post-transplant outcomes.
Results
Participants
There were 165 081 adults who received a deceased donor kidney transplant between 2000 and 2017. After exclusions, we identified 16 364 adults ≥65 years of age who received a first, solitary kidney transplant and had complete data on recipient characteristics (Figure 1). The mean (SD) age of recipients was 69.4 (3.7) years and 6153 recipients (38%) were female (Table 1).

Flow chart of kidney transplant recipients included in the study cohort.
Clustering Results
The optimal number of clusters was 3. The multiview k-means method produced the best overall clustering performance (silhouette 0.63, Davies-Bouldin 0.84) (Supplementary Table 2). Figure 2 shows the visual separation of clusters.

Results of t-SNE mapping depicting 3 distinct clusters of older kidney transplant recipients.
Baseline Characteristics by Recipient Cluster
Using the multiview k-means method, there were 6153 patients (38%) in cluster 1, 4813 patients (29%) in cluster 2, and 5398 patients (33%) in cluster 3. Table 1 provides their baseline characteristics. Cluster 1 recipients were exclusively female (100%) with a median (IQR) time on dialysis of 2.3 (0-4.5) years. They were less likely to have CAD (n = 663; 11%) and a peak PRA level <20 (n = 3748; 61%) compared to the other clusters. Their donors were younger (mean [SD] = 43.4 [16.9] years) and were less likely to be an expanded criteria donor (n = 1895; 31%) or have a KDRI ≥1.45 (n = 2339; 38%). They were more likely to have zero HLA mismatches (n = 652; 11%).
Patients in cluster 2 were male (100%), slightly older (mean [SD] = 70.1 [4.2] years), and more likely to be White (n = 3947; 82%). They were more likely to have a BMI between 18.5 and 24.9 kg/m2 (n = 1750; 36%) and less likely to require functional assistance (n = 416; 9%) than the other clusters. They were less likely to have diabetes (0%) and more likely to have malignancy (n = 761; 16%). They were more likely to have glomerulonephritis (n = 1091; 23%) or hypertension (n = 2235; 46%) as the cause of kidney failure. They had a shorter dialysis vintage (median [IQR] = 2.1 [0-4.1] years).
Cluster 3 recipients were exclusively male (100%). They had a higher burden of CAD (n = 1056; 20%), diabetes (n = 5091; 94%), and peripheral vascular disease (n = 683; 13%). They were more likely to have diabetes as the cause of kidney failure (n = 4067; 75%). They experienced a longer time on dialysis (median [IQR] = 2.7 [0.5-4.5] years).
Post-transplant Outcomes in Each Recipient Cluster
For the primary outcome of all-cause graft failure, there were 9042 events over 78 129 total years at risk. The rate of graft failure was 51.7% in cluster 1, 56.0% in cluster 2, and 58.7% in cluster 3. Figure 3 shows the unadjusted survival curves for each recipient cluster (log-rank P < .001). Compared to cluster 2, the adjusted risk of all-cause graft failure was lower in cluster 1 (adjusted hazard ratio [aHR] = 0.95, 95% CI = 0.90-0.997) and higher in cluster 3 (aHR = 1.25, 95% CI = 1.19-1.32). Similar associations were observed for the individual subcomponents of all-cause graft failure. Compared to cluster 2, there were higher odds of DGF in cluster 3 (adjusted odds ratio = [aOR] = 1.42, 95% CI = 1.30-1.55) but no difference in cluster 1 (aOR = 0.96, 95% CI = 0.88-1.05) (Table 2).

Kaplan-Meier survival curves for time to all-cause graft failure for each recipient cluster. The log-rank P-value was < .001.
Post-transplant Outcomes According to Recipient Cluster.

CI = confidence interval; HR = hazard ratio; OR = odds ratio.
Adjusted for donor factors (age, sex, race, height, weight, body mass index category, cytomegalovirus status, diabetes, hypertension, hepatitis C virus, cerebrovascular cause of death, donation after cardiac death, vasodilator use, arginine use, inotrope use, serum creatinine level, Kidney Donor Risk Index ≥1.45), cold ischemia time, and number of human leukocyte antigen mismatches.
Post-transplant Outcomes According to Combined Donor-Recipient Risk
The rate of all-cause graft failure ranged from 47.1% to 62.9% for the different KDRI-recipient cluster combinations (Supplementary Table 3), with adjusted risks presented in Table 3. All recipient clusters had a higher risk of all-cause graft failure at KDRI ≥1.45 vs KDRI <1.45. Compared to the reference group (cluster 2 recipients of KDRI <1.45 kidneys), cluster 3 recipients of KDRI ≥1.45 kidneys had the highest risk of all-cause graft failure (aHR = 1.74, 95% = CI 1.61-1.87). We observed similar patterns of association for the secondary outcomes, with some exceptions. The combination of KDRI <1.45 and recipient cluster 1 was protective against death despite kidney function compared to the reference group (aHR = 0.91, 95% CI = 0.84-0.98) (Supplementary Table 4). Recipients of KDRI ≥1.45 kidneys had considerably higher point estimates for death-censored graft failure (Supplementary Table 5). For DGF, point estimates were higher across all KDRI-recipient combinations (Supplementary Table 6).
Time to All-Cause Graft Failure According to Kidney Donor Risk Index and Recipient Cluster Combinations (n = 16 178).


CI = confidence interval; HR = hazard ratio; KDRI = Kidney Donor Risk Index.
Adjusted for donor sex, donor body mass index, donor cytomegalovirus status, donor vasodilator use, donor arginine use, donor inotrope use, cold ischemia time, and number of human leukocyte antigen mismatches. Green (HR <1.00), yellow (HR 1.00-1.49), orange (HR 1.50-1.99), and red (HR >2.00). Colors only apply to significant results.
The rate of all-cause graft failure ranged from 31.4% to 63.0% across donor-recipient cluster combinations (Supplementary Table 7), with adjusted risks presented in Table 4. Relative to the reference (donor cluster 3-recipient cluster 2), there was a high risk of graft failure for recipients of kidneys from donor clusters 2 and 4. Focusing on recipient clusters, those in recipient cluster 3 were at higher risk when receiving kidneys from donor clusters 1, 2, and 4; the risk was not as high when receiving from donor clusters 3 and 5. Similar associations were observed for death despite kidney function, although point estimates varied (Supplementary Table 8). The findings were not as consistent for death-censored graft failure, particularly for recipients of kidneys from donor cluster 4, whereby the point estimate was high for all recipient clusters (Supplementary Table 9). The DGF was increased for cluster 3 recipients across all donor pairings. Cluster 1 and 2 recipients had higher odds of DGF only when receiving kidneys from donor clusters 2 and 4 (Supplementary Table 10).
Time to All-Cause Graft Failure According to Donor-Recipient Cluster Combinations (n = 13 294).

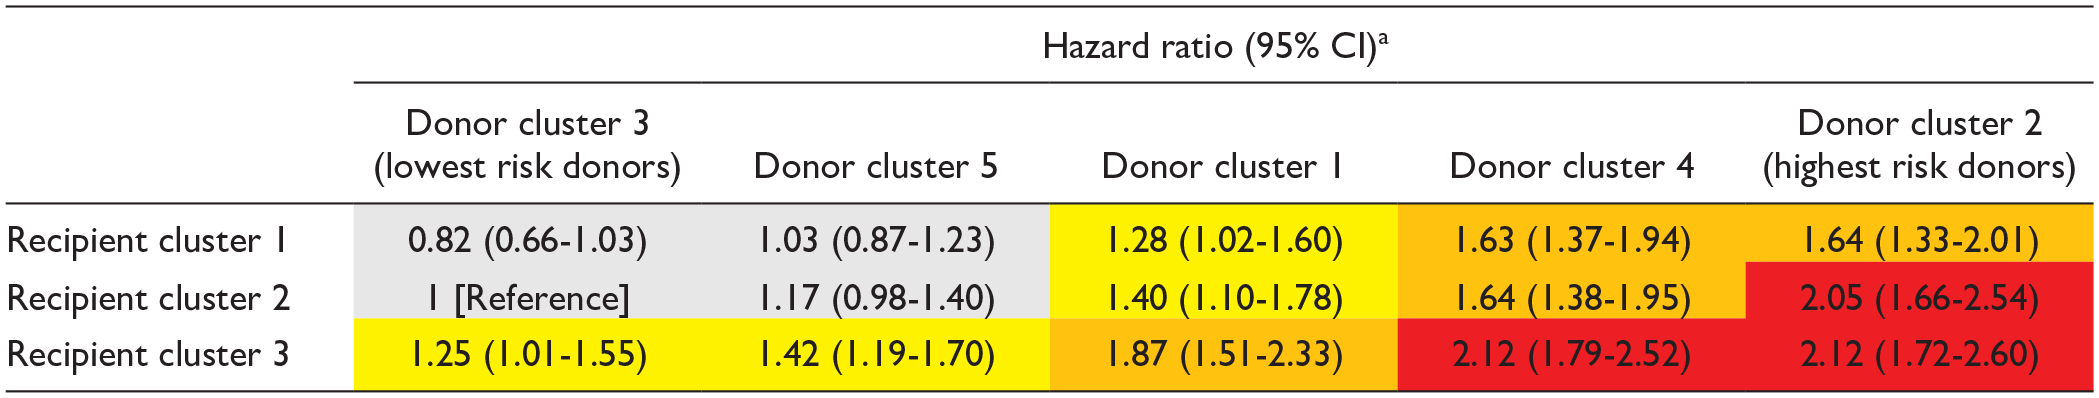
CI = confidence interval; HR = hazard ratio.
Adjusted for cold ischemia time and number of human leukocyte antigen mismatches. Green (HR <1.00), yellow (HR 1.00-1.49), orange (HR 1.50-1.99), and red (HR >2.00). Colors only apply to significant results.
Post-transplant Outcomes Stratified by Donor Risk
Table 5 shows the risk of post-transplant outcomes stratified by KDRI. The KDRI modified the association between recipient cluster assignment and DGF for cluster 3 recipients (P = .04). Among recipients of a higher quality (KDRI <1.45) kidney, the odds of DGF were 58% higher in cluster 3 compared to cluster 2 (aOR = 1.58, 95% CI = 1.40-1.79). Among recipients of a lower quality (KDRI ≥1.45) kidney, the odds of DGF were 31% higher in cluster 3 compared to cluster 2 (aOR = 1.31, 95% CI = 1.15-1.49). There were no other statistically significant interaction terms.
Post-transplant Outcomes Stratified by Kidney Donor Risk Index..

KDRI = Kidney Donor Risk Index.
All models were adjusted for donor sex, donor body mass index, donor cytomegalovirus status, donor vasodilator use, donor arginine use, donor inotrope use, cold ischemia time, and number of human leukocyte antigen mismatches. Results are expressed as hazard ratios (95% confidence intervals) for the outcomes of all-cause graft failure, death despite kidney function, and death-censored graft failure. Results are expressed as odds ratios (95% confidence intervals) for the outcome of delayed graft function.
Supplementary Table 11 shows the risk of post-transplant outcomes stratified by previously derived donor clusters. 10 Compared to cluster 2 recipients, cluster 3 recipients were at higher risk of all-cause graft failure when receiving kidneys from donor clusters 1, 4, and 5. Cluster 1 recipients were at lower risk of all-cause graft failure when receiving kidneys from donor clusters 2 and 5. Cluster 3 recipients had higher odds of DGF when receiving kidneys from all donor clusters except 2, while cluster 1 and 2 recipients had comparable odds of DGF across all donor clusters.
Discussion
In a national cohort, we used an unsupervised machine learning clustering approach to characterize kidney transplant recipients aged ≥65 years. Unsupervised clustering generated 3 recipient phenotypes exhibiting differential risks of all-cause graft failure. Recipients belonging to a high-risk recipient phenotype who received high-risk donor kidneys were at even higher risk of graft failure. Our results align with established risk factors for graft failure, highlighting the utility of using an objective, data-driven approach to quantify post-transplant risks in older kidney transplant recipients.
Our clustering approach revealed natural occurrences splitting older kidney transplant recipients into groups. Cluster 1 recipients were exclusively female, cluster 2 recipients exclusively males without diabetes, and cluster 3 recipients exclusively males of whom 94% had diabetes. This separation raises the question of why males were divided by diabetes status, while females were not. One may surmise that this separation reflects true differences; females with and without diabetes who undergo kidney transplantation may be more similar than their male counterparts. However, this hypothesis is not supported by existing literature; a study of 7529 individuals from the United Kingdom found greater differences in cardiovascular risk factors between women with and without diabetes than between men with and without diabetes. 19 We speculate that the observed homogeneity among females in our study may stem from differential access to kidney transplantation between males and females. Females have lower rates of referral,20 -23 activation on the waitlist, 24 and eventual transplantation once waitlisted. 24 Health care providers may perceive women as more frail and unable to tolerate major surgery, 25 making them less likely to discuss kidney transplant as a preferred option with women. 26 Women may also be less likely to seek a referral or more likely to have concerns or decline information about transplantation.27,28 Globally, nephrologist-identified barriers to women accessing kidney transplantation include caregiving duties, pressure to maintain appearance, fertility concerns, lower health literacy, and lack of material support. 29 Disparities in access to kidney transplantation are particularly evident among older age groups.21,22 In a large population in the United States, women aged 65 to 80 years were 28% less likely to be referred for kidney transplant than men of the same age, compared to 7% at ages 45 to 64 years and no difference at ages 18 to 44 years. 22 Therefore, older women who successfully overcome the aforementioned barriers to enter the recipient pool may represent a more selected group than men. Indeed, cluster 1 exhibited the lowest risk of all-cause graft failure in our study, even when compared to cluster 2 which was representative of a healthy population of male recipients.
We are aware of only one other study that has used an unsupervised machine learning approach to cluster older kidney transplant recipients. Thongprayoon et al 9 identified 3 distinct clusters among 419 recipients aged ≥80 years in the United States from 2010 to 2019, where clusters were based on donor-, recipient-, and transplant-related characteristics. Our study differs in that our unsupervised clustering approach was based solely on recipient factors, providing an objective method to stratify risk in older kidney transplant recipients irrespective of the donor or transplant procedure. We also used a younger age cutoff of ≥65 years and thus included a larger cohort of recipients than the previous study.
The recipient clusters exhibited differential risks of post-transplant outcomes. Cluster 1 had the lowest risk of graft failure and was comprised of female recipients with a lower proportion of CAD and higher peak PRA levels. High PRA levels have been associated with an increased risk of all-cause mortality and death-censored graft failure. 30 Interestingly, despite cluster 1 recipients being more sensitized, this did not translate to poorer outcomes in our study, further suggesting that multiple recipient factors act collectively to influence post-transplant outcomes. Cluster 3 had the highest risk of graft failure and the highest proportion of recipients with known risk factors, including diabetes, 31 CAD, 32 peripheral vascular disease, 33 and a longer dialysis vintage.34,35 Cluster 2 had several low-risk features compared to the other clusters, including more recipients at a normal BMI, 36 no diabetes, 31 better functional status,37,38 and a shorter dialysis time.34,35 Despite this, the rate of all-cause graft failure was higher in cluster 2 compared to cluster 1. Cluster 2 recipients were 1 year older on average and more likely to be male, have CAD, and have cancer than cluster 1 recipients. While each of these factors individually may have an insignificant or modest impact on graft failure, 39 collectively they could pose a heightened risk.
Our results demonstrate that pairing the recipient clusters with different donor groups leads to different post-transplant outcomes. The role of nonimmunologic donor-recipient pairing in kidney transplantation has been explored previously for age,40 -42 ethnicity and race,43,44 sex,45 -47 and size.42,45,48 -51 In addition, Bae et al 52 estimated post-kidney transplant survival for different donor-recipient risk combinations, ranging from 53.0% (KDPI = 100%, EPTS = 100) to 97.4% (KDPI = 28%, EPTS = 1). In this study, we observed graft failure rates ranging from 31.4% to 63.0% across all donor-recipient cluster combinations, with lower rates for favorable risk pairings and higher rates for high-risk pairings. This further emphasizes that there are significant differences in post-transplant survival among older adults when evaluating combined pairings of donors and recipients.
To our knowledge, our study is the first to evaluate post-transplant outcomes for different combinations of machine learning-generated donor and recipient phenotypes. Our approach aligns with the United Network for Organ Sharing’s continuous distribution framework, a holistic organ allocation strategy that prioritizes evaluating multiple attributes simultaneously over inflexible and sequential patient categorization. 53 The continuous distribution system, which was implemented for lung transplantation in March 2023 and is being developed for kidney transplantation, is projected to decrease waitlist deaths and improve equity in allocation. 54 Given that our unsupervised clustering model generated recipient clusters at differential risks of graft failure, such a strategy may be a novel way to estimate post-transplant survival and subsequently inform kidney allocation policy. While a risk stratification system limited to older individuals is unlikely to offer the most equitable solution, we believe our findings contribute valuable insights about phenotypes of older kidney transplant recipients that merit refinement in broader allocation strategies. However, efforts to incorporate unsupervised clustering into kidney allocation practices must be weighed against the need to ensure equitable distribution of organs based on factors beyond utility metrics alone.
This study has several strengths. We used a nationally representative database of kidney transplant recipients to generate the recipient clusters. We used 2 approaches to define donor risk, including the validated KDRI as well as novel donor clusters previously generated by our team using unsupervised clustering. Unlike earlier studies of unsupervised clustering to predict outcomes after kidney transplantation, which used donor, recipient, and peritransplant variables to derive clusters, our study is the first to develop a model based exclusively on recipient factors that would be available at the time of a kidney offer. We found that known risk factors emerge naturally through unsupervised clustering analysis, reinforcing existing evidence while also providing a quantitative framework. By subsequently looking at different combinations of donors and recipients, our goal was to simulate real-world allocation scenarios more authentically. This approach may help inform prognostication and clinical decision-making for older recipients undergoing kidney transplantation; by gaining insight into a recipient’s potential outcomes after receiving a particular donor kidney, we can tailor our management and proactively address anticipated challenges. For instance, recipients belonging to a high-risk cluster may benefit from more intensive cardiovascular monitoring, tighter glucose control, and more frequent follow-up.
This study has some limitations. Although our use of a large SRTR cohort provided robust data for cluster generation, we did not include an external validation cohort. In the absence of external validation, our results should be interpreted as exploratory and further research is needed to confirm the generalizability of these clusters in different populations. For example, other regions may use different allocation strategies (eg, Eurotransplant Senior Program) and our approach of combining donor and recipient clusters would be less applicable in those regions. In addition, the mean age of donors in our study was 44.6 years, further limiting the applicability of our results to countries with old-for-old allocation systems. From a clustering standpoint, the selection of 3 recipient clusters, while deemed optimal based on model performance metrics, may not fully capture the complex diversity within this patient population. Incorporating additional clusters could provide greater nuance but would need to be carefully balanced with clinical interpretability. National registry data also inherently lack information about factors that could influence post-transplant outcomes in older recipients, including frailty status, medication use and adherence, psychosocial and socioeconomic factors, and lifestyle behaviors. Furthermore, our findings should not be used to inform individual risk prediction nor be applied to recipients younger than 65 years of age.
Conclusions
In a national cohort of older kidney transplant recipients, an unsupervised machine learning clustering approach generated 3 clinically distinct recipient phenotypes at differential risks of graft failure. Unsupervised clustering offers an objective framework for stratifying recipients which may mitigate biases that can arise from more traditional risk assessments. The phenotypes may aid in complementing allocation decisions, providing insights into prognosis, and optimizing post-transplant care for older kidney transplant recipients.
Supplemental Material
sj-docx-1-cjk-10.1177_20543581251322576 – Supplemental material for Using Unsupervised Clustering to Characterize Phenotypes Among Older Kidney Transplant Recipients: A Cohort Study
Supplemental material, sj-docx-1-cjk-10.1177_20543581251322576 for Using Unsupervised Clustering to Characterize Phenotypes Among Older Kidney Transplant Recipients: A Cohort Study by Sareen Singh, Syed Sibte Raza Abidi, Syed Asil Ali Naqvi, Amanda J. Vinson, Thomas A. A. Skinner, George Worthen, Samina Abidi, Kenneth A. West and Karthik K. Tennankore in Canadian Journal of Kidney Health and Disease
Footnotes
Acknowledgements
The data reported here have been supplied by the Hennepin Healthcare Research Institute (HHRI) as the contractor for the SRTR. The interpretation and reporting of these data are the responsibility of the author(s) and in no way should be seen as an official policy of or interpretation by the SRTR or the US Government. Portions of this work were presented at the Canadian Urological Association 79th Annual Meeting in Victoria, Canada (June 29 to July 1, 2024).
Abbreviations
aHR, adjusted hazard ratio; aOR, adjusted odds ratio; BMI, body mass index; CAD, coronary artery disease; CI, confidence interval; DGF, delayed graft function; EPTS, estimated post-transplant survival; HHRI, Hennepin Healthcare Research Institute; HLA, human leukocyte antigen; HR, hazard ratio; HRSA, Health Resources and Services Administration; IQR, interquartile range; KDPI, Kidney Donor Profile Index; KDRI, Kidney Donor Risk Index; OPTN, Organ Procurement and Transplantation Network; OR, odds ratio; PRA, panel reactive antibody; SD, standard deviation; SRTR, Scientific Registry of Transplant Recipients.
Declaration of Conflicting Interests
The author(s) declared the following potential conflicts of interest with respect to the research, authorship, and/or publication of this article: KKT has conducted advisory board groups and helped develop CME initiatives for Bayer, Otsuka, Vifor Pharmaceuticals, and Virtual Hallway, with no conflicts related to the current study. AJV has conducted advisory board groups for Paladin Labs Inc and Takeda Pharmaceuticals, with no conflicts related to the current study. All the other authors have no conflicts of interest to disclose.
Funding
The author(s) disclosed receipt of the following financial support for the research, authorship, and/or publication of this article: SS was supported by the Dr. Tom Marrie Research in Medicine Summer Studentship from the Department of Medicine at Dalhousie University. The funders had no role in study design; in the collection, analysis and interpretation of data; in the writing of the report; or in the decision to submit the article for publication.
Ethics Approval
This study was approved by the Nova Scotia Health Research Ethics Board (#1027260).
Consent to Participate
Not applicable.
Consent for Publication
Not applicable.
Data Sharing
The data that support the findings of this study are available from the SRTR. Restrictions apply to the availability of these data, which were used under license for this study. The source code and model parameters used for unsupervised cluster generation will be shared on reasonable request to the corresponding author.
Supplemental Material
Supplemental material for this article is available online.
References
Supplementary Material
Please find the following supplemental material available below.
For Open Access articles published under a Creative Commons License, all supplemental material carries the same license as the article it is associated with.
For non-Open Access articles published, all supplemental material carries a non-exclusive license, and permission requests for re-use of supplemental material or any part of supplemental material shall be sent directly to the copyright owner as specified in the copyright notice associated with the article.