
Abstract
In this study, we aimed to identify transplantation tolerance (TOL)-related gene signature and use it to predict the different types of renal allograft rejection performances in kidney transplantation. Gene expression data were obtained from the Gene Expression Omnibus (GEO) database, differently expressed genes (DEGs) were performed, and the gene ontology (GO) function enrichment and Kyoto Encyclopedia of Genes and Genomes (KEGG) pathway enrichment analysis were also conducted. The machine learning methods were combined to analyze the feature TOL-related genes and verify their predictive performance. Afterward, the gene expression levels and predictive performances of TOL-related genes were conducted in the context of acute rejection (AR), chronic rejection (CR), and graft loss through heatmap plots and the receiver operating characteristic (ROC) curves, and their respective immune infiltration results were also performed. Furthermore, the TOL-related gene signature for graft survival was conducted to discover gene immune cell enrichment. A total of 25 TOL-related DEGs were founded, and the GO and KEGG results indicated that DEGs mainly enriched in B cell-related functions and pathways. 7 TOL-related gene signature was constructed and performed delightedly in TOL groups and different types of allograft rejection. The immune infiltration analysis suggested that gene signature was correlated with different types of immune cells. The Kaplan–Meier (KM) survival analysis demonstrated that BLNK and MZB1 were the prognostic TOL-related genes. Our study proposed a novel gene signature that may influence TOL in kidney transplantation, providing possible guidance for immunosuppressive therapy in kidney transplant patients.
Introduction
Transplant Rejection
Kidney transplantation is currently the most successful therapy method for end-stage renal disease1,2, and its effect is significantly better than chronic dialysis 3 . At present, with the continuous advancement of kidney transplantation technology, the renal allograft survival and overall survival of kidney transplant recipients have been significantly improved compared with before 4 . However, the renal allograft rejection is still the main reason for the failure of kidney transplantation, including hyperacute rejection, acute rejection (AR), and chronic rejection (CR)2,5.
Immunosuppressive therapy is the mainstay of treatment for kidney transplant rejection and reduces the risk of graft loss and death6,7. However, not all kidney transplant patients require long-term immunosuppression. Transplantation tolerance (TOL) is defined as a patient who maintains stable renal function without immunosuppressive therapy, and benefits from the absence of immunosuppression8,9. Hence, it is essential to develop a biomarker for predicting TOL in kidney transplantation for minimal dose immunosuppressive therapy.
Implication of Genes on Rejection
The expression of CD28 was upregulation in rejected group after kidney transplantation 10 . Compared with stable function (STA) group, the granzyme B level was significantly increased in CR group 11 and AR group 12 , involving in the destruction of tubular epithelial cells 13 . Overexpressed CD20 mRNA can be found in the TOL group, distinguished from the healthy volunteer (HV) group and STA group 14 . It means that we could facilitate individual management of kidney transplant patients and minimize modifiable risks by developing a gene signature.
The Currently Published Literature on These Prognostic Genes
High number of CD28null CD8 T cells may contribute to a lower risk for late rejection and graft loss after kidney transplantation 15 . Serine protease inhibitor 6 prevented granzyme B-mediated kidney rejection injury and prolonged allograft survival 16 . Greater infiltration degree of CD20-positive B cell could result in better renal allograft survival.
Superiority of Machine Learning Methods Over Conventional Methods
Machine learning (ML) learns from the previous data and builds a pattern to predict the future data 17 . The greatest advantage of ML is that it can detect and identify the pattern from a large, complex data set just like cancer studies 18 . The least absolute shrinkage and selection operator (LASSO) and support vector machine (SVM) learning are two types of ML method that is superior to other methods in recognizing small pattern changes in complex data 19 .
In this study, we tried to develop and valid prognostic genes associated with TOL after renal transplantation by LASSO regression analysis and SVM algorithm. Furthermore, the similarities and differences in these two groups in the enrichment of immune cells in immune infiltration analysis were conducted, so as to provide a reasonable explanation for the causes of TOL patients in clinical practice, guiding on the dosage of immunosuppressants after kidney transplantation.
Materials and Methods
Data Collection and Preprocessing
The microarray data of kidney transplantation were downloaded from Gene Expression Omnibus (GEO) database (www.ncbi.nlm.nih.gov/geo/). GSE49198 was a metadata GEO data set, containing GSE47755, GSE47683, GSE22707, GSE22229, and GSE14655, 5 TOL-related normalized data. HVs were normal healthy people without kidney-related diseases, and STA recipients were kidney transplant patients with stable renal function after receiving standard immunosuppression. The first four data sets were chosen as the training set and the last data set was the testing set. The AR after kidney transplantation data were provided by GSE15296 and GSE131179 data sets, and they were merged after removing the batch effects by the “sva” package in R software. The CR after kidney transplantation data were also provided by GSE49198. The long-term graft survival after kidney transplantation data were provided by GSE2137, which contained gene expression data and clinical data of graft survival status.
Differently Expressed Gene Extraction
To verify differently expressed genes (DEGs) related to TOL, we used the “limma” package in R software to analyze the DEGs between HV and TOL, HV and STA, and TOL and STA, respectively. Venn diagram was used to extract TOL-related genes with differential expression from healthy people. To explore whether STA samples can be distinguished from TOL samples, “ggplot2” R package was utilized to finish principal component analysis (PCA) analysis. |log2 fold change| ≥ 1 and adjusted P < 0.05 were considered to be statistical significant.
Gene Ontology Function and KEGG Pathway Enrichment
The common DEGs in the intersection were extracted, and the gene ontology (GO) function enrichment and Kyoto Encyclopedia of Genes and Genomes (KEGG) pathway enrichment analysis were performed using “clusterProfile” 20 in R software, and the “enrichplot” package was used to visualize the enrichment analysis results. P ≤ 0.05 was considered statistically significant.
Gene Set Enrichment Analysis
To identify the similarities and differences of pathway enrichment in TOL and STA group, respectively, gene set enrichment analysis (GSEA) was conducted, with P ≤ 0.05 as statistically significant.
Prognostic-Related Gene Signature Construction
To identify prognostic-related DEGs, two ML methods were used for prediction. The LASSO is a regression analysis algorithm. “glmnet” package in R was used to perform LASSO analysis. SVM is a type of ML with high accuracy, and the recursive feature elimination (RFE) could select the most essential features according to the weight of classification, which is most relevant to the construction of gene signature 21 . These two ML methods were respectively performed to predict prognostic gene signature. The intersection gene signature would be validated by the receiver operating characteristic (ROC) curve using the “pROC” package, and the area under the ROC curve (AUC) value was used to verify the diagnostic validity.
Immune Infiltration Analysis
CIBERSORT (https://cibersortx.stanford.edu/) was a calculation algorithm used to quantify the relationship between gene expressions and the 22 types of immune cell abundance 22 . The infiltration relationship between the 22 types of immune cells is displayed with the “corrplot” package, and the differences of immune infiltration of each immune cell in TOL and STA were visualized with the “vioplot” package.
Prediction of Gene Signature in Renal Allograft Rejection
To further verify the gene expression level and predictive performance of gene signature in AR, CR, and graft loss after kidney transplantation, heat map plots and ROC curves were performed on these three cohorts, respectively. The “heatmap” package in R was used to visualize heatmap plots and the “pROC” package was used to perform ROC curves. The immune infiltration analysis was also performed in these three cohorts to detect enrichment of the immune cells.
Validation of Gene Signature for Graft Survival
The Kaplan–Meier (KM) survival analysis was used to evaluate the graft survival status of gene signature. GSE21374 data set was applied, which included 51 graft loss and 231 graft survival cases after kidney transplantation. P ≤ 0.05 was considered statistically significant.
Correlation Between Graft Gene Expression and Infiltrating Immune Cells
To further discover the correlation between graft survival gene signature and immune cell infiltration, R software was utilized to perform lollipop plots in the TOL group, AR group, CR group, and graft loss group after kidney transplantation.
Statistical Analysis
All data are processed by R software (version 4.1.3), and the value of P < 0.05 was considered statistically significant.
Results
Identification and Verification of DEGs
GSE47755, GSE47683, GSE22707, and GSE22229 data sets in the metadata GSE49198 were identified as the training set, which contained 34 HV samples, 64 TOL samples, and 241 STA samples. GSE14655 data set in the metadata GSE49198 was identified as the testing set, which contained 28 HV samples, 32 TOL samples, and 70 STA samples. The “limma” package was used to analyze the DEGs of the three data cohorts in the training set. Compared with HV, TOL had a total of 71 DEGs, including 28 upregulated DEGs and 43 downregulated DEGs, while STA had a total of 138 DEGs, including 37 upregulated DEGs and 101 downregulated DEGs. Compared with the TOL and STA cohorts, there were a total of 76 DEGs, including 17 upregulated DEGs and 59 downregulated DEGs. The Venn diagram was used to obtain the intersection DEGs, and the result showed that the HV–STA and TOL–STA cohorts shared 19 DEGs, and the HV–TOL and TOL–STA cohorts shared 7 DEGs (Fig. 1A). To further identify the relationship between the upregulation and downregulation of intersecting DEGs in different data sets, the upregulation and downregulation DEGs in the HV–TOL and HV–STA cohorts were compared with the upregulation and downregulation DEGs in the TOL–STA cohort to obtain the intersection DEGs by Venn diagram (Fig. 1B, C). Created with first principal component (PC1) and the second principal component (PC2), PCA plot has revealed that there is a clear distinction between the STA and TOL groups (Fig. 1D).
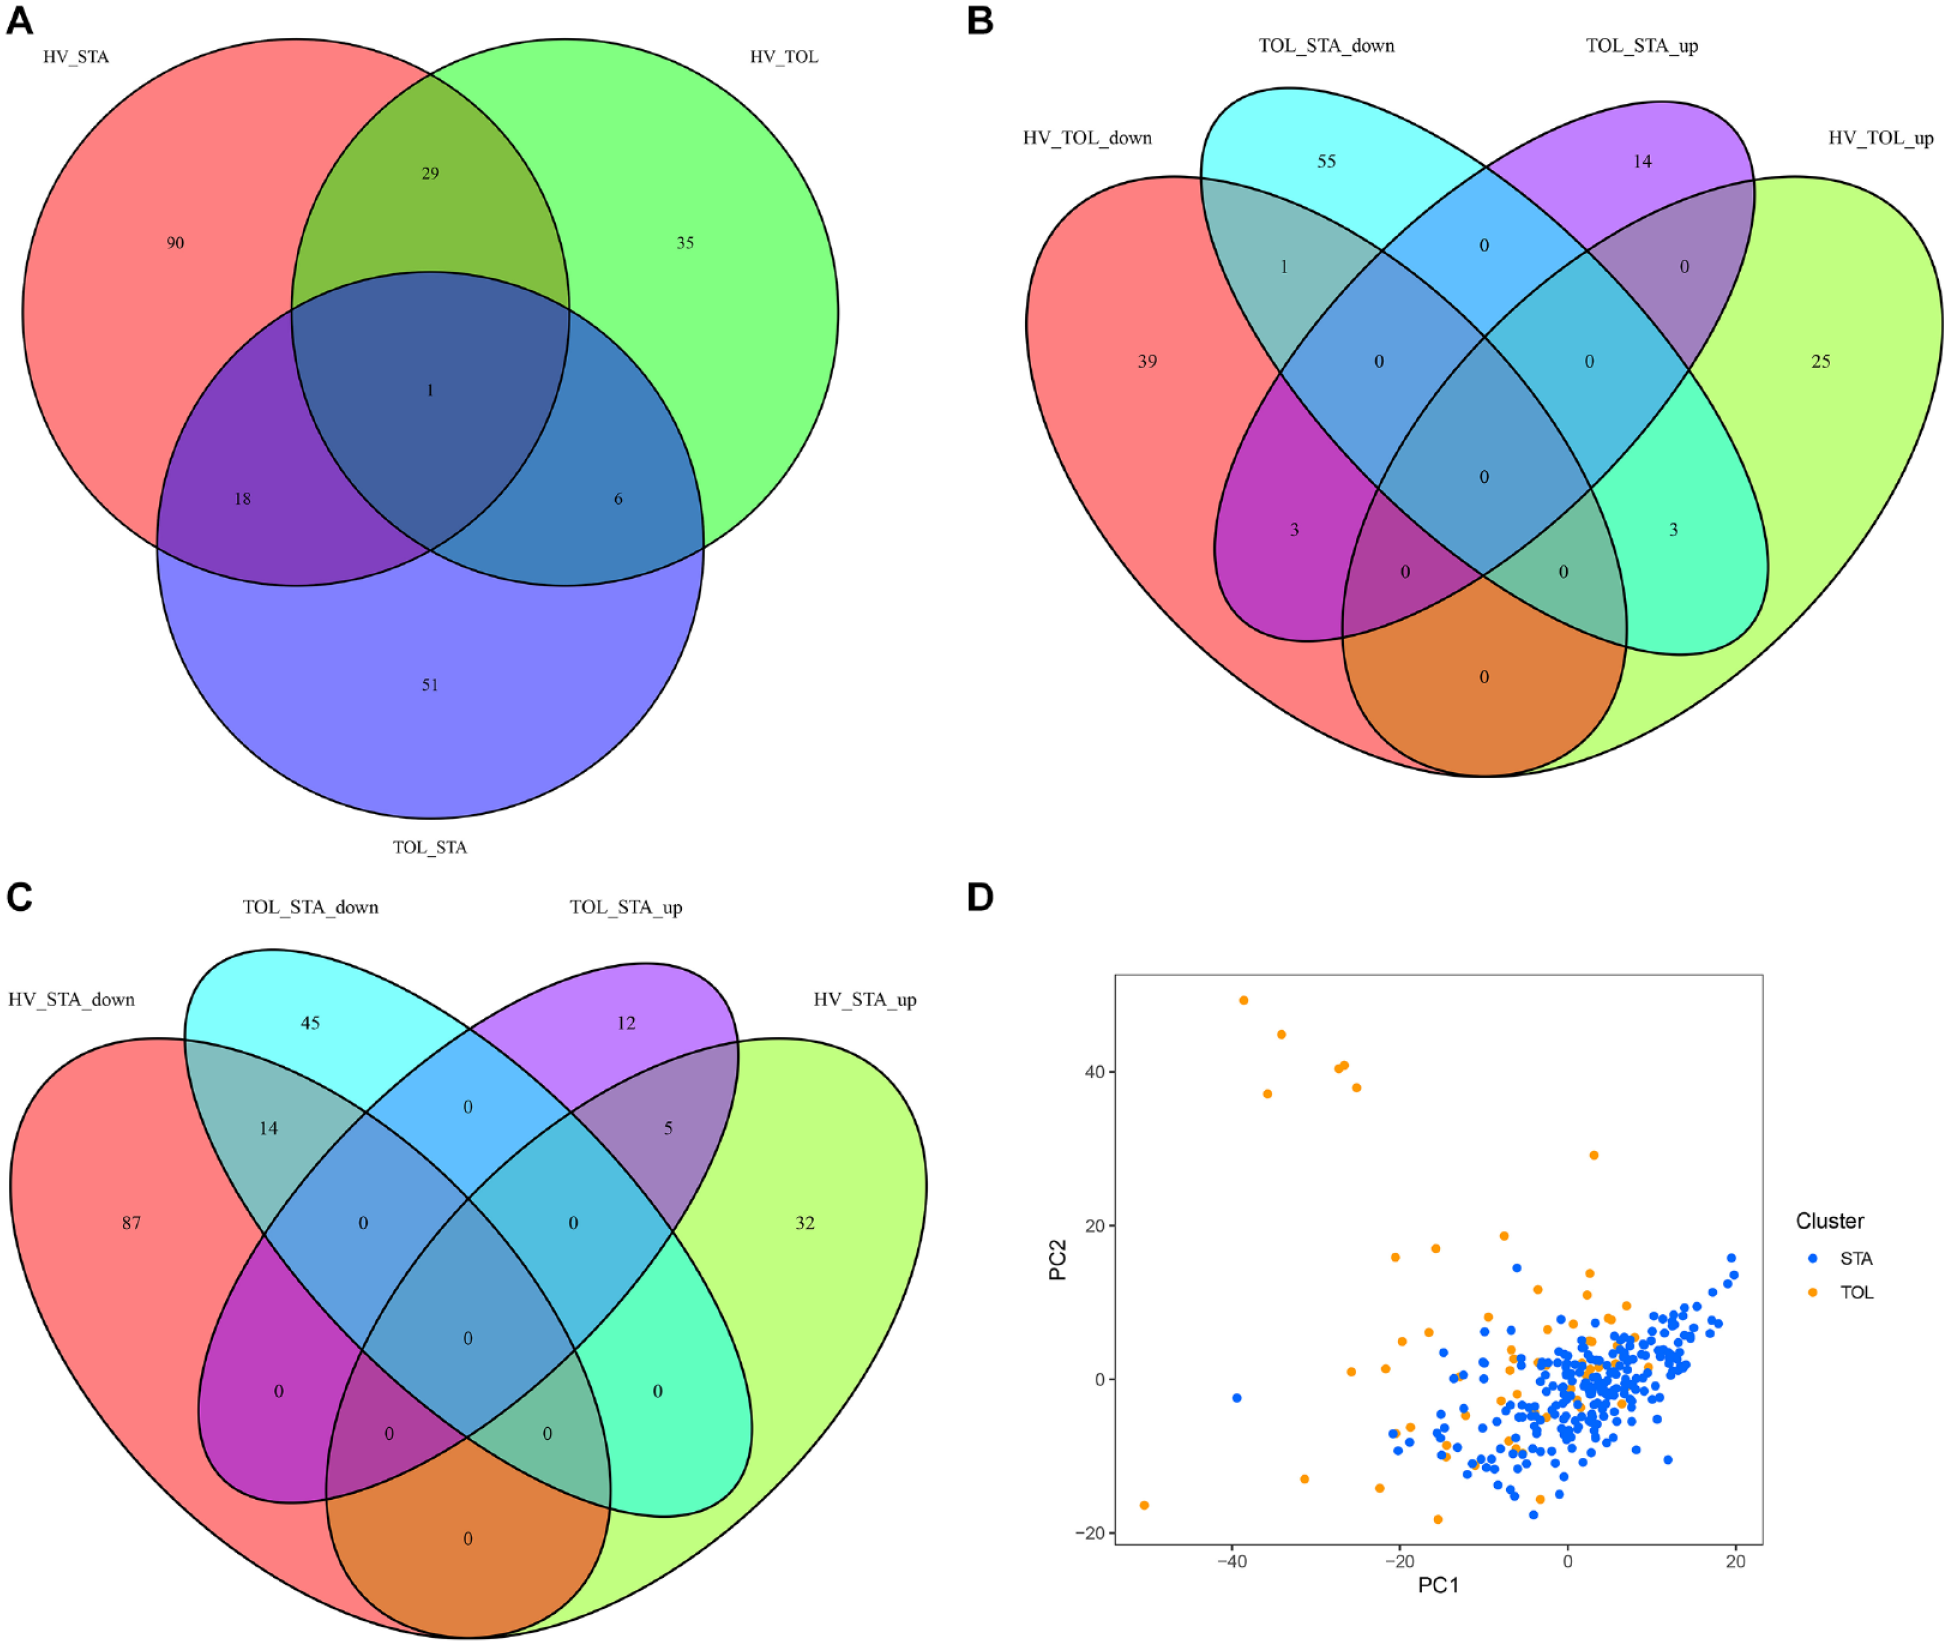
The Venn diagram of identified DEGs for intersections between different samples. (A) The intersection DEGs among HV, TOL, and STA patients. (B) The intersection DEGs in the TOL–STA and HV–TOL cohorts. (C) The intersection DEGs in the TOL–STA and HV–STA cohorts. (D) PCA plot for the STA and TOL groups. DEGs: differently expressed genes; HV: healthy volunteer; TOL: transplantation tolerance; STA: stable function; PCA: principal component analysis; PC1: first principal component; PC2: second principal component.
Gene Function Analysis
A total of 25 TOL-related DEGs in the kidney transplantation status were subjected to perform GO function and KEGG pathway enrichment analysis (Fig. 2A, B). The GO function enrichment result showed that it mainly converged on B cell-related molecular functions, while the KEGG pathway enrichment result showed that it mainly converges on the B cell receptor signaling pathway and related immune pathways. The results of GSEA showed that the TOL cohort was mainly enriched on the glycolysis and peroxidase signaling pathways (Fig. 2C), and the STA cohort was mainly enriched on the adherens junction and other signaling pathways (Fig. 2D).
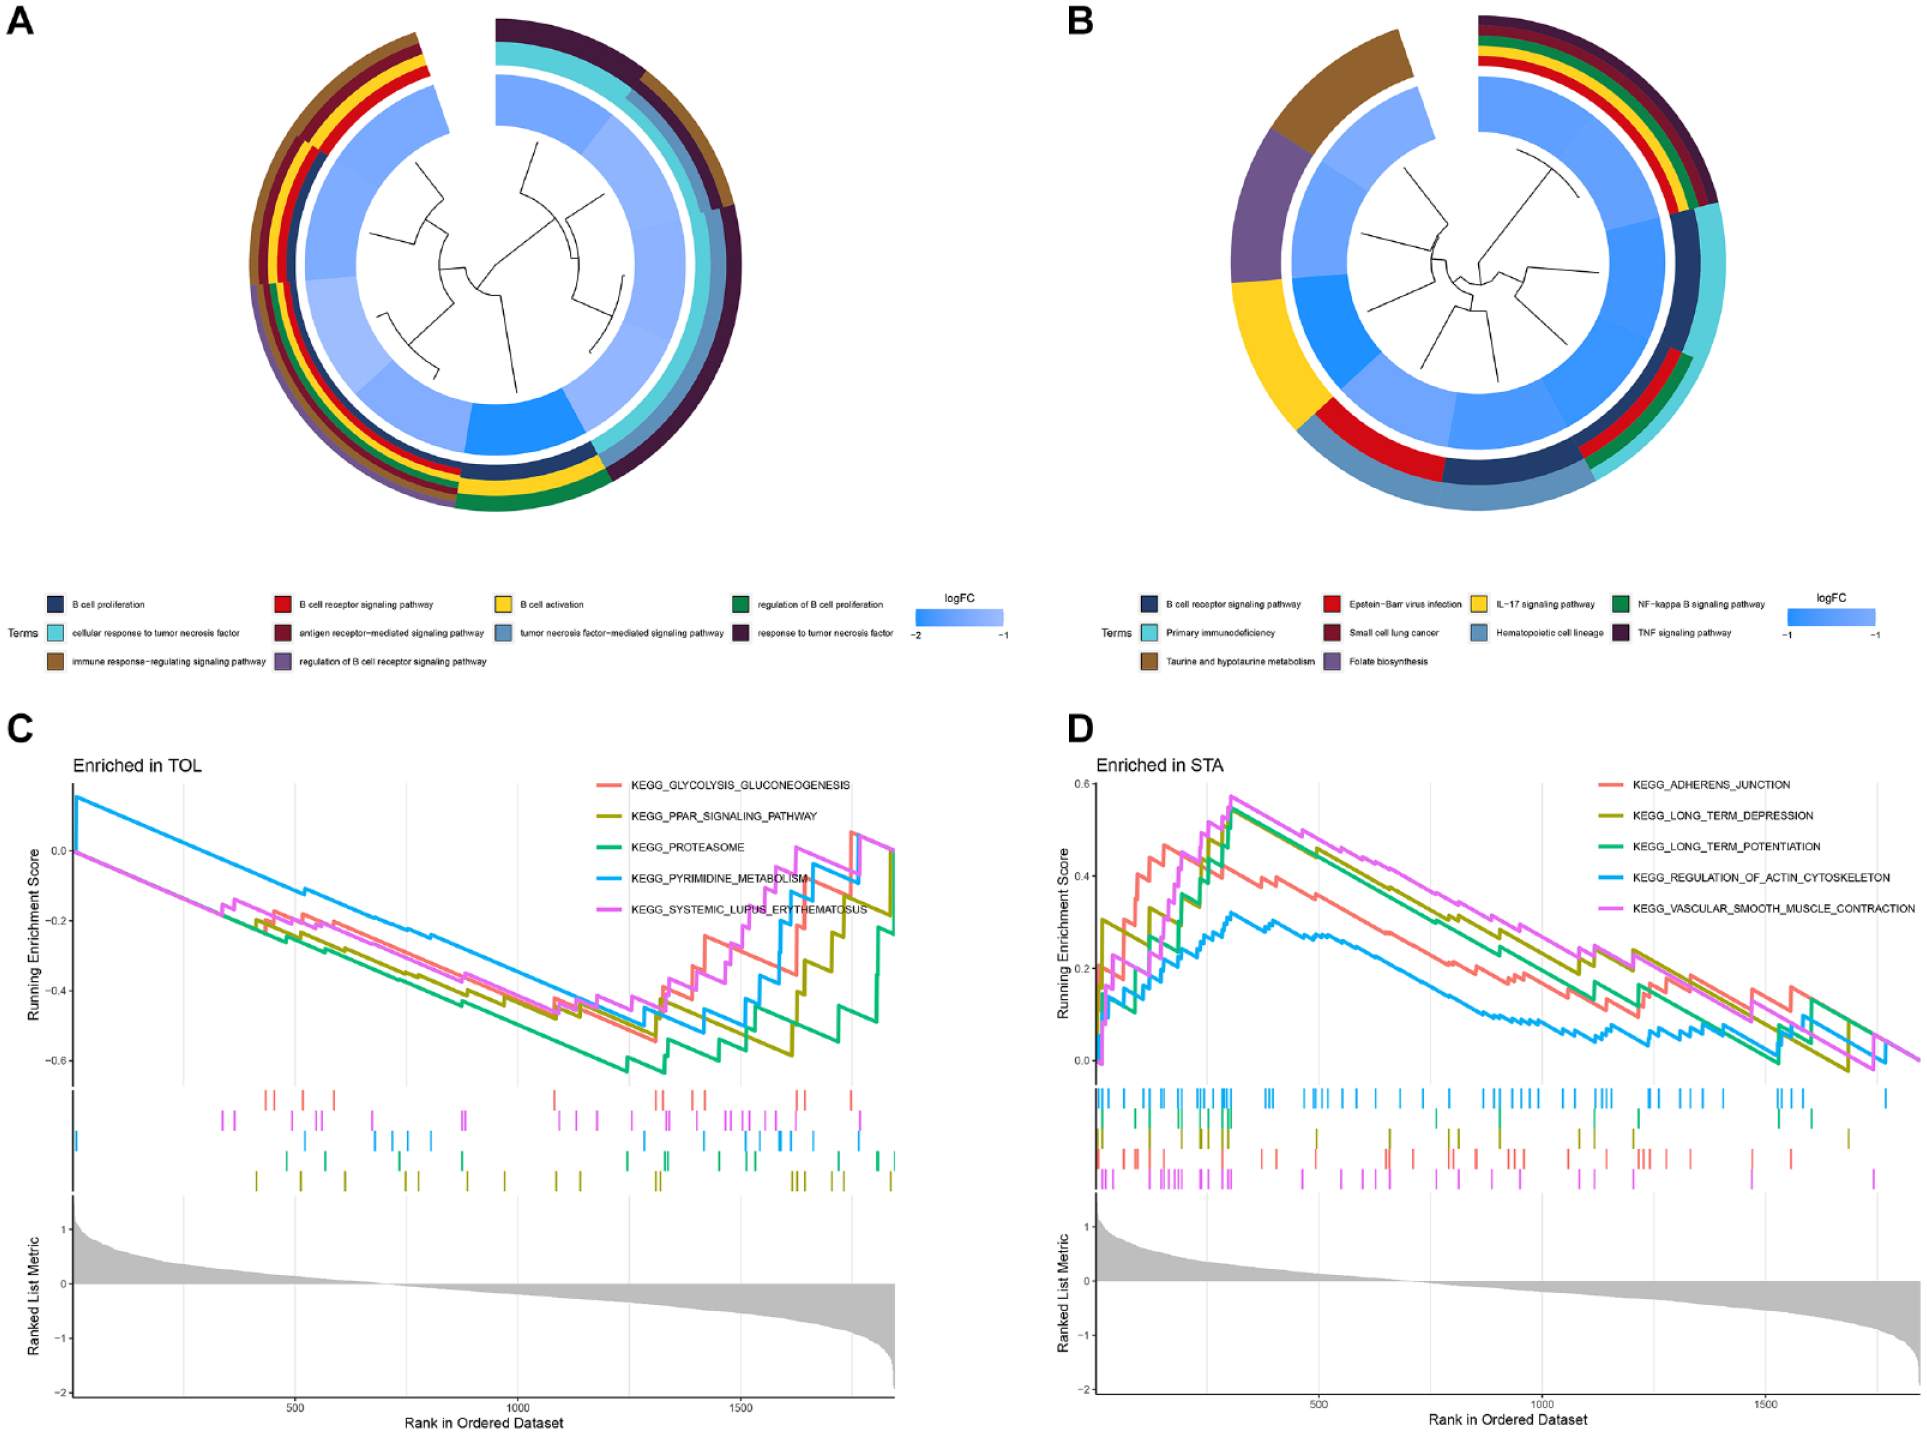
The gene functional enrichment and GSEA enrichment plots. (A) The GO function enrichment cluster plot. (B) The KEGG pathway enrichment cluster plot. (C) The GSEA enrichment plot in the TOL cohort. (D) The GSEA enrichment plot in the STA cohort. GSEA: gene set enrichment analysis; GO: gene ontology; KEGG: Kyoto Encyclopedia of Genes and Genomes; TOL: transplantation tolerance; STA: stable function.
The Construction and Validation of a 7 TOL-Related Gene Signature
Based on the LASSO algorithm (α = 1), 12 DEGs were selected (Fig. 3A, B), while based on the SVM-RFE algorithm, 8 DEGs were selected (Fig. 3C). Seven common genes (MZB1, TCL1A, IL17RB, CD79A, YARS, CD22, and BLNK) were extracted after taking the intersection by the Venn diagram (Fig. 3D). The heatmap result of the training set showed that seven-gene signature was significantly upregulated in the TOL set (Fig. 4A), and Fig. 4B showed that all seven genes had satisfactory predictive performance (the AUC was 0.84 for MZB1, the AUC was 0.82 for TCL1A, the AUC was 0.83 for IL17RB, the AUC was 0.79 for CD79A, the AUC was 0.76 for YARS, the AUC was 0.78 for CD22, and the AUC was 0.74 for BLNK). The heatmap result in the testing set also showed that the seven-gene signature was significantly upregulated in the TOL set (Fig. 4C). Fig. 4D showed that the remaining genes except YARS (the AUC was 0.51) and CD79A (the AUC was 0.54) had satisfactory predictive performance (the AUC was 0.79 for MZB1, the AUC was 0.91 for TCL1A, the AUC was 0.60 for IL17RB, the AUC was 0.81 for CD22, and the AUC was 0.81 for BLNK). The CIBERSORT algorithm was performed to assess the immune cell infiltration in the overall TOL data set. Twenty-two types of immune cell infiltration in the TOL data set are shown in Fig. 5A. The result in Fig. 5B indicated that B cells native, B cells memory, plasma cells, T cells gamma delta, and natural killer (NK) cells activated were greater in the TOL group than in the STA group (P < 0.05). However, at the same time, T cells CD8 and monocytes were greater in the STA group than in the TOL group (P < 0.05).

The LASSO and SVM-RFE analysis results. (A) The 10-time cross-validation method was applied in the LASSO model. (B) Screened out the feature gene signature. (C) The SVM-RFE method to identify the feature gene signature. (D) The intersection of the screened gene signature by LASSO and SVM-RFE analysis. LASSO: the least absolute shrinkage and selection operator; SVM: support vector machine; RFE: recursive feature elimination; RMSE: root mean square error.

The heatmap and ROC curves in TOL training and testing set. (A) The heatmap plot of the TOL training set. (B) The ROC curve for predicting the TOL-related gene signature performance in TOL training set. (C) The heatmap plot of the TOL testing set. (D) The ROC curve for predicting the TOL-related gene signature performance in TOL testing set. ROC: receiver operating characteristic; TOL: transplantation tolerance.
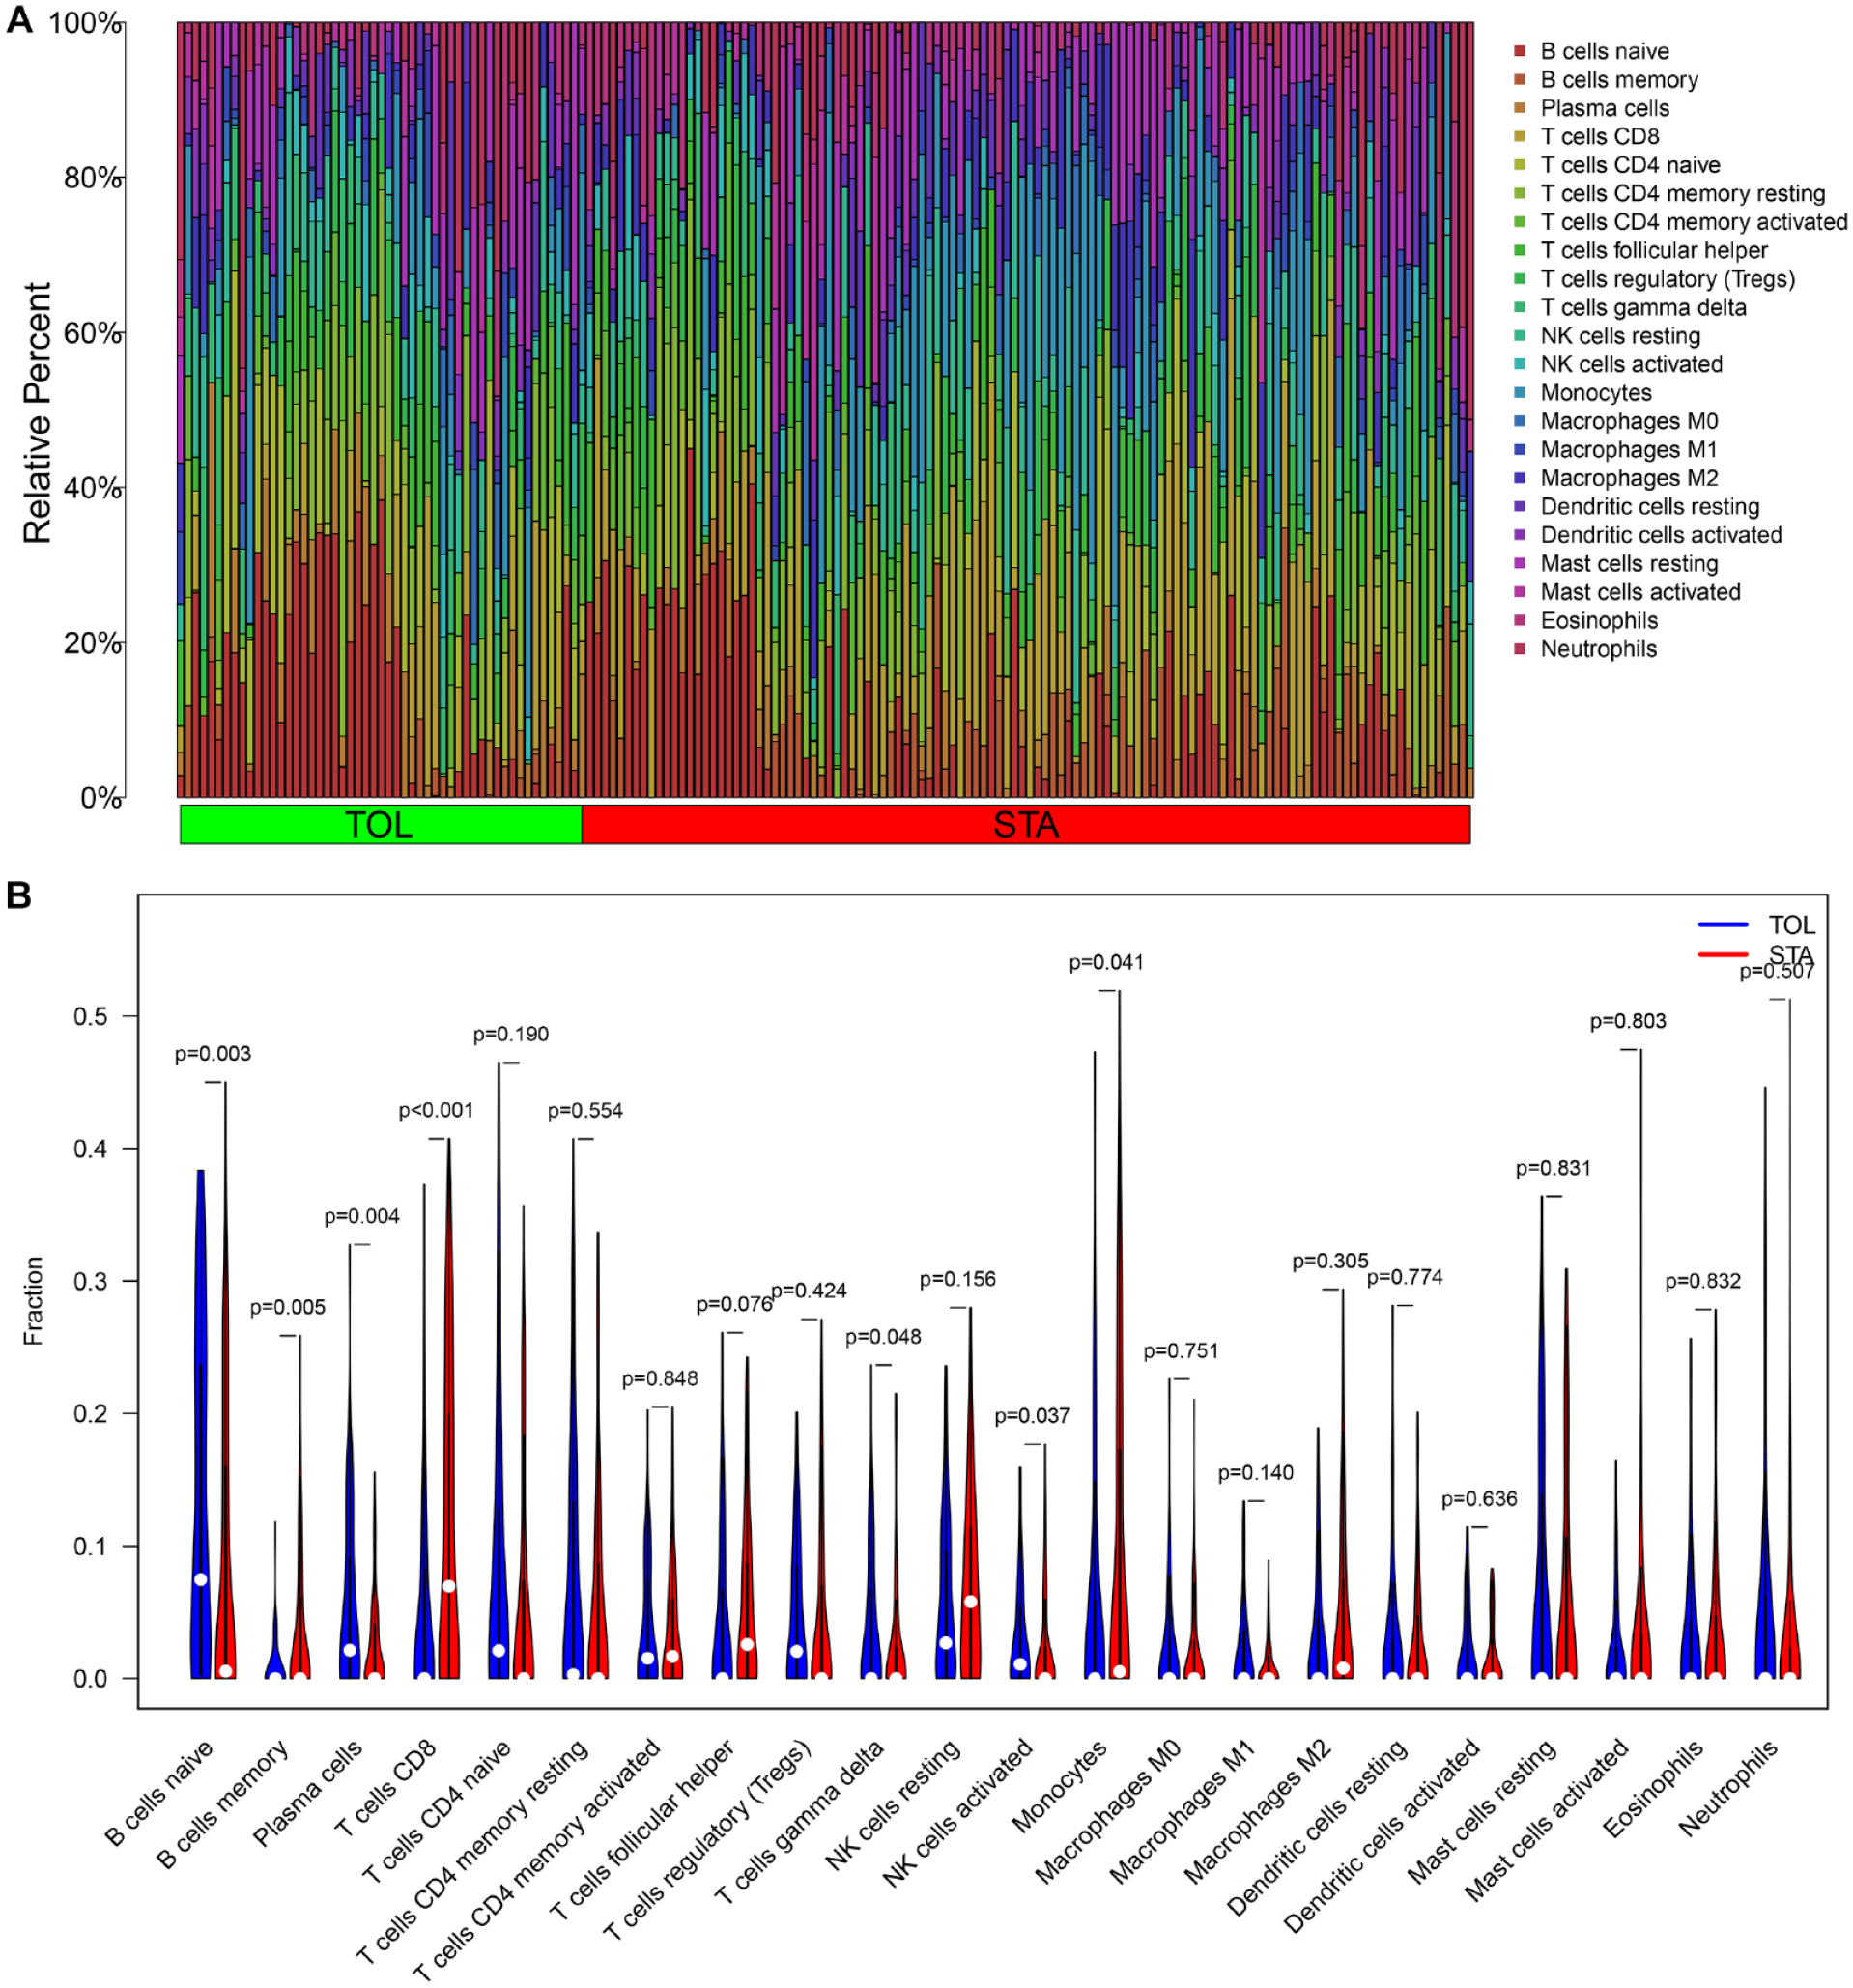
Immune infiltration result in the TOL group. (A) The bar plot of the enriched immune cells in TOL and STA samples. (B) The violin plot of the enriched immune cells in TOL and STA samples. TOL: transplantation tolerance; STA: stable function; NK: natural killer.
Diagnostic of TOL-Related Gene Signature in Graft Rejection
The heatmap plots and ROC curves were used to verify the gene expression level and prediction performance of the TOL-related gene signature. The results showed that in AR in kidney transplantation, there was little difference in gene expression (Fig. 6A), and the AUC of the ROC curves showed that except for MZB1 (the AUC was 0.70), the prediction performance of other genes was not ideal (the AUC was 0.55 for TCL1A, the AUC was 0.54 for IL17RB, the AUC was 0.591 for CD79A, the AUC was 0.52 for YARS, the AUC was 0.61 for CD22, and the AUC was 0.54 for BLNK). However, the TOL-related gene signature was upregulated in TOL patients than in CR patients (Fig. 6C), and the ROC curve results showed that the seven-gene signature had satisfactory predictive performance (the AUC was 0.79 for MZB1, the AUC was 0.80 for TCL1A, the AUC was 0.61 for IL17RB, the AUC was 0.65 for CD79A, the AUC was 0.61 for YARS, the AUC was 0.70 for CD22, and the AUC was 0.69 for BLNK) (Fig. 6D). Fig. 6E showed that seven genes were upregulated in graft loss patients but the ROC curves indicated that all genes performed disappointed in diagnostic prediction (the AUC was 0.60 for MZB1, the AUC was 0.49 for TCL1A, the AUC was 0.55 for IL17RB, the AUC was 0.51 for CD79A, the AUC was 0.58 for YARS, the AUC was 0.58 for CD22, and the AUC was 0.61 for BLNK) (Fig. 6F).
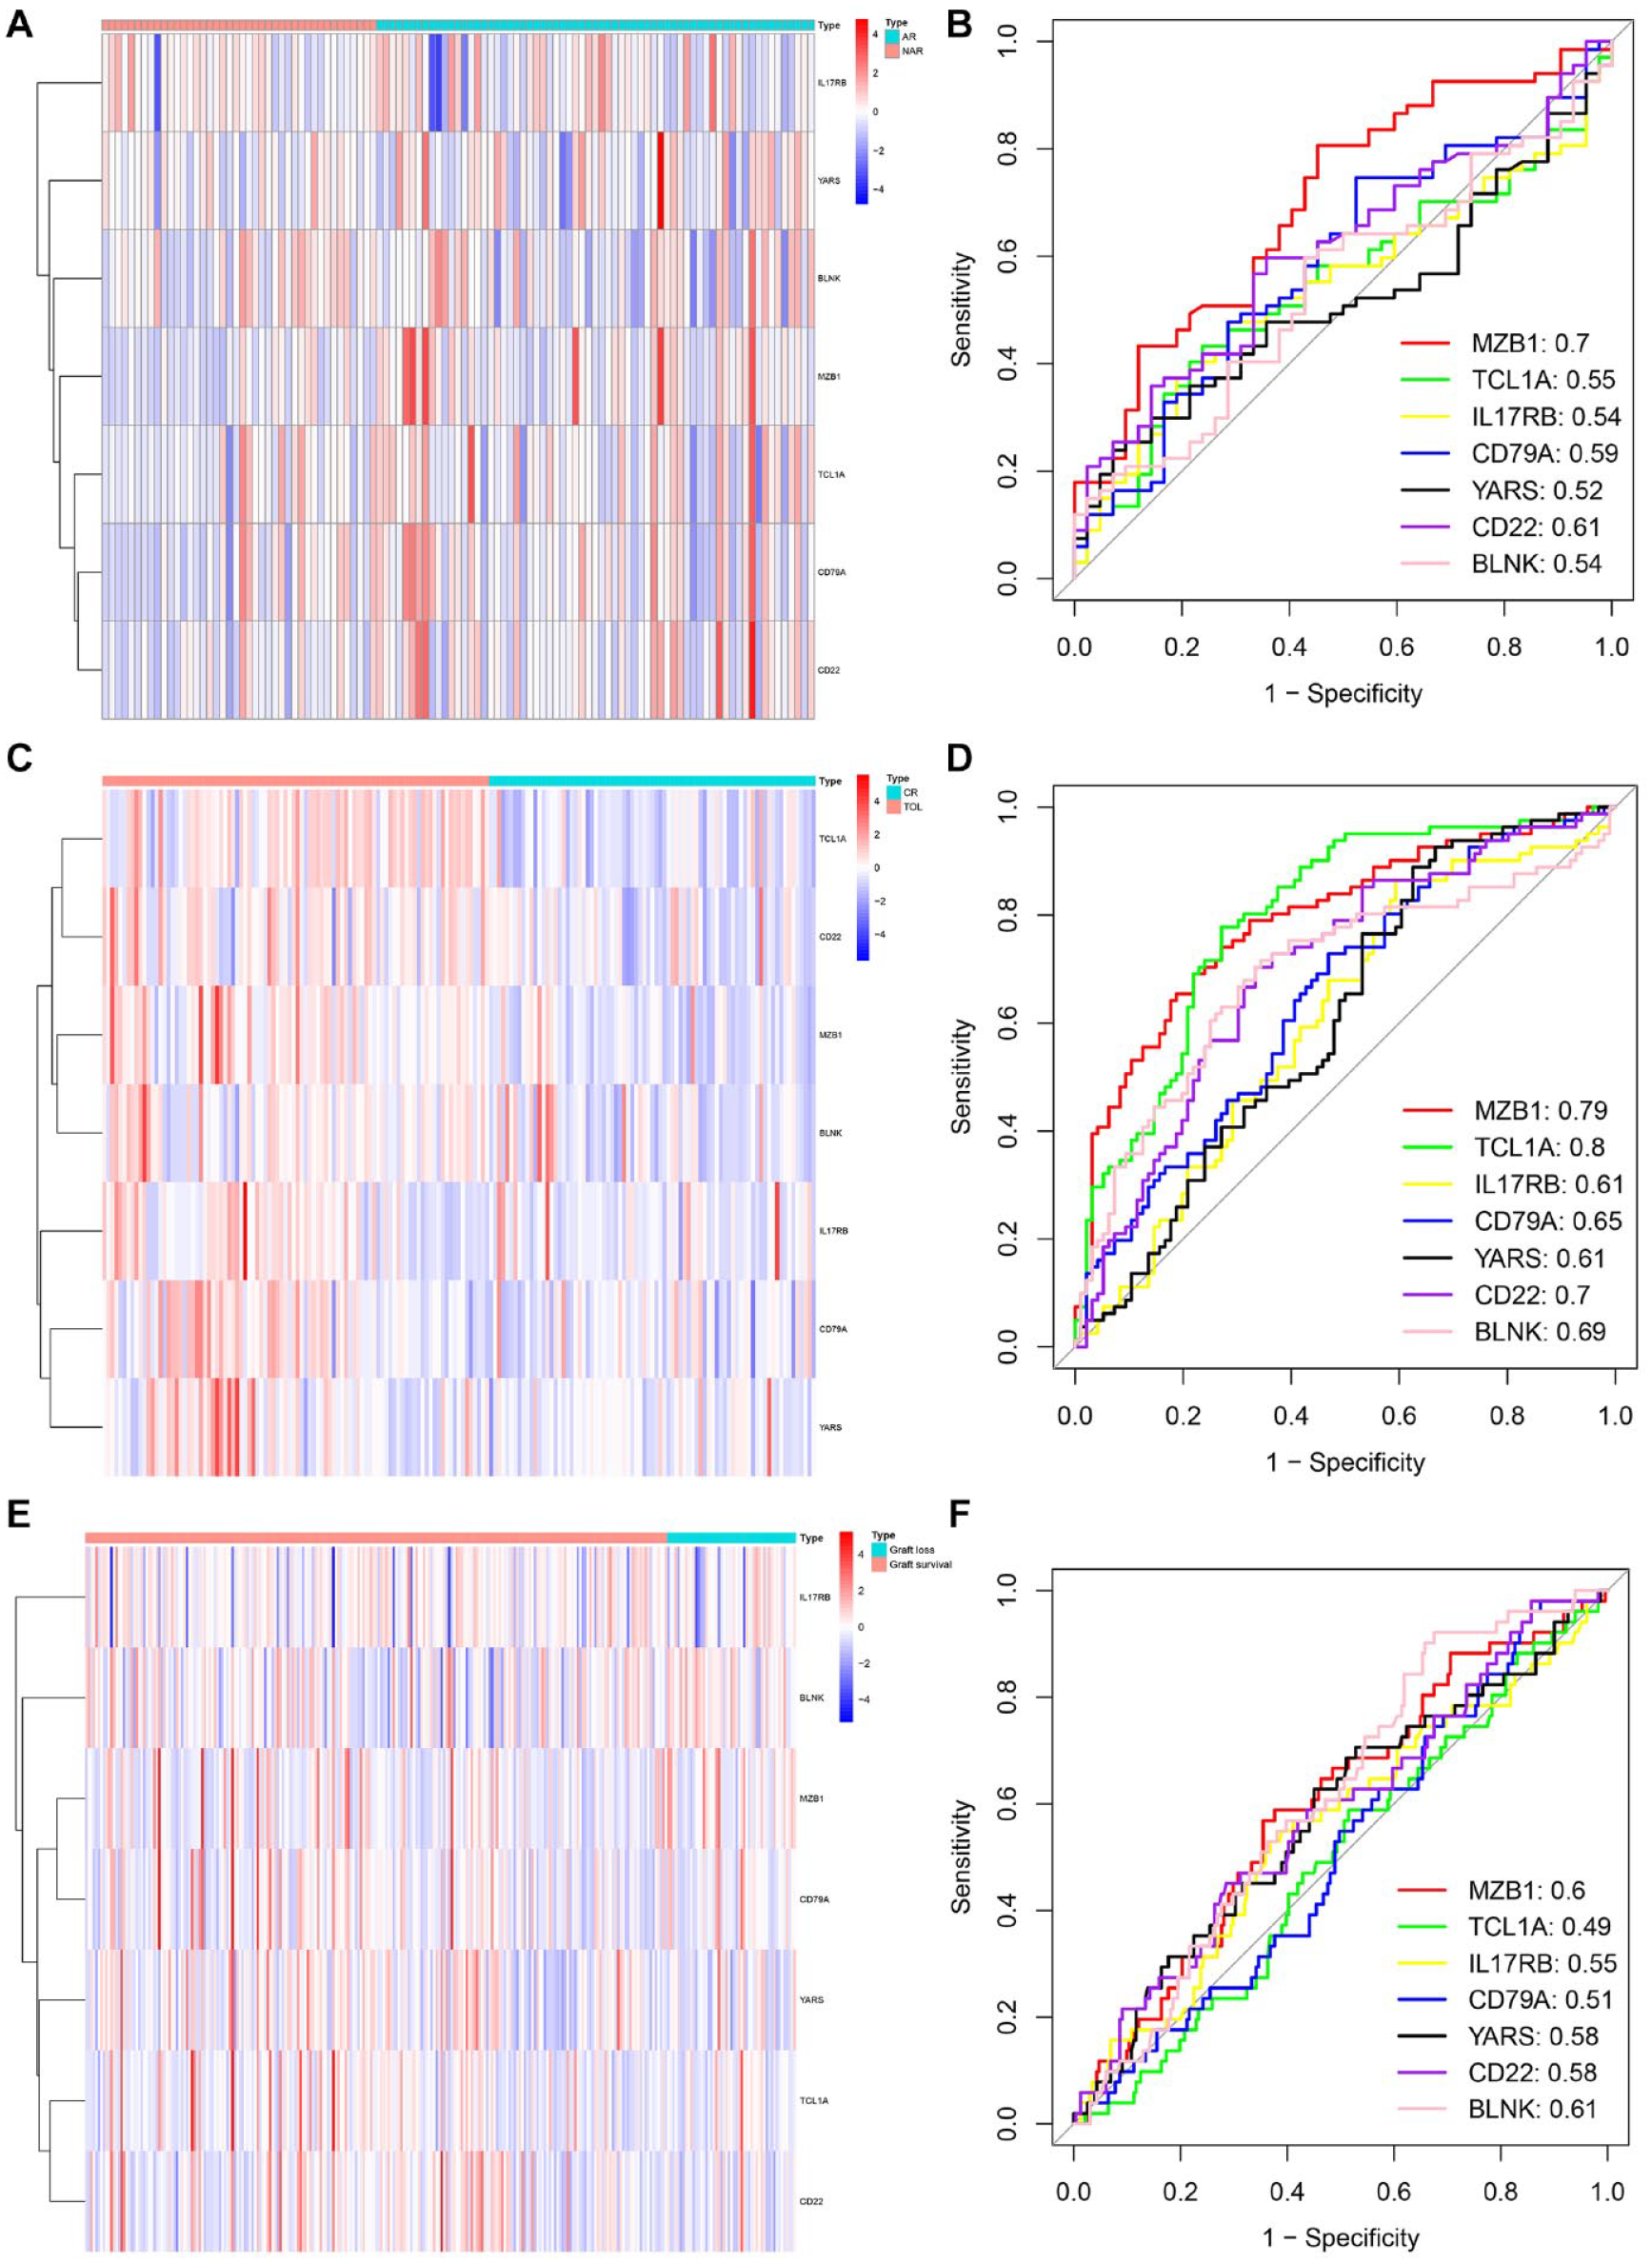
The heatmap and ROC curves in the AR, CR, and graft loss groups. (A) The heatmap plot of the AR group. (B) The ROC curve for predicting the TOL-related gene signature performance in the AR group. (C) The heatmap plot of the CR group. (D) The ROC curve for predicting the TOL-related gene signature performance in the CR group. (E) The heatmap plot of the graft loss group. (F) The ROC curve for predicting the TOL-related gene signature performance in the graft loss group. ROC: receiver operating characteristic; AR: acute rejection; CR: chronic rejection; TOL: transplantation tolerance.
Performance of the Immune Cell Infiltration
The immune infiltration results were also conducted to analyze the immune cell enrichment. Twenty-two types of immune cell enrichment results in the AR group, CR group, and graft loss group were shown in Fig. 7A, C, and E, respectively. The AR patients had a significantly higher relative percentage of plasma cells, T cells CD8, T cells CD4 memory active, and T cells follicular helper, and the non-acute rejection (NAR) patients had a significantly higher relative percentage of NK cells resting, monocytes, mast cells resting, and neutrophils (Fig. 7B). The CR patients had a significantly higher relative percentage of B cells memory, T cells CD8, monocytes, macrophages M1, dendritic cells resting, and mast cells resting, and the TOL patients had a significantly higher relative percentage of B cells naive and mast cells activated (Fig. 7D). The graft loss patients had a significantly higher relative percentage of monocytes and mast cells resting, and the graft survival patients had a significantly higher relative percentage of macrophages M0 (Fig. 7F).

Immune infiltration result in the AR, CR, and graft loss groups. (A) The bar plot of the enriched immune cells in the NAR and AR samples. (B) The violin plot of the enriched immune cells in the NAR and AR samples. (C) The bar plot of the enriched immune cells in the TOL and CR samples. (D) The violin plot of the enriched immune cells in the TOL and CR samples. (E) The bar plot of the enriched immune cells in the graft survival and graft loss samples. (F) The violin plot of the enriched immune cells in the graft survival and graft loss samples. AR: acute rejection; NAR: non-acute rejection; CR: chronic rejection; TOL: transplantation tolerance; NK: natural killer.
Graft Survival Analysis of Gene Signature
The KM plots indicated that patients with low expression of BLNK (Fig. 8A) and MZB1 (Fig. 8B) had a more satisfied Overall Survival (OS) than patients with high expression. To further discover the immune cell infiltration of the graft survival–related genes, the lollipop plots were used to perform the enrichment results in the TOL group, the AR group, the CR group, and the graft loss group. In the TOL group, BLNK was positively correlated with B cells naive, T cells CD4 memory resting, and plasma cells and negatively correlated with NK cells resting, neutrophils, B cells memory, mast cells resting, macrophages M0, T cells CD8, and monocytes (Fig. 9A). MZB1 was positively correlated with plasma cells, B cells naive, T cells regulatory (Tregs), T cells CD4 memory resting, and T cells gamma delta and negatively correlated with B cells memory, mast cells resting, T cells CD8, neutrophils, NK cells resting, macrophages M1, macrophages M0, NK cells resting, and monocytes (Fig. 9B). In the AR group, BLNK was positively correlated with B cells naive, NK cells activated, and T cells CD4 memory resting and negatively correlated with neutrophils, NK cells resting, and macrophages M0 (Fig. 9C). MZB1 was positively correlated with B cells memory, plasma cells, T cells CD8, T cells follicular helper, and NK cells activated and negatively correlated with NK cells resting, mast cells resting, macrophages M2, and neutrophils (Fig. 9D). In the CR group, BLNK was positively correlated with B cells naive and T cells CD4 memory resting and negatively correlated with macrophages M1 and B cells memory (Fig. 9E). MZB1 was positively correlated with plasma cells, B cells naive, T cells CD4 memory resting, and Tregs and negatively correlated with monocytes, B cells memory, and mast cells resting (Fig. 9F). In the graft loss group, BLNK was positively correlated with T cells gamma delta, T cells CD4 memory resting, T cells CD4 memory activated, monocytes, dendritic cells activated, macrophages M2, and T cells CD4 naive and negatively correlated with mast cells activated, T cells follicular helper, T cells CD8, Tregs, and dendritic cells resting (Fig. 9G). MZB1 was positively correlated with plasma cells, B cells naive, T cells gamma delta, T cells CD4 memory activated, and T cells CD8 and negatively correlated with macrophages M0, B cells memory, dendritic cells resting, T cells CD4 memory resting, NK cells resting, and macrophages M2 (Fig. 9H).

The graft survival analysis of the TOL-related gene signature. (A) The KM plot analysis between BLNK high-expression and BLNK low-expression samples. (B) The KM plot analysis between MZB1 high-expression and MZB1 low-expression samples. TOL: transplantation tolerance; KM: Kaplan–Meier.

BLNK- and MZB1-enriched immune infiltration result in different groups. (A) The lollipop plot of the BLNK-enriched immune cells in the TOL group. (B) The lollipop plot of the MZB1-enriched immune cells in the TOL group. (C) The lollipop plot of the BLNK-enriched immune cells in the AR group. (D) The lollipop plot of the MZB1-enriched immune cells in the AR group. (E) The lollipop plot of the BLNK-enriched immune cells in the CR group. (F) The lollipop plot of the MZB1-enriched immune cells in the CR group. (G) The lollipop plot of the BLNK-enriched immune cells in the graft loss group. (H) The lollipop plot of the MZB1-enriched immune cells in the graft loss group. TOL: transplantation tolerance; AR: acute rejection; CR: chronic rejection; NK: natural killer.
Discussion
The metadata data set GSE49198 from GEO database embodying 596 samples was used to conduct our finding. However, due to its limited available data, it contains fewer kidney transplantation samples with information about kidney function (TOL and STA). To ensure that our model is workable, we screened the samples step by step. Finally, the number of the remaining samples was 61 HV samples, 96 TOL samples, and 311 STA samples in total. To overcome the shortage of small samples, we adopted SVM, which was an ML method with unique advantage in processing small sample data. In this way, we can screen out DEGs with TOL prognostic value as much as possible while guaranteeing high accuracy and good performance of the predictive model. Admittedly, the sample size of our study is small. Although we use several different data sets to increase the reliability of results, it still needs some experimental study to verify.
Due to the current limited number of patients, there was still no clear progress in the genetic analysis of TOL involvement in kidney transplantation 23 . To solve it, our study selected GSE49198 data set, a collection chip with multiple kidney transplantation patient data sets. As the AR samples for kidney transplantation were limited, GSE15296 and GSE131179 data sets were added to ensure that the number of samples is sufficient to provide a convincing result.
Gene Function Analysis
In our study, 25 DEGs were selected. GO and KEGG enrichment results showed that DEGs were mainly enriched in B cell function and related pathways, like B cell proliferation, B cell receptor signaling pathway, and B cell activation. Studies had shown that B cells were closely related to the immune response in kidney transplantation, and the AR or CR patients maintained low levels of B cells24,25. Le Berre et al. 26 also demonstrated that B cell proliferation and activation also played an essential role in TOL patients than in allograft rejection patients. GSEA result suggested that TOL patients were mainly negatively associated with glycolysis signaling pathways. Glycolysis was associated with cell growth and was one of the four major processes in cellular metabolism that played an important role in hypoxic inflammation and immune responses27,28. Previous studies discovered that the increased glycolysis was related to immune activity in tumor, and the inhibition of glycolysis could generate antitumor immune responses29,30. However, the role of the glycolytic pathway in kidney transplantation was not yet clear, but our previous study had indicated that TOL was associated with high levels of B cells, which was also likely to be related to the immune response caused by glycolysis in kidney transplantation. The STA patients in GSEA result were mainly associated with adherens junction pathway. The adherens junction was the structure of intercellular connections, which was also confirmed that they are enriched in low immune subtype of breast cancer31,32.
7 TOL-Related Gene Signature
The 7 TOL-related gene signature was selected by two different ML methods. TCL1A, IL17RB, CD79A, CD22, YARS, BLNK, and MZB1 were identified as the gene signature. The top five genes, although not significantly associated with graft survival, had played important roles in TOL mechanism and some could affect the occurrence of AR or CR in kidney transplantation. Studies had proved that the TCL1A gene expression level was significantly increased in TOL patients, and it was closely related to the regulation of B cells and the maintenance of immune TOL33,34, which was also consistent with our study. Sebastiaan Heidt et al. 35 discovered that the TCL1A expression level decreased in AR patients, which was inconsistent with our research result, and further research is needed. IL17RB was the receptor of IL17B and IL17E, which was expressed in CD4+ T cells and had great effect in IgE regulation in both asthma and seasonal allergic rhinitis36,37. Although IgE could lead to type I hypersensitivity, its role in the TOL maintenance in kidney transplantation remained unclear. Our study demonstrated that IL17RB expression was significantly increased in TOL patients, while there was little difference in acute or CR. More confirmed experiments were required. CD79A was the marker of B cells, indicated the B cell level 38 , which was the potential feature of classic Hodgkin lymphoma 39 . van den Hoogen et al. 40 indicated that AR in kidney transplantation was independent of the CD79A marker as B cell levels. CD22 was also the marker of B cell, and the function of CD22 was related to the occurrence of autoimmune diseases41,42. CD22 could act as the receptor of IgM, regulate B cells to participate in the rejection of allograft, and could conduct TOL maintenance response through the regulation of interleukin 10 production43,44. Our study found that although CD79A and CD22 were highly expressed in AR, its predictive performance was not satisfied, which might also confirm that the occurrence of AR had no significant effect on B cell proliferation. YARS was the gene encoding tyrosyl-tRNA synthetase, which could regulate the process of protein translation and was associated with a variety of genetic diseases45,46. Cheng Zhang et al. 47 confirmed YARS was the oncogenic protein that promoted cancer progression. However, there was no research on the role of YARS in kidney transplantation. BLNK and MZB1 were not only identified as the TOL-related gene signature but also regarded as the potential feature genes correlated with graft rejection. BLNK was the B cell regulatory gene that participated in the B cell signaling pathway and maintained the maturation of B cells47–49. Deficiency of BLNK led to blockade of B cell signaling pathway, resulting in the decrease of memory B cell and memory T cell 50 . Consistently, we found that in the CIBERSORT results, BLNK were closely enriched in the different subtypes of B cell and T cell, which indicated that BLNK may still played an essential role in kidney transplantation by regulating B cell and T cell level. Studies had shown that the expression of BLNK was significantly reduced after kidney transplantation 51 , but it was upregulated in TOL patients 52 , which was also consistent with our conclusion. MZB1 was an endoplasmic reticulum–localized protein that increased IgM secretion and was involved in humoral immune responses53,54, which had also proven to be a potential prognostic biomarker in gastric and breast cancer55,56. Sofia Christakoudi et al. 57 had suggested that MZB1 was one of the TOL-related gene signatures in his research, which was consistent with our conclusion. Our immune infiltration results indicated that MZB1 was not like BLNK just enriched in some subtypes of T cell and B cell but also enriched in some humoral immune cells like plasma cell, NK cell, and macrophage cell, which suggested that MZB1 may participate in immune-related responses of kidney transplantation through humoral and cellular immunity at the same time, and further validation was needed.
In summary, we speculated that upregulation of BLNK and MZB1 can increase the number of immature B cells and plasma cells, enhance immune regulatory ability, and lead to the formation of TOL after kidney transplantation. However, once BLNK or MZB1 was excessively upregulated, it may lead to autoimmune overregulation and actually reduce the graft survival rate. The specific mechanism and threshold determination still need further research and exploration.
Immune Cell Infiltration
To analyze the enrichment results of immune cell infiltration in different conditions of kidney transplantation, CIBERSORT was applied. B cells naive and plasma cells were mainly enriched in TOL patients. Previous evidence showed that naive B cells played an essential role in TOL maintenance, with increased naive B cells could conduct the composition of the B cell compartment57–62. Daniel Baron et al. 63 pointed that the preservation of the B cell compartment may have great effect on counteracting inflammation and stabling cell homeostasis. Plasma cells were the main cells involved in humoral immunity 64 . James I. Kim et al. 65 suggested that plasma cells may also have great influence on regulatory B cell increased, which involved in keeping stable kidney function in TOL patients. AR patients were highly enriched in T cells CD8. Many studies inferred that CD8 T cells could be an independent risk factor of AR, which would greatly increase and activate the cellular rejection66–69. Our research also confirmed this conclusion. CR patients were mainly enriched in B cells memory, T cells CD8, dendritic cells resting, and mast cells resting. Memory B cells were linked to the allograft rejection and loss, activated in the CR patients, and led to the rejection happened70,71. CD8 T cells were also highly enriched, evolving in the occurrence of CR. It was consistent with our results. However, few articles were published about the dendritic cells resting and mast cells resting functions in CR; further validation was still required. In graft loss patients, there was little difference.
However, our research still had some unfinished problems. Our study was a genomics database study; although a few of different data sets had been applied to increase the reliability of the results, there was still a lack of experimental study, which was also the direction for further research in the future. Moreover, some of our results had not been proven or contradicted with current research, which needed further validation. At last, our research only gave the direct results of the gene expression level and immune cells infiltration in different cases of kidney transplantation, without studying about the mechanism of its occurrence and development.
Conclusion
In conclusion, this study successfully identified a gene signature related to TOL in kidney transplantation. The gene expression and predictive performance of the TOL-related genes were validated in groups with AR, CR, and graft loss. The study also revealed the enriched immune cells associated with the TOL-related genes using immune infiltration analysis. The KM plots confirmed the graft survival–related genes and their associated immune cell infiltration results. These findings provide valuable insights into the immunosuppressive therapy for kidney transplant patients and may contribute to the development of personalized treatment strategies. Further studies are needed to validate the clinical significance of the identified TOL-related gene signature.
Footnotes
Author Contributions
Zhaohui He, Fucai Tang, Zhibiao Li, and Zechao Lu conceived this study; Zhaohui He, Fucai Tang, Zhibiao Li, Zechao Lu, and Chuxian Hu conducted the work and analyzed the data; Zhibiao Li, Zechao Lu, Chuxian Hu, and Yixin Zhang were involved in writing the manuscript; Zhibiao Li, Zhaohui He, Fucai Tang, Zechao Lu, Yushu Chen, and Jiahao Zhang revised the manuscript. Feng Guo, Jinjin Wang, and Zhicheng Tang collected the data and collated the manuscript. All the authors listed read and approved the manuscript.
Consent for Publication
Not Applicable
Consent to Participate
Not Applicable
Data Availability Statement
Ethical Approval
Ethical approval is not applicable as there are no human participants or animals studied in this article.
Statement of Human and Animal Rights
This article does not contain any studies with human or animal subjects.
Statement of Informed Consent
There are no human subjects in this article and informed consent is not applicable.
Declaration of Conflicting Interests
The author(s) declared no potential conflicts of interest with respect to the research, authorship, and/or publication of this article.
Funding
The author(s) disclosed receipt of the following financial support for the research, authorship, and/or publication of this article: This study was supported by National Key Research and Development Program of China (contract no. 2018YFA0902801), Guangdong Basic and Applied Basic Research Foundation (contract no. 2020A1515010152), public health research project in Futian District, Shenzhen (grant no. FTWS2020026), and the research start-up fee for the Eighth Affiliated Hospital, Sun Yat-sen University (grant no. zdbykyqdf005).