
Abstract
Background:
It was unknown if the effectiveness of COVID-19 vaccines could vary between regions.
Objective:
To explore key differences in COVID-19 pandemics in British Columbia (BC) and Ontario (ON) and to investigate if the vaccine effectiveness (VE) among maintenance dialysis population could vary between these 2 provinces.
Study Design:
Retrospective cohort.
Setting and Patients:
This retrospective cohort study included patients from population-level registry in BC who were on maintenance dialysis from December 14, 2020, to December 31, 2021. The COVID-19 VE among BC patients were compared to the previously published VE among similar patient population in ON. Two-sample t-test for unpaired data were used to investigate if the VE estimates from BC and ON were statistically significantly different.
Exposure:
Exposure to COVID-19 vaccines (BNT162b2, ChAdOx1nCoV-19, mRNA-1273) was modeled in a time-dependent fashion.
Outcome:
Reverse transcription polymerase chain reaction (RT-PCR) confirmed COVID-19 infection and related severe outcome defined by hospitalization or death.
Analytical Approach:
Time-dependent Cox regression analysis.
Results:
This study using BC data included 4284 patients. Median age was 70 years and 61% was male. Median follow-up time was 382 days. 164 patients developed COVID-19 infection. The ON study by Oliver et al included 13 759 patients with a mean age of 68 years. 61% of the study sample was male. Median follow-up time for patients in the ON study was 102 days. A total of 663 patients developed COVID-19 infection. During the overlapped study periods, BC had 1 pandemic wave compared to 2 in Ontario with substantially higher infection rates. Vaccination timing and roll out among the study population were substantially different. Median time between first and second dose was 77 days (interquartile range [IQR] 66-91) in BC compared to 39 days (IQR = 28-56) in Ontario. Distribution of COVID-19 variants during the study period appeared to be similar. In BC, compared to pre-vaccination person-time, risk of developing COVID-19 infection was 64% (aHR [95% CI] 0.36 [0.21, 0.63]), 80% (0.20 [0.12, 0.35]) and 87% (0.13 [0.06, 0.29]) less when exposed to 1 dose, 2 doses, and 3 doses, respectively. In contrast, risk reduction among Ontario patients was 41% (0.59 [0.46, 0.76]) and 69% (0.31 [0.22, 0.42]) for 1 dose and 2 doses, respectively (patients did not receive the third dose by study end date of June 30, 2021). VE against COVID-19 infection in BC and ON was not statistically significantly different, the P values for exposure to 1 dose and 2 doses comparisons were 0.103 and 0.163, respectively. Similarly, in BC, risk of developing COVID-19-related hospitalization or death were 54% (0.46 [0.24, 0.90]), 75% (0.25 [0.13, 0.48]) and 86% (0.14 [0.06, 0.34]) less for 1 dose, 2 doses, and 3 doses, respectively. Interestingly, exposure to second dose appeared to provide better protection against severe outcomes in Ontario versus BC, risk reduction was 83% (aHR = 0.17, 95% CI [0.10, 0.30]) and 75% (aHR = 0.25, 95% CI [0.13, 0.48]), respectively. However, the adjusted hazard ratios were not statistically significantly different between BC and ON, the P values were 0.676 and 0.369 for exposure to 1 dose and 2 doses, respectively.
Limitations:
Infection rate, variant distribution, and vaccination strategies were compared using publicly available data. VE estimates were compared from 2 independent cohort studies from 2 provinces without patient-level data sharing.
Conclusions:
Health Canada approved COVID-19 vaccines were highly effective among patients with maintenance dialysis from BC and ON. Although there appeared to be between province differences in pandemic waves and vaccination strategies, the VE against COVID-19 infection as well as related severe outcome appeared to be not statistically significantly different. A nationally representative VE could be estimated using pooled data from multiple regions.
Introduction
The World Health Organization (WHO) recommended evaluating real-world vaccine performance in an array of scenarios including among subpopulations at risk. 1 People with reduced kidney function are considered to be vulnerable to COVID-19 infections and related complications.2,3 In recent past, substantial research has been done on the humoral immune response as well as the clinical effectiveness of the COVID-19 vaccines in patients who were on maintenance dialysis.3 -7 For example, Garcia et al 8 investigated the antibody responses against mRNA and attenuated adenovirus types of COVID-19 vaccines among dialysis patients from 4 states in the United States. On the other hand, several studies have looked into the COVID-19 vaccine effectiveness (VE) in preventing COVID-19 infection and related hospitalization or death. For example, Oliver et al 4 reported that 2 doses of mRNA vaccines were 69% effective in preventing COVID-19 infections among maintenance dialysis population in Ontario prior to the emergence of omicron and its subvariants. Majority of these previously published studies were conducted using data from dialysis clinics or linked health data from a specific region. It is still unknown if the VE in maintenance dialysis population estimated using data from 1 region were generalizable to the same study population in a separate region.
There were regional differences in COVID-19 pandemic waves, timing and emergence of variant of concerns (VOC), vaccine availability and roll out strategies in large countries like Australia, Canada, and the United States. We hypothesized that the effectiveness of COVID-19 vaccines against COVID-19 infection and subsequent severe outcomes may vary by region. The universal health care system in Canada enabled us to investigate this variation using population level data. British Columbia (BC) and Ontario (ON) are 2 large provinces in Canada with population size of approximately 5.2 and 14.8 million, respectively. 9 COVID-19 pandemic has impacted these provinces differently. For example, as of July 30, 2022, the total number of COVID-19 cases in BC was 0.38 million (7273 per 100 000 population) versus 1.37 million (9250 per 100 000 population) in Ontario. 10 The objective of this study was to describe the key differences in COVID-19 pandemics in BC and Ontario and to investigate if the VE among the maintenance dialysis population could vary between these 2 provinces. Knowledge created from this study has the potential to inform COVID-19 vaccination strategy among the maintenance dialysis population in countries where there could be regional differences in COVID-19 pandemic waves.
Methods
Comparing Key Differences in COVID-19 Pandemics in BC and Ontario
We identified a set of factors a priori that may have impact on the COVID-19 VE among maintenance dialysis patients and was possible to compare the differences in those factors in BC and Ontario using publicly available published data. We divided the factors into 2 sections; external and internal to the study. The external factors compared the background community infection rate, the vaccine roll out strategies and the distribution of COVID-19 variants during the study periods. Figure comparing the new daily rates of cases per 100 000 population (7-day moving average) in BC and Ontario for the period of December 1, 2020, to December 31, 2021 were created using British Columbia Center for Disease Control, BCCDC’s COVID-19 Epidemiology App. 11 We did not have access to the patient level data on the COVID-19 variant. In order to compare the distribution of COVID-19 variants during the study period, we downloaded the publicly available figures presenting the percentage of COVID-19 cases caused by different variants in BC12,13 and Ontario. 14 The overall distribution of variants in Canada were created using publicly available data on weekly variant breakdown. 15 In addition, we compared the vaccine roll out among this study population to that of reported by Oliver et al 4 using Ontario data. Finally, we compared the differences in internal factors at study design level including differences in study period, how the vaccine exposure and study outcome variables were created and analyzed.
Estimation of the COVID-19 VE Among Maintenance Dialysis Patients in BC, Canada
Study population
This was a retrospective cohort study. We used data from Patient Records and Outcome Management Information System (PROMIS), a population based integrated registry database for chronic kidney disease patients under specialized nephrologist care in BC, Canada. 16 Patients aged at least 18 years who were on maintenance dialysis (≥90 days) as of December 14, 2020 (prevalent patients) and those initiated dialysis (≥90 days) between December 15, 2020, and December 31, 2021 (incident patients) were included in the study cohort. For prevalent patients the index (cohort entry) date was December 14, 2020. For incident patients, the index date was the date they started the maintenance dialysis. Patients who had prior history of kidney transplantation before index date were excluded. Study individuals who developed COVID-19 infection within 14 days of cohort entry were also excluded. Finally, patients from outside of the province of BC were excluded.
Exposure definition
Exposure to COVID-19 vaccines was the independent variable in this study. In BC, 3 Health Canada approved vaccines were available during the study period, ie, BNT162b2 (BioNTech Pfizer), ChAdOx1 (AstraZeneca), and MRNA-1273 (Moderna). We did not differentiate the exposure based on vaccine type received, ie, patients could receive the same vaccine for all 3 doses or a combination of different vaccines. PROMIS database received COVID-19 vaccination records for all renal patients through the automated data integration system with PANORAMA, an integrated electronic public health records system in BC. On December 9, 2020, the province prioritized vaccination for frontline health care workers in hospitals, emergency, and intensive care units that provided care to the COVID-19 patients, residents of long-term care homes, seniors aged >80 years and individuals living in the high-risk living conditions for example the homeless, people living in shelters or isolated Indigenous communities. Starting in December 14, 2020, some patients on maintenance hemodialysis were given vaccines during their in-center dialysis, or sent to their local vaccination centers. All dialysis patients in BC were prioritized in the context of provincial clinically extremely vulnerable (CEV) population and started receiving their first dose from March 29, 2021. In BC, the interval between first and second dose was extended to vaccinate more people with first dose by end of March 2021. Majority of the maintenance dialysis patients received their second dose between May to July 2020.
Please see “Statistical analysis” for technical details on the time-dependent COVID-19 vaccine exposure modeling.
Outcome variable
In this study, the primary outcome was the reverse transcription polymerase chain reaction (RT-PCR) confirmed SARS-CoV-2 (COVID-19) infection. We used data on test results recorded in PROMIS. 4 The sample collection date was recorded as the primary outcome date. The secondary outcome was the COVID-19-related severe outcome that was defined as the composite outcome of COVID-19-related hospitalization or death (whichever occurred first). A hospitalization was considered to be COVID-19-related if a positive COVID-19 test had occurred within 14 days prior to or anytime during the hospital stay. 4 For COVID-19-related deaths, a positive COVID-19 test must have occurred within 30 days prior to death. 4
Covariables
Demographic variables included age at index, sex and self-reported race. Dialysis vintage in years was entered as a continuous variable and dialysis modality was categorized as home or in-center hemodialysis. Baseline history of having comorbidities including diabetes, cardiovascular disease (CVD)-related disorders or respiratory diseases were recorded. We used medication dispensing records from PROMIS to assess the baseline use (defined as within 90 days before the index date) of immunosuppressive (IS) medications (Azathioprine, Cyclophosphamide, Cyclosporine, Mycophenolate, Prednisone, Rituximab, and Tacrolimus). We also assessed if the patient was a resident in long-term care facility. Finally, we calculated the background community infection rates at health authority levels using publicly available data from BCCDC 12 and BC Stat’s websites. 9
Statistical analysis
Descriptive statistics were reported as frequencies and proportion for categorical variables and median (interquartile range, IQR) for continuous variables.
Study participants were followed prospectively from the index date until they developed an COVID-19 infection or COVID-19-related severe outcome or were censored due to emigration, non-COVID-19-related death, recovered kidney function, kidney transplantation, withdrawal from dialysis or study end date, whichever occurred first.
We created time-dependent COVID-19 vaccine exposure variable using data from vaccination status recorded in PROMIS database. In the time-dependent variable the exposure to COVID-19 vaccine for an individual patient could change over time from (1) pre-vaccination person-time: not vaccinated or <21 days after first dose, 17 to (2) partially vaccinated: ≥21 days after first dose and <14 days after second dose,5,17 to (3) fully vaccinated: ≥14 days after second dose and <7 days after third dose,5,18 and finally to (4) third dose: ≥7 days after third dose. 18
To account for the underlying risk of COVID-19 transmission, we created a time-dependent co-variable for the background infection rate at the health authority level. The detailed method is published elsewhere. 19 In short, we first determined the health authority using the first 3 digits of the postal code of patient’s residence. Then, we extracted the number of COVID-19 positive cases reported on a daily basis by health authority from the data publicly available in the BCCDC’s “COVID-19 Data” webpage. 12 Then, we calculated the total number of COVID-19 cases in each of the calendar months by summing up the daily number of cases for each month. We then downloaded the publicly available population estimates for each of the health authorities by year from the BC Stat’s website. 9 Finally, the monthly COVID-19 infection rate in a particular health authority was calculated by dividing the total number of cases in a month in that health authority by the population estimate of that health authority. It was subsequently converted to time-on-study scale for analyses.
We used time-dependent cause-specific Cox regression analysis with time-on-study scale adjusting for time-dependent background infection rate. In addition, a set of covariables that were selected a priori including age, sex, race, dialysis vintage and modality, baseline history of comorbidities (diabetes, CVD, or respiratory diseases), baseline history of immunosuppressive medication use, and long-term care residence were also entered into the multivariable model to obtain an adjusted hazard ratio (aHR) for vaccine exposure. The proportional hazard assumption was tested using weighted Schoenfeld residuals. We conducted a sensitivity analysis including only prevalent maintenance patients as of December 14, 2020. All analyses were performed using SAS Software, Version 9.4 (SAS Institute Inc., Cary, NC, USA).
Comparing the COVID-19 Vaccine Effectiveness Among Maintenance Dialysis Patients From BC and Ontario
We compared the COVID-19 vaccine effectiveness among maintenance dialysis patients from BC with the estimates reported by Oliver et al 4 using Ontario data. The analyses of BC and Ontario data were conducted independently with no data transfer or sharing and no linkage of data from 2 provinces. We used a 2-sample t-test for unpaired data to investigate if the VE estimates from BC and ON were statistically significantly different.
Results
Comparison of Factors External to the Study: Background Community Infection Rate
The VE study using Ontario data spanned from December 21, 2020, to June 30, 2021. It appeared that Ontario experienced 2 distinct pandemic waves compared to 1 in BC during this period. The first wave lasted from December 2020 to February 2021, where the infection rate in Ontario appeared to be substantially higher than that of BC (Figure 1).

Comparison of the COVID-19 infection rate in British Columbia and Ontario from December 1, 2020, to December 31, 2021.
Comparison of Factors External to the Study: Vaccine Roll Out Among the Study Populations
The first dose of COVID-19 vaccines were administered to the maintenance dialysis patients in BC and Ontario at the similar time frame. Although the initial vaccination with first dose started in the third week of December 2020, the majority were vaccinated from end of February 2021 to April 2021. Providing the second dose among the Ontario patients started in February 2021 that continued in parallel to the first dose vaccination. The majority of the second dose was given from April to June 2021 with a median wait time of 39 days between first and second dose (Table 1). In contrast, only a handful of BC patients received the second dose in February 2021 and majority received from May to July 2021 with a much longer median wait time of 77 days between doses. Patients in BC started receiving their third dose of the vaccine in early September 2021. The Ontario study period ended on June 30, 2021 by which none of the study individuals received the third dose (Figure 2).
Comparison of Factors Internal and External to the Study That May Contribute to the Differences in COVID-19 Vaccine Effectiveness Estimates Among Maintenance Dialysis Patients in British Columbia and Ontario.
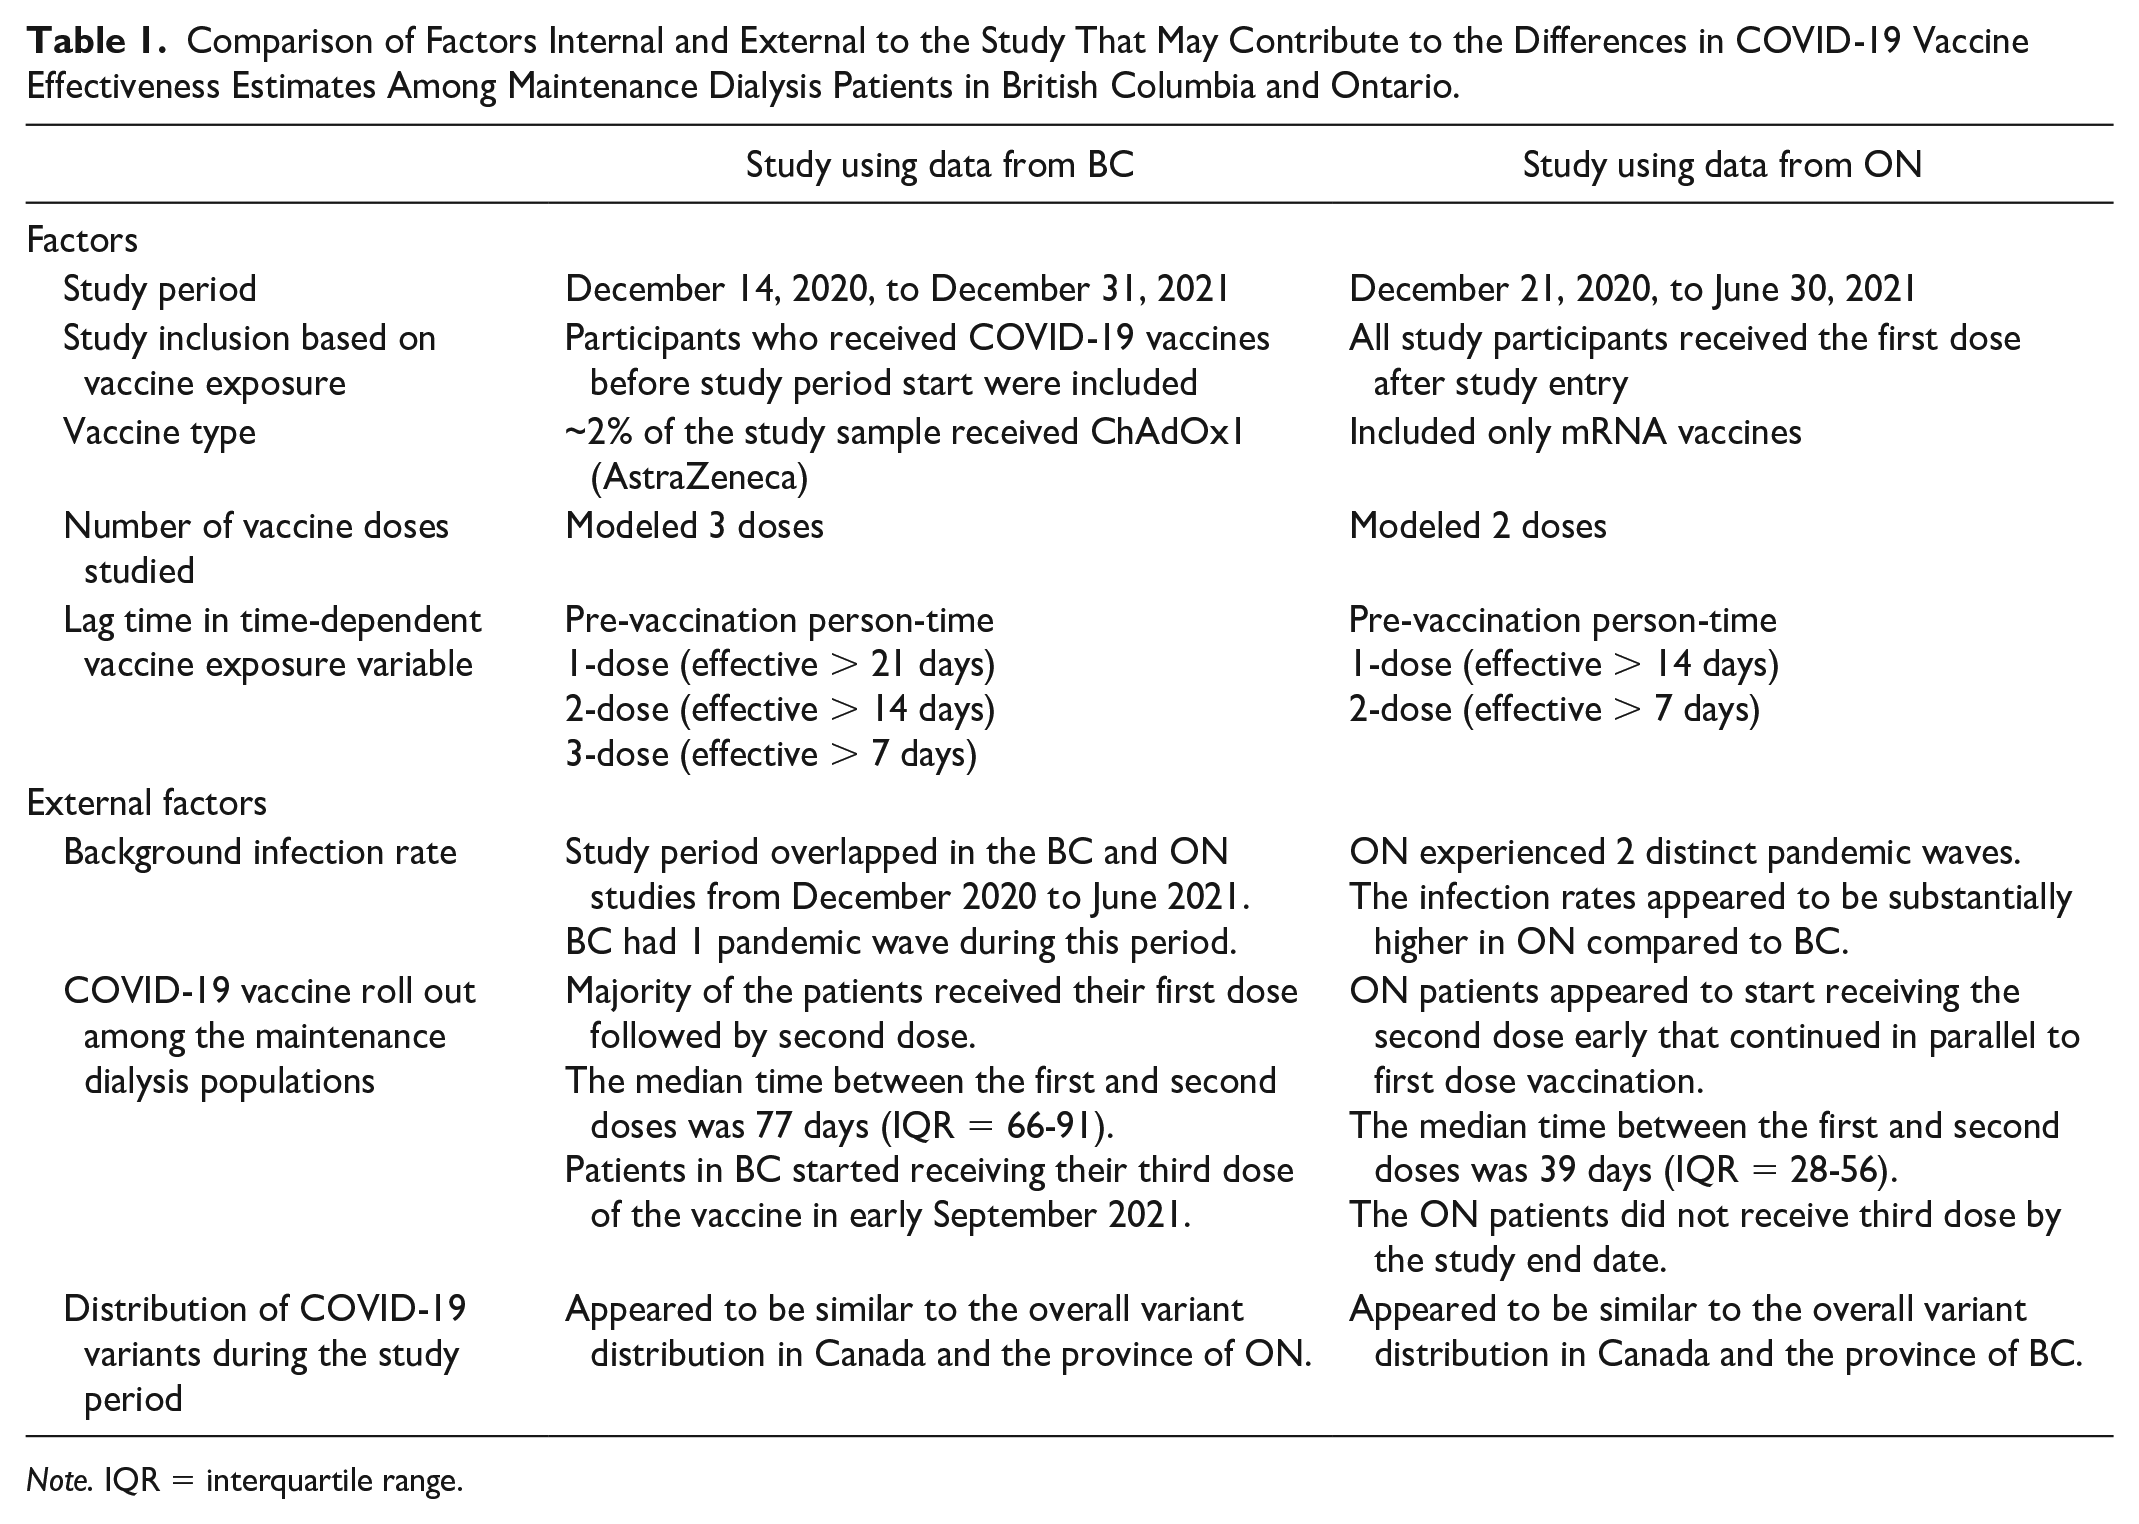
Note. IQR = interquartile range.

Comparing the COVID-19 vaccine roll out among the maintenance dialysis patients in British Columbia and Ontario, Canada.
Comparison of Factors External to the Study: Distribution of COVID-19 Variants During the Study Period
The BCCDC presented the distribution of the top 20 variants and grouped the remaining as “Others.” On the other hand, the Ontario graph grouped COVID-19 variants by mutation where variants with N501Y mutation (N501Y+) included Alpha, Beta, Gamma and Omicron and the variants with E484K mutation (E484K+) included Beta and Gamma. It appeared that wild type variant was most prevalent till April 2021 after which Alpha and Gamma variants were predominant. The Delta variant gradually increased since May 2021 and became the dominant variant by July 2021. The distribution of COVID-19 variants in BC and Ontario appeared to be similar to the overall variant distribution in Canada and not be substantially different from each other (Supplementary Figures S1 and S2).
Comparison of Factors Internal to the Study That May Contribute to the Differences in COVID-19 VE Estimates From BC and Ontario
None of the COVID-19 infections among maintenance dialysis patients in BC had occurred during exposure to 2 doses person-time by June 30, 2021, the end date of the Ontario study. As such, the BC study period was extended to December 31, 2021 to capture sufficient study outcomes. In this study we modeled 3 doses of the COVID-19 vaccines as a substantial proportion (54%) of the BC study sample received their third dose during the extended study period. In contrast, the Ontario study ended in June 30, 2021, and none of the patients received third dose. In the Ontario study, the first dose was considered to be effective after 14 days of administration, and the second dose was effective after 7 days. In contrast, the BC study used the recently updated lag period of 21, 14, and 7 days for first, second, and third doses, respectively. A small proportion (~2%) of patients in BC cohort were vaccinated with ChAdOx1 (AstraZeneca) vaccine whereas the ON study included only mRNA type of the vaccines. Finally, in this study using BC data, previously vaccinated patients were included where the patient contributed to the vaccine exposure time as per their vaccination status at study entry. In contrast, patients in the Ontario study started as unvaccinated and received the first dose after study entry (Table 1).
COVID-19 VE Among Maintenance Dialysis Patients in BC, Canada
Cohort Derivation
In this retrospective cohort study, we analyzed a cohort of 4808 maintenance dialysis patients who were registered in PROMIS between December 14, 2020 and December 31, 2021. The study sample included 4284 patients (Figure 3). There were 3271 prevalent patients who were on maintenance dialysis as of December 14, 2020, and 1013 incident patients who started maintenance dialysis between December 15, 2020, and December 31, 2021. Table 2 presents the characteristics of the overall study sample (Supplementary Table S1 presents patient characteristics by vaccination status). Median age at study entry was 70 years and 61% of the study sample was male. The median follow-up period was 382 days and the cumulative follow-up period was 3354 person-years. By the end of follow-up, more than half (54%) of the patients received the third dose and a quarter (26%) received 2 doses. Only 306 out of 4284 patients (7%) received 1 dose and 560 (13%) patients remained unvaccinated.
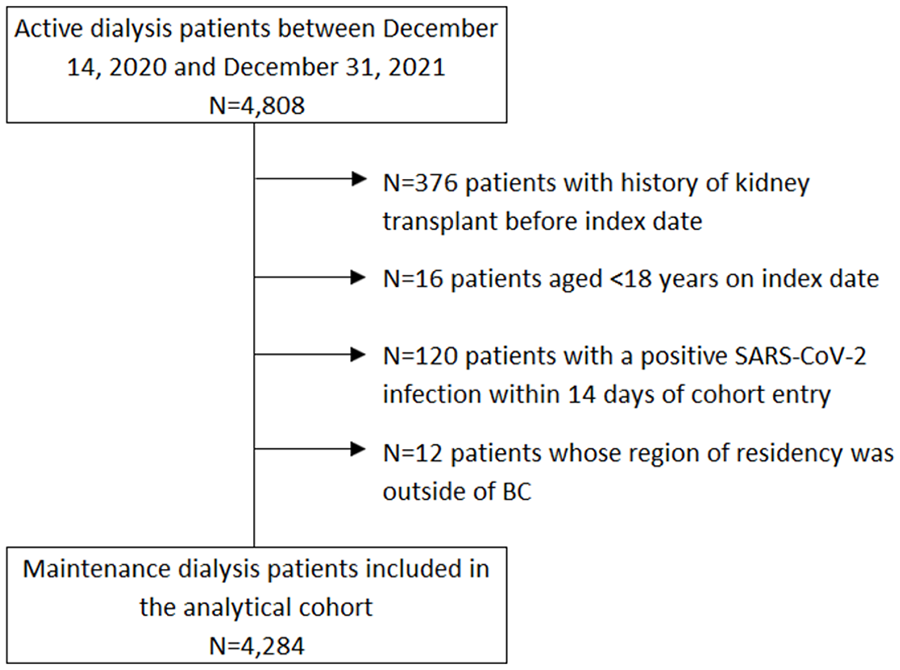
British Columbia study cohort derivation.
Patient Characteristics.

Note. CVD = cardiovascular disease; N/A = not applicable.
Outcome
A total of 164 patients were infected with incident SARS-CoV-2 (COVID-19) infection, the primary outcome of the study. The majority (59%) of infections developed during the pre-vaccination person-time (Table 3, also presents the distribution from the Ontario data). Twenty-one (13%) infections occurred during exposure to 1 dose, 35 (21%) to 2 doses, and 11 (7%) to 3 doses of vaccine exposure. Health Canada approved COVID-19 vaccines were highly effective in preventing incident COVID-19 infections and related severe outcomes among maintenance dialysis patients both in BC and Ontario (Table 4). All study variables met the proportional hazard assumption. In BC, compared to pre-vaccination person-time, the risk of developing COVID-19 infection was 64% (aHR = 0.36, 95% CI [0.21, 0.63]) less when exposed to 1 dose of COVID-19 vaccine, 80% (aHR = 0.20, 95% CI [0.12, 0.35]) less when exposed to 2 doses and 87% (aHR = 0.13, 95% CI [0.06, 0.29]) less when received the booster third dose (Table 4). In contrast, reduction in risk among Ontario patients was 41% (aHR = 0.59, 95% CI [0.46, 0.76]) and 69% (aHR = 0.31, 95% CI [0.22, 0.42]) for exposure to 1 dose and 2 doses, respectively (patients did not receive the third dose by study end date of June 30, 2021). Results from the 2-sample t-test for unpaired data indicated that the aHR for both 1 dose and 2 doses were not statistically significantly different between BC and ON, the P values were 0.103 and 0.163, respectively (Table 4). Supplementary Table S2 contains detailed results of the Cox model.
Unadjusted Rates of SARS-CoV-2 Infection and COVID-19-Related Severe Outcome By Time-Dependent Vaccine Exposure Status.
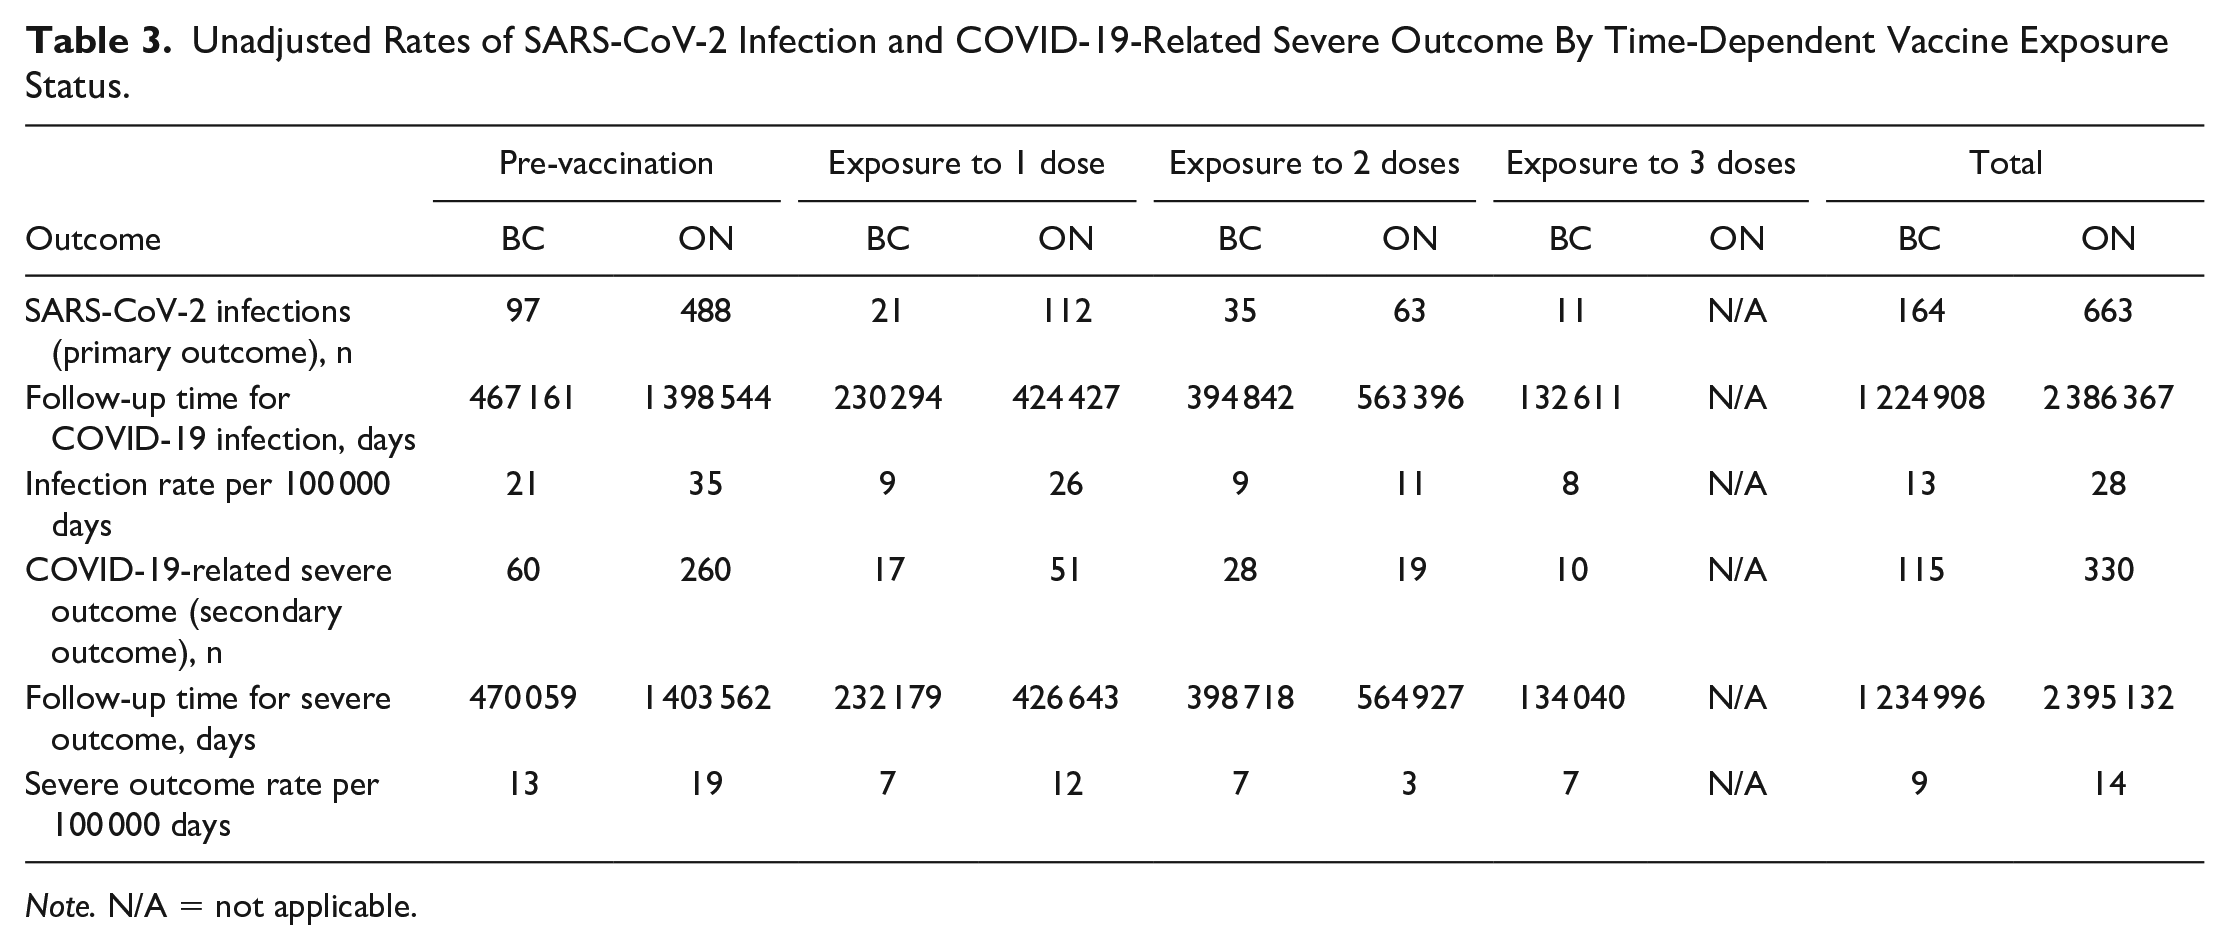
Note. N/A = not applicable.
Results From the Cox Regression Analysis Using Time-Dependent COVID-19 Vaccine Exposure.

Note. HR = hazard ratio; CI = confidence interval; NA = not applicable.
Adjusted for age, sex, race, dialysis vintage and modality, baseline history of comorbidities including diabetes, cardiovascular and respiratory diseases, baseline history of immunosuppressive medication use, long-term care residence status and background rate of COVID-19 infection
Similarly, among maintenance dialysis patients in BC, compared to pre-vaccination person-time, the risk of developing the COVID-19-related severe outcomes were 54% (aHR = 0.46, 95% CI [0.24, 0.90]), 75% (aHR = 0.25, 95% CI [0.13, 0.48]) and 86% (aHR = 0.14, 95% CI [0.06, 0.34]) less when exposed to 1 dose, 2 doses, and 3 doses, respectively. Interestingly, exposure to second dose appeared to provide better protection against the severe outcome among maintenance dialysis patients in Ontario versus BC, the risk reduction was 83% (aHR = 0.17, 95% CI [0.10, 0.30]) and 75% (aHR = 0.25, 95% CI [0.13, 0.48]), respectively. However, the adjusted hazard ratios were not statistically significantly different between BC and ON, the P values were 0.676 and 0.369 for exposure to 1 dose and 2 doses, respectively (Table 4, Supplementary Table S3).
Sensitivity Analysis
In a sensitivity analysis, we included only the prevalent maintenance dialysis patients as of December 14, 2020 (N = 3271). The directionality and magnitude of the COVID-19 vaccine effectiveness was similar to the estimates from the primary analysis (Supplementary Table S4).
Discussion
To the best of our knowledge, this is the first retrospective cohort study that compared the regional differences in COVID-19 pandemic related factors and investigated how the COVID-19 VE among maintenance dialysis patients could vary by region. We found that there were substantial differences in terms number of COVID-19 pandemic waves, the COVID-19 infection rate in the community, and vaccine roll out among maintenance dialysis populations in BC and Ontario. These factors influenced the length of study periods and how the COVID-19 vaccine exposure and study outcomes were created and analyzed in the real-world VE studies conducted independently in BC and Ontario. We also found that COVID-19 vaccines were highly effective in preventing incident COVID-19 infection as well as severe outcomes defined as a composite outcome of COVID-19-related hospitalization or death both in BC and Ontario prior to the emergence of omicron and its subvariants. The adjusted hazard ratios for both the primary and secondary outcomes were not statistically significantly different despite the apparent differences in pandemic waves and vaccine roll out strategies between BC and ON.
Substantial research has been conducted on COVID-19 vaccination among patients receiving kidney dialysis. Although antibody levels can serve as a surrogate marker for protection against COVID-19 infection, identifying a valid and reproducible biomarker for antibody level and linking that with real-life clinical outcome is challenging. 20 However, several studies have independently investigated the humoral responses after COVID-19 vaccination. For example, in an observational study involving patients receiving dialysis in California, New Jersey, Tennessee, and Texas, USA, Garcia et al 8 reported that patients who received mRNA vaccines (BNT162b2, mRNA1273) had a better anti-body response compared to attenuated adenovirus vaccine (Ad26.COV2.S). Few studies have compared the head-to-head VE between different vaccine types. For example, Brunelli et al 6 reported that Ad26.COV2.S and BNT162b2 vaccines were equally effective within the first 6 months from vaccination among dialysis patients from the United States. Several studies have investigated the COVID-19 VE among patient receiving kidney replacement therapy. For example, in a retrospective cohort study involving maintenance dialysis patients in the United States, Manley et al 21 reported that the COVID-19 vaccines were 81% effective in preventing COVID-19-related hospitalization or death during the Delta wave. The author also concluded that low antibody level was associated with inferior COVID-19-related outcomes. 21 In a separate study using the US Department of Veterans Affairs COVID-19 Shared Data, Butt et al 3 reported that, after 14 days of administering the second dose of mRNA vaccines, the risk of infection among chronic hemodialysis patients was reduced by 68.2%. Our objective of comparing VE in maintenance dialysis patients from 2 regions within a large country with universal health care system, Canada, and describing the possible reasons for the observed differences was unique compared to all previously published research in this population. Our study findings are similar to the population-level study in France in which El Karoui et al 22 reported that the COVID-19 VE could vary by pandemic wave, ie, compared to the first wave the relative incidence of COVID-19-related hospitalization was lower during the second wave. As such, the observed variation in VE estimates between 2 Canadian provinces appeared to be plausible.
In Randomized controlled trials (RCTs) investigating the COVID-19 VE among healthy volunteers, 2 doses of COVID-19 vaccines were >94% effective in preventing symptomatic COVID-19 infection and >89% effective in preventing COVID-19-related severe outcomes.23,24 In an observational study including population-level community-dwelling adults from Ontario, Canada, Chung et al 25 reported that the VE of 2 doses of mRNA vaccines against COVID-19 infection and related severe outcome was 91% and 98%, respectively. In this study sample of maintenance dialysis patients from BC, Canada, 2 doses were 80% and 3 doses were 87% effective in preventing COVID-19 infections confirmed by RT-PCR. For COVID-19-related severe outcomes the efficacy ranged from 75% to 86%. The attenuated vaccine effectiveness in this study population appeared to be biologically plausible and was in line with other study findings.4,5
When compared the point estimates, the VE against COVID-19 infection among the maintenance dialysis patients from BC and Ontario appeared to differ. For example, compared to unexposed person time, exposure to 1 dose of COVID-19 vaccine was 64% effective in preventing RT-PCR COVID-19 infection among BC patients compared to only 41% among ON patients. This higher efficacy among BC patients could be explained by the absence of a pandemic wave in BC from December 2020 to February 2021 (small number of patients received first dose) while Ontario experienced a distinct wave. In addition, BC had a substantially lower infection rate from April to June 2021 when majority of the patients in both BC and Ontario received their first dose. These pandemic waves might have contributed to the reduced VE estimates for first dose in Ontario.
For the second dose, we also observed a higher VE among BC patients compared to those in Ontario, 80% versus 69%. This could be explained by the differences in timing of administering the second dose, ending of study period and background infection rate. In Ontario, second dose appeared to start early in March 2021 and the majority were administered from April to June 2021 in parallel to the first dose vaccination. In contrast, majority of the patients in BC received their first dose followed by second dose. The median time between the first and second dose was 77 days (IQR = 66-91) in BC versus 39 days (IQR = 28-56) in Ontario. Skowronski et al 26 reported that the VE of mRNA vaccines against COVID-19 infection was higher with a longer interval between first and second doses. In addition, the Ontario study ended on June 30, 2021. As such, both the vaccination with second dose and the COVID-19 infection outcomes were captured while Ontario experienced a pandemic wave (Figure 2). In contrast, among the BC patients none of the COVID-19 infections were recorded after exposure to second dose by June 30, 2021.
When compared the VE against the COVID-19-related severe outcomes, after vaccination with 1 dose, the VE among BC patients were slightly higher compared to Ontario patients, 54% versus 46%. However, VE after second dose appeared to be higher in Ontario compared to BC, 83% versus 75%. Again, this could be explained by the differences in vaccine roll out and time of recording the outcomes. All of these hospitalization or death related severe outcomes among Ontario patients were captured on or before June 30, 2021, the study end date. There was a 14-days lag period in order for a hospitalization to be attributable to a COVID-19 infection. Assuming that the distribution of COVID-19 variants in Ontario were similar to that of in overall Canada (Figure 2 and Supplementary Figures S1 and S2), the prevalence of Delta variant was low during this period, 5% on May 2 to 36% on June 13, 2021 (Supplementary Table S5). In contrast, all of the severe outcomes among BC cohort had occurred on or after August 5, 2021 by which Delta variant became predominant (>90%). Twohig et al 27 reported a significantly higher risk of hospital admission or emergency visit after infection with delta variants when compared with alpha variant. As such, the lower VE estimate after 2 doses in BC patients appeared to be plausible.
Among the factors internal to the study, extension of the study period might have contributed most to the observed differences in the VE estimates from BC and Ontario. For example, BC experienced higher case rates predominantly by Delta variants from August to December 2021 (Figure 1). Due to smaller cohort size in BC, the study period extension was necessary to capture sufficient study outcomes. The number of vaccine doses modeled in BC and Ontario studies were also different, 3 versus 2. However, both studies modeled the vaccine exposure in a time-dependent fashion in which VE of a dose was estimated compared to the pre-vaccination person-time. As such, this difference in number of doses in the model may not have substantial effect on the VE estimates. Vaccination status at cohort entry was also different in BC and Ontario study (Table 1). We believe that this was negligible as all study participants had started contributing to the appropriate exposure time in the time-dependent vaccine exposure variable. We assumed that the effect of small proportion (~2%) of patients in BC cohort who received ChAdOx1 (AstraZeneca) vaccine was not strong enough to contribute substantially in the differences in VE.
Despite having apparent variation in VE estimates, the formal test of significance indicated that the VE against both the COVID-19 infection and its related severe outcomes among the maintenance dialysis patients from BC and ON were not statistically significantly different. This finding aligns with the comparison of 95% CI of the VE estimates from BC and ON. It is important to note that observations on VE difference were made based on the point estimates of the VE. However, the 95% CIs from the BC and ON data overlapped with most of the point estimates, especially for the severe outcomes. So, caution must be exercised in intermeeting the results.
Our study has several strengths. First, the cohort of maintenance dialysis patients was derived from a population-based registry database in the province of BC. We believe that our findings represent the true VE among this study population in BC. Second, access to the patient level clinical data enabled us to accurately identify both the vaccination exposure and RT-PCR confirmed COVID-19 infections. Our study period was long and that enabled us to estimate VE against after all 3 doses. Our study also had a few limitations. The administrative definition used to identify COVID-19-related severe outcome could be overly sensitive with low specificity due to high underlying rate of hospitalization and mortality in the maintenance dialysis population. However, this definition was used in multiple retrospective cohort studies in evaluating the real-world COVID-19 VE.4,19,28,29 So, we expect our findings to be comparable to the literature. We did not have access to patient level data on the COVID-19 variant. However, we used publicly available data that enabled us to understand the distribution of variants over the study period. In addition, we used publicly available graphs to describe the differences in infection rates and vaccine roll outs in BC and Ontario. However, these graphs sufficiently served the purpose to understand the differences between 2 provinces. The Ontario study ended before the Omicron variant became predominant in Canada. The first case of Omicron in BC was identified at the end of November 2021. So, a few of the COVID-19 infections (<9%) in BC that were diagnosed in December 2021 could be due to Omicron. As such, VE estimates from both BC and Ontario were primarily against Alpha and Delta variants. Future studies are required to estimate the VE against the current Omicron variant. Future studies could also explore other methodologies in evaluating the effect of COVID-19 vaccines after accounting for nonpharmaceutical interventions including lockdown. 30 In addition, there could be other factors, for example dialysis unit level variations in the infection control measures and COVID-19 testing policies that may contribute to the regional variations in VE for which information is not recorded in administrative databases. Residual confounding may exist due to the inability to account for other potential risk factors such as obesity, smoking status, etc. Although, Kaplan-Meier (K-M) curve is ideal to illustrate the survival during follow-up, we did not display the K-M curve for multiple reasons. Compared to time-dependent vaccine exposure, the standard K-M estimator is appropriate for time-fixed covariate that is measured at baseline. Advanced methodologies exist for generating K-M-like curves for time-varying covariate.31,32 However, the extended KM curve cannot be interpreted as proper survival function due to the changing risk set over time.
In conclusion, our unique findings suggest that substantial differences in COVID-19 pandemic waves, infection rate, and vaccination strategies exist between provinces. Despite having these between province differences, the VE in BC and Ontario was not statistically significantly different from each other. Prior to the emergence of omicron and its subvariants, vaccination with the Health Canada approved COVID-19 vaccines (~98% mRNA type) were highly effective in preventing incident COVID-19 infection and COVID-19-related hospitalizations and death among maintenance dialysis patients from BC and Ontario, Canada. More vaccine doses provided better protection against both primary infection and the related severe outcomes. Future research could consider pooled analysis of dialysis data from multiple regions to estimate a nationally representative VE. It is also necessary to further investigate the VE against newer variants including Omicron.
Supplemental Material
sj-docx-1-cjk-10.1177_20543581231181032 – Supplemental material for COVID-19 Vaccine Effectiveness Among Patients With Maintenance Dialysis; Observations From Population Level Cohort Studies in 2 Large Canadian Provinces
Supplemental material, sj-docx-1-cjk-10.1177_20543581231181032 for COVID-19 Vaccine Effectiveness Among Patients With Maintenance Dialysis; Observations From Population Level Cohort Studies in 2 Large Canadian Provinces by Mohammad Atiquzzaman, Yuyan Zheng, Lee Er, Ognjenka Djurdjev, Joel Singer, Mel Krajden, Shabnam Balamchi, Doneal Thomas, Michelle Hladunewich, Matthew J Oliver and Adeera Levin in Canadian Journal of Kidney Health and Disease
Footnotes
Ethics Approval and Consent to Participate
This study was approved by the Clinical Research Ethics Board at the University of British Columbia, Canada (H21-02815-A002s). This was a retrospective cohort study using deidentified health administrative data. No human subject was recruited or contacted for the study purpose. So, consent to participate was not required.
Consent for Publication
All authors substantially contributed to the research work and consented for publication.
Availability of Data and Materials
The BC analysis was conducted using deidentified data from Patient Records and Outcome Management Information System (PROMIS). Study data can be accessed with approval from the concerned Ethics Board and the data steward.
Declaration of Conflicting Interests
The author(s) declared no potential conflicts of interest with respect to the research, authorship, and/or publication of this article.
Funding
The author(s) disclosed receipt of the following financial support for the research, authorship, and/or publication of this article: This work was supported by the COVID-19 Immunity Task Force (grant 2122-HQ-000071).
Supplemental Material
Supplemental material for this article is available online.
References
Supplementary Material
Please find the following supplemental material available below.
For Open Access articles published under a Creative Commons License, all supplemental material carries the same license as the article it is associated with.
For non-Open Access articles published, all supplemental material carries a non-exclusive license, and permission requests for re-use of supplemental material or any part of supplemental material shall be sent directly to the copyright owner as specified in the copyright notice associated with the article.