
Abstract
Background:
People living with chronic kidney disease (CKD) have identified diet as an important aspect of their life and care. Understanding current consumption patterns in this population, and how they relate to patient perspectives of dietary recommendations, may help identify and design potential dietary intervention strategies in CKD.
Objective:
To investigate the dietary intake patterns of people with advanced-stage CKD, as well as subjective perspectives regarding dietary recommendations from participants and their caregivers.
Design:
Mixed-methods study with a sequential explanatory design.
Setting:
Manitoba, Canada.
Participants:
Individuals with late-stage CKD (CKD stages G4-G5, including dialysis) participating in the Canadian Frailty Observation and Interventions Trial (CanFIT).
Methods:
First, quantitative data were collected via a cross-sectional dietary assessment, using three 24-hour dietary recalls, a 36-question short diet questionnaire (SDQ), and a Nutrition Quality of Life (NQoL) tool (n = 59). Second, qualitative data were collected during 2 focus groups (n1 = 12 and n2 = 7) held with a subsample of individuals who had completed the dietary surveys, along with their caregivers. Focus groups explored topics related to diet and CKD; transcribed data were analyzed thematically. In the interpretation stage, the qualitative findings were combined with the quantitative results to help explain the latter and reach a deeper understanding of the subjective experiences of adults with CKD.
Results:
Quantitatively, nearly all (48/51; 94%) participants (mean age 70.8 ± 10.8 years) reported energy intakes below recommendations and most (86%) did not achieve recommended fiber intake. In addition, 15/21 (71%) of patients on dialysis had low protein intake. Qualitatively, 2 themes were identified: (1) Lacking/Needing dietary guidance—incomplete “information overload,” and (2) Experiencing difficulty in adapting to restrictions. Within the former theme, participants spoke of getting too much information at once, often at the wrong time. Within the latter theme, participants spoke of a loss of appetite, and cheating on their dietary recommendations.
Limitations:
Potential recall bias recalling dietary patterns, small sample size limiting generalizability, self-selection bias.
Conclusion:
Despite the reported lifestyle changes made by individuals with CKD, which negatively impacted their lives, many had suboptimal nutrition, especially in terms of energy and fiber. In addition, those on dialysis were not eating enough protein, which could be due to changing dietary recommendations as CKD progresses. Qualitative findings provided additional insight into how requisite CKD-dietary changes were perceived and how participants coped with these changes. The timing and delivery of the dietary education within CKD care in Manitoba may not be working for people with CKD as they progress through the disease.
What was known before
People living with chronic kidney disease (CKD) have identified diet as an important aspect of their life and care. Malnutrition is common in CKD and potential consequences of malnutrition such as sarcopenia and frailty are associated with faster CKD progression; however, dietary interventions targeting frailty in CKD are limited. Current dietary recommendations for CKD change as the disease progresses, and these changes in recommendations can seem contradictory or overwhelming to patients, creating barriers to adherence.
What this adds
Understanding current consumption patterns of patients with CKD and how they relate to patient perspectives of dietary recommendations may help to identify and design potential dietary interventions strategies in CKD. To gain a comprehensive insight into consumption patterns in CKD, both quantitative and qualitative methods are required. We performed a mixed-methods study to characterize the dietary patterns of Canadians with CKD and investigate patient and caregiver perceptions around dietary strategies used in the treatment of CKD.
What impact this may have on practice or policy
This study provides information for nephrologists and renal dietitians about typical diets in their patient population and highlights areas of improvement in both the delivery of dietary education and the macronutrient (protein, fiber, calories) and micronutrient (sodium, phosphorous) intake.
Introduction
Malnutrition among those living with chronic kidney disease (CKD) and kidney failure is extremely prevalent and can contribute to poor clinical outcomes1 -4 such as frailty 5 and sarcopenia. 6 Providing dietary counseling and access to renal dietitians in the clinical setting is crucial for improving dietary patterns and outcomes. People living with CKD have identified diet as an important aspect of their care that can be empowering and can improve their health; however, contradictory advice and being overwhelmed with information has been reported to be a major barrier to following dietary recommendations. 7
Although the mechanisms leading to sarcopenia are not fully understood, both increased protein breakdown and decreased muscle protein synthesis are likely to contribute to this condition.8,9
Inadequate energy and protein intake resulting from CKD-related dietary restrictions may contribute to the development of sarcopenia, one of the hallmarks of protein energy malnutrition (PEM). 9 Protein energy malnutrition is highly prevalent in patients with CKD and is a strong predictor of morbidity and mortality 10 ; it is reported to be present in as many as 37% to 48% of patients with CKD, percentages that increase once kidney replacement therapy starts. 11 Malnutrition may affect 20% to 70% of dialysis patients, with 5% to 10% estimated to experience severe PEM.12,13
Individuals with CKD stages G4-G5 nondialysis CKD have lower recommendations for protein intake 14 compared with those undergoing hemodialysis (HD), home hemodialysis (HHD), and peritoneal dialysis (PD), who all have increased requirements for protein.10,14 The protein recommendations at the time when we conducted this study from the National Kidney Foundation’s Kidney Disease Outcomes Quality Initiative (KDOQI) clinical practice guideline for patients with CKD on HD, HHD, and PD were 1.0 to 1.2 g/kg of ideal body weight per day, 14 and the Essential Guide for Nutrition and Medical Therapy for CKD 1-5 Acute Kidney Injury and Transplant recommended 0.6 to 0.75 g/kg for CKD stage 4-5 without dialysis 15 (Supplementary Table 1). Recently, however, KDOQI updated clinical practice guidelines with a recommendation of a stricter limit of 0.55 to 0.60 g dietary protein/kg body weight/d in individuals with CKD G3-G5 who are metabolically stable. 14
When individuals progress to HD, data show that many do not meet the recommendations for a higher protein intake of >1.2 g/kg/d. 10 Furthermore, patients with CKD are also told to follow dietary patterns which limit the amount of phosphorus, potassium, and sodium they eat. 16 These dietary restrictions are aimed at keeping fluid, serum phosphorus, and serum potassium levels within range, but often result in limited food choices and unappetizing meals. Unfortunately, when trying to follow all these dietary recommendations, patients often do not eat enough.10,17,18
Understanding current consumption patterns of people with CKD and the underlying patterns and perceptions of dietary guidelines can inform clinical care and the delivery of dietary education, as well as future research in this area. Previous work in this area has been largely restricted to quantitative investigations,10,17-19 with some qualitative studies.7,20,21 Yet, neither method alone gleans a comprehensive insight into consumption patterns; such insight requires the involvement of both quantitative and qualitative methods. Therefore, the aims of this study were to characterize the dietary patterns of individuals with CKD using a series of dietary questionnaires, as well as to understand patient and caregiver perceptions around dietary strategies used in the treatment of CKD through the use of focus groups.
Methods
CanFIT Study Design
Individuals in the present study were recruited from the ongoing Canadian Frailty Observation and Interventions Trial (CanFIT), 22 a multicenter prospective cohort that has enrolled more than 600 adults with CKD since September 2012. The CanFIT study population was derived from 4 Canadian multidisciplinary kidney health clinics; 3 in the city of Winnipeg (Manitoba), including Seven Oaks General Hospital, St. Boniface General Hospital and Health Sciences Centre, and the Regina Qu’Appelle Health Region, in Regina (Saskatchewan). Individuals with stages G4 or G5 nondialysis CKD, defined as an eGFR <30 mL/min/1.73 m2 at baseline, were approached to participate. Individuals were excluded if they were incapable of informed consent, if they were unable to speak English, had a severe visual or hearing impairment, or were on a dialysis modality at the time of consent. 22 Participants receive annual assessments until a study endpoint of death, opt out, or loss to follow-up has been reached, or they have received one assessment 6 to 12 months after the initiation of kidney replacement therapy (after which time they are followed passively to ascertain outcomes such as death). At baseline and at each annual assessment thereafter, comorbidities, validated questionnaires, physical function tests, and physician and nurse impressions of frailty are recorded and chart review information (comprising laboratory results, adverse events, and additional comorbidities) collected. 22 All individuals participating in CanFIT who are pre-dialysis or on dialysis receive routine care from a multidisciplinary team, which includes standardized dietetic counseling from a renal dietitian.
Dietary Mixed-Methods Substudy
For this mixed-methods substudy, we invited CanFIT participants from the 3 Winnipeg sites to participate. Since initial recruitment into CanFIT, many participants had progressed to kidney failure requiring dialysis; these individuals were still included in the dietary substudy, however, those who had received a kidney transplant since enrolling in the main trial were excluded. Individuals residing in a personal care home at time of survey distribution were also excluded. Everyone who completed a survey was subsequently invited to participate in a focus group session with their primary caregiver.
This mixed-methods study followed a sequential explanatory design in which quantitative (dietary survey) data were collected first; next, qualitative (focus group) data were collected from a subsample of study participants who completed the dietary surveys. 23 In the interpretation stage, the qualitative findings were combined with the quantitative results to help explain the latter and reach a deeper understanding of the subjective experiences of adults with CKD. This study was approved by the University of Manitoba Bannatyne Research Ethics Board (HS14873 [H2012:001]).
Quantitative Data Collection
A dietary questionnaire package including three 24-hour dietary recalls, 24 a 36-question short diet questionnaire (SDQ), and a Nutrition Quality of Life (NQoL) tool25,26 was sent to eligible participants by mail. Self-reported daily dietary food intake was recorded in the three 24-hour dietary recalls. Participants were instructed to note the time of their meals, the location where the meal was consumed (e.g., home, restaurant, work), whether they were watching TV or on the phone during the meal, whether they were eating alone or with someone else, the type of food consumed (including information such as method of cooking, ingredients), and the amount consumed (in cups, tbsp, tsp, pcs, etc.). The SDQ consists of 36 questions asking participants how often they consume certain food items, such as “How often do you usually eat whole wheat breads, bran breads, multigrain breads, rye breads (sliced, crusty, hamburger bun, hot dog bun, etc.).” Possible answers include never, times per day, times per week, times per month, and times per year. The NQoL consists of 50 questions grouped into 6 categories: Food Impact, Self-Image, Psychological Factors, Social/Interpersonal, Physical, and Self-efficacy. Participants select “agree” or “disagree” for each question. Maximum scores in each category are 9, 6, 10, 7, 9, and 9, respectively, with higher values indicating greater nutrition-related quality of life.
Covariates
Data from participants’ most recent CanFIT assessment were extracted from the CanFIT database, including demographic data (age, sex, weight, height), treatment modality, comorbidities, laboratory values, as well as frailty status defined using the Fried criteria, which assesses 5 domains of frailty: slowness, weakness, weight loss, low activity, and fatigue. 22 Frailty was defined as the presence of significant deficits in at minimum of 3 of the 5 Fried domains.22,27,28
Quantitative Data Analysis
Individuals were categorized based on their treatment modality at the time of completion of the dietary questionnaires as follows: advanced CKD (stages G4-G5 nondialysis), HD or HHD, or PD. Daily macronutrient and micronutrient intakes were calculated from the three 24-hour dietary recalls using ASA24 Dietary Assessment Tool, 24 and compared with recommended amounts set by the Nutrition and Medical Therapy for CKD Stages 1 to 5, Acute Kidney Injury and Kidney Transplant manual, 15 used by all renal dietitians in the Manitoba Renal Program for counseling patients. Values were categorized into percent below target range, percent within range, and percent above range.
Dietary intake pattern data were collected using the SDQ and presented as foods in each category consumed per 7 days. The influence of diet on quality of life was measured by the NQoL survey.25,26 Missing data in the NQoL survey were handled by multiple imputations using the proc MI procedure in SAS. Values in each domain were summed together, and a global sum of all the domains was calculated. Descriptive statistics were expressed as mean ± standard deviation (SD) for symmetrically distributed variables; median and interquartile ranges for skewed variables; and percentages for categorical variables. Analyses were performed using SAS 9.4 (SAS Institute, Cary, North Carolina).
Qualitative Data Collection
Following the quantitative data collection, all participants who completed the survey portion of the study were invited to participate in focus groups, together with their primary caregiver. These focus groups were used to gain a deeper insight into the lived experiences of patients with CKD and to investigate their caregivers’ perceptions of the dietary strategies used in the treatment of CKD that could not be captured via quantitative data. Two focus groups were conducted in multipurpose rooms at Seven Oaks General Hospital, and facilitated by trained patient engagement coordinators. Facilitators asked participants open-ended questions about diet and CKD, barriers to following dietary recommendations, and dietary protein sources (Supplementary Table 2). All participants were included in the group discussions, and the facilitators used a flexible discussion guide including 5 main questions; probing questions or re-directs were also asked by the facilitators if further clarification was needed or topics strayed from original focus. Focus groups were audio recorded and transcribed verbatim. No priming was conducted before or during the sessions.
Qualitative Data Analysis
Qualitative data were analyzed thematically, 29 with the transcripts coded in parallel by 2 authors (S.C. and Y.I). Qualitative coding means naming segments of data with a label that simultaneously categorizes, summarizes, and accounts for each piece of data. In coding the qualitative materials, we followed Charmaz’s recommendations to conduct coding in 2 main phases, namely, initial coding and focused coding. 30 First, in vivo, line-by-line coding was performed, and then the most relevant codes and categories, that emerged both within and across participants, were developed by organizing them into meaningful themes. 31 This 2-stage analysis permitted the iterative development of a coding guide, which we systematically applied, refined, and discussed by the authors until consensus was reached. Data saturation (akin to statistical significance in quantitative studies) was reached when no new themes were identified with the subsequent focus group. 32
Results
Study Population
Of the 450 Winnipeg-based CanFIT participants, 242 individuals were alive and actively being followed, and were sent study questionnaire packages. Of these 242, 72 individuals completed and returned the questionnaires—a response rate of 29.8%. Participants who were on a different treatment modality at the time of their last CanFIT assessment compared with the time of completion of the questionnaires were excluded from analyses, yielding a study sample of 59 individuals. Two focus groups with a total of 19 participants (12 in Focus Group 1, 7 in Focus Group 2) were held in December 2019 and February 2020.
Quantitative Results
Descriptive characteristics
Table 1 summarizes the clinical characteristics of the study population at the time of their most recent CanFIT assessment. Most participants were males (69.4%), with a mean age of 70.8 ± 10.8 years old. Median body mass index (BMI) across the study groups was in the overweight category. The CKD stages G4-G5 nondialysis participants had lower creatinine levels than HD/HHD and PD patients (265.3 μmol/L ± 132.7 vs 665.7 ± 125.1 and 672.9 ± 185.1, respectively; P < .0001). The participants with CKD stages G4-G5 nondialysis had higher mean systolic blood pressures, 137.9 mm Hg ± 14.8 versus 130.4 mm Hg ± 16.3 (HD/HHD) and 124.1 mm Hg ± 16.0 (PD), P = .04; lower phosphate levels, 1.3 mmol/L ± 0.3 versus 1.6 ± 0.3 (HD/HHD) and 1.6 ± 0.4 (PD), P = .01; and higher albumin levels, 37.2 g/L ± 3.4 versus 35.0 ± 2.3 (HD/HHD) and 34.4 ± 2.7 (PD), P = .02. There were no differences between groups in any demographic or frailty measures.
Demographic, Clinical, Laboratory, and Comorbid Characteristics at the Time of the Most Recent CanFIT Trial Assessment, Stratified by Current Modality Type (n = 59).
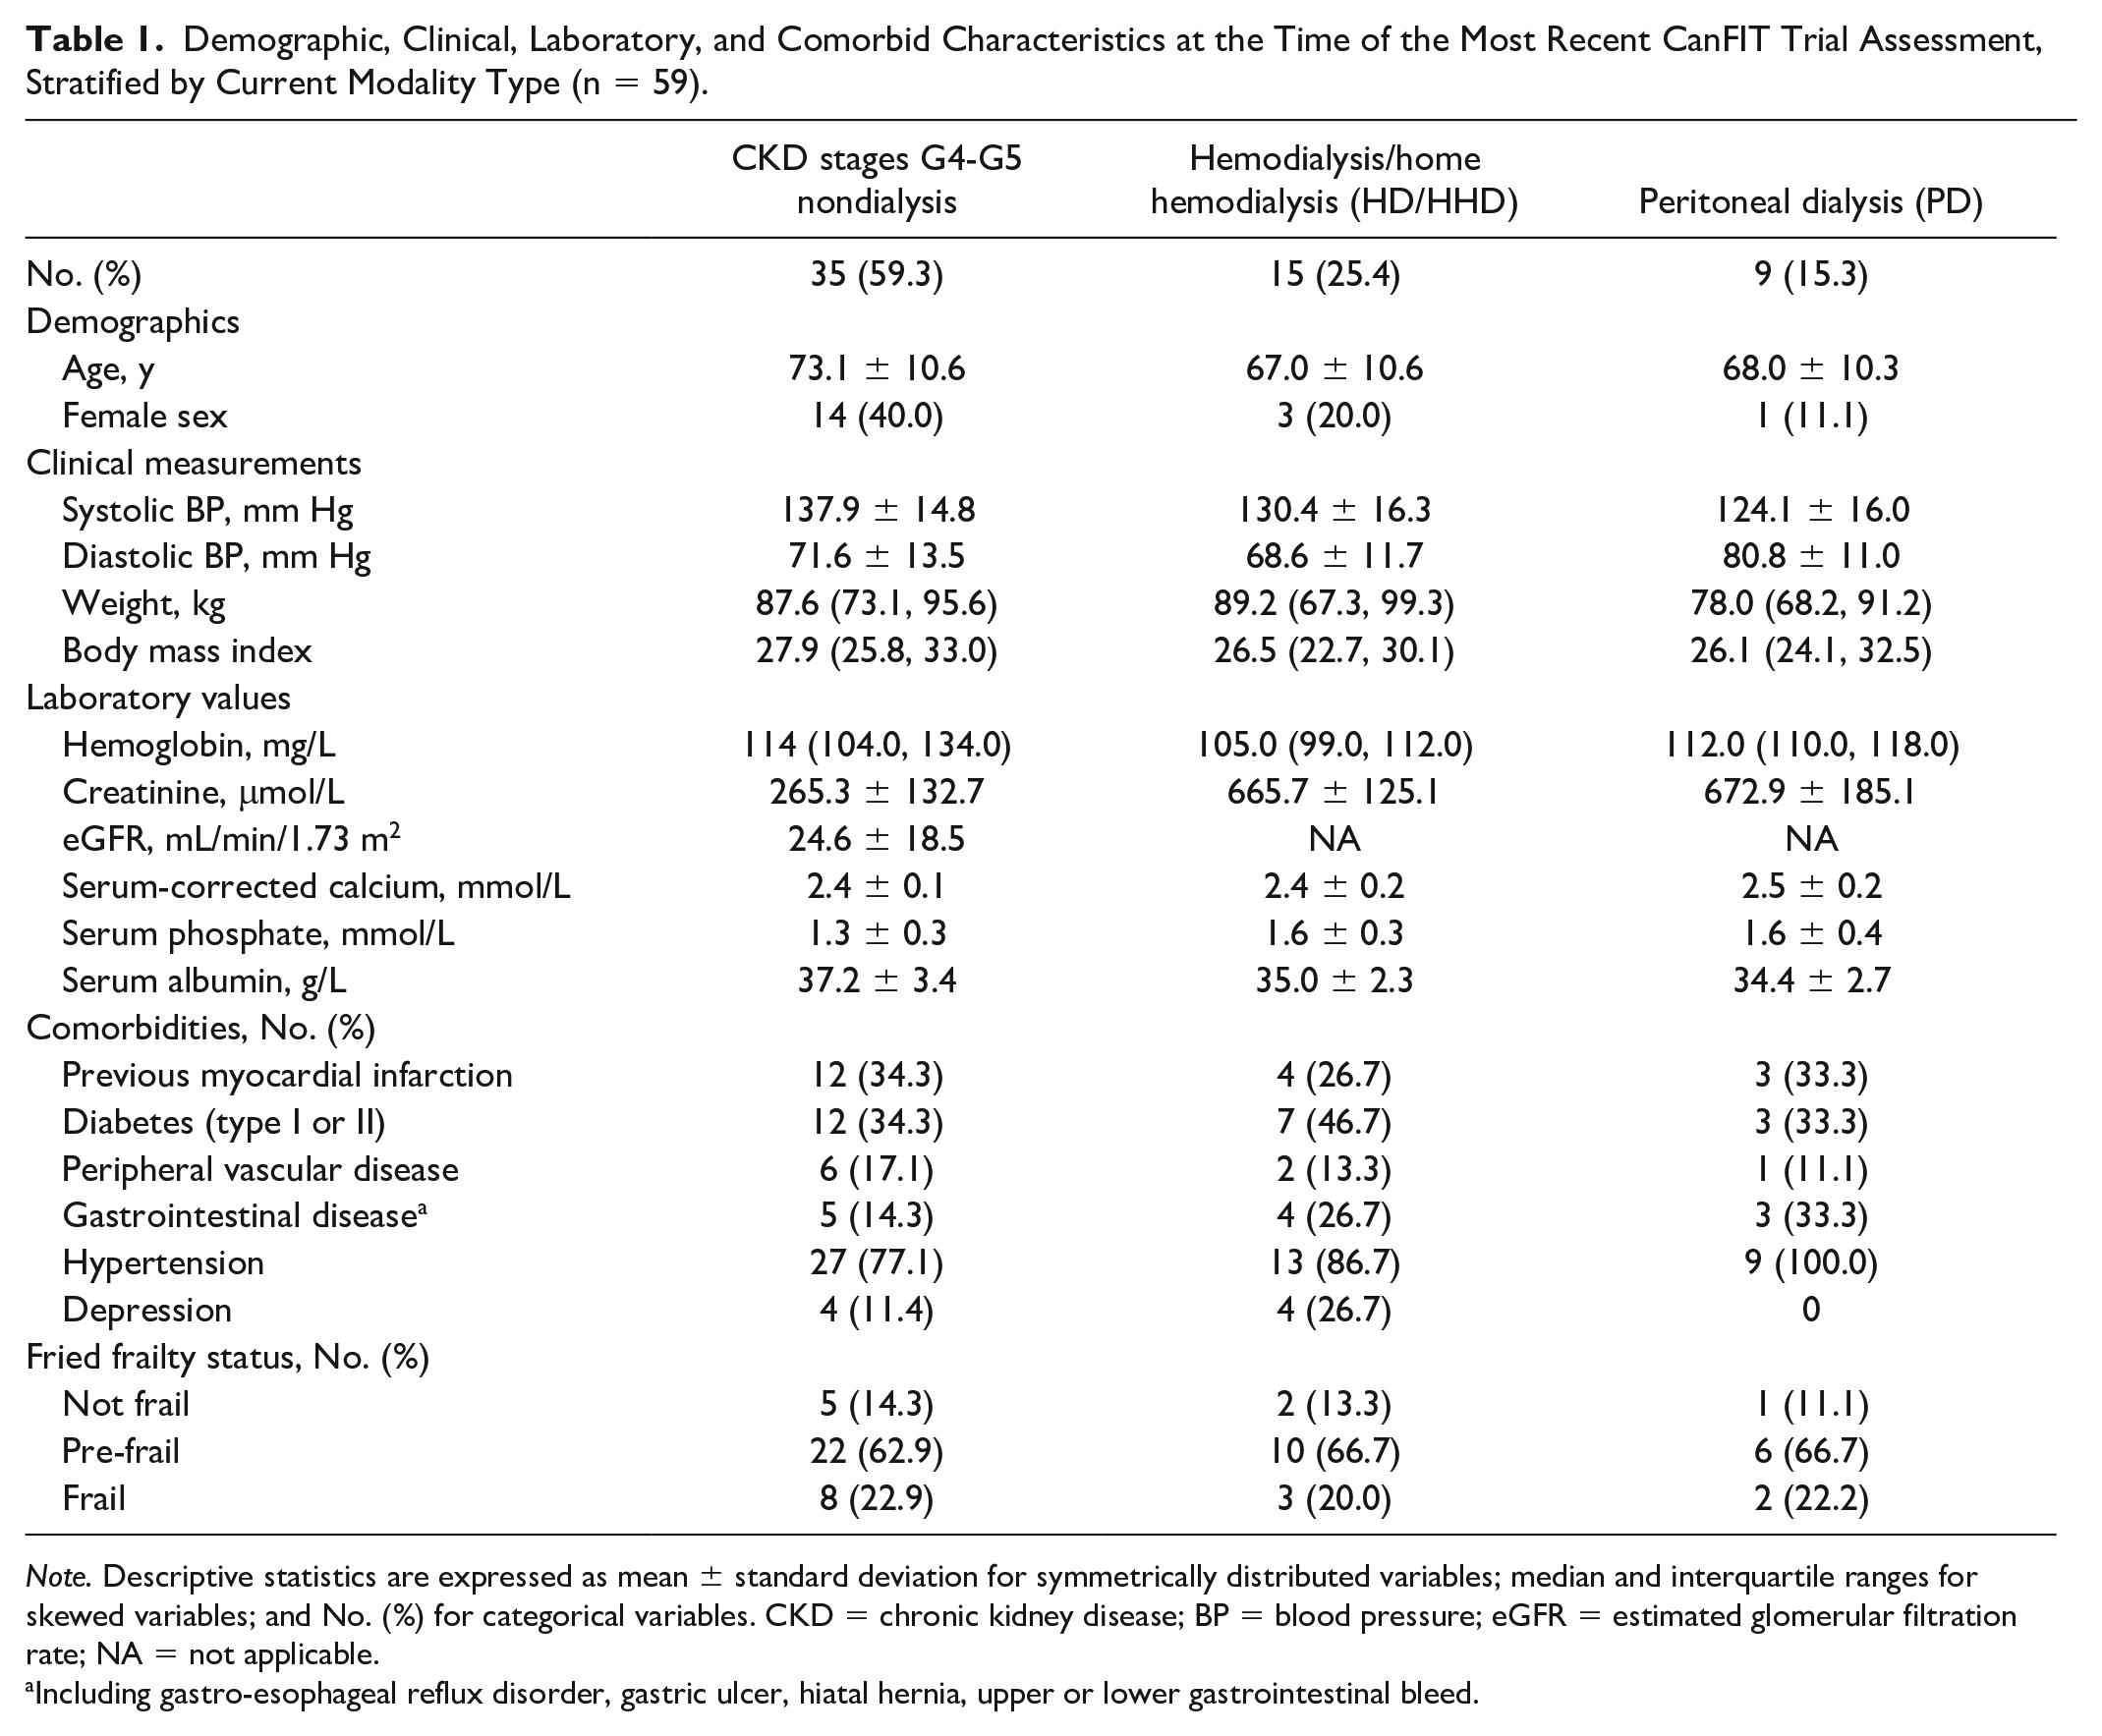
Note. Descriptive statistics are expressed as mean ± standard deviation for symmetrically distributed variables; median and interquartile ranges for skewed variables; and No. (%) for categorical variables. CKD = chronic kidney disease; BP = blood pressure; eGFR = estimated glomerular filtration rate; NA = not applicable.
Including gastro-esophageal reflux disorder, gastric ulcer, hiatal hernia, upper or lower gastrointestinal bleed.
Daily intake of macronutrients and micronutrients
Fifty-one of the 59 patients completed the 3-day food recalls. Of these 51, 30 had CKD stages G4-G5 nondialysis, 13 were receiving HD/HHD, and 8 were receiving PD. Daily intake of macronutrients and percentages that were below, within, or above target range by treatment modality based on The Nutrition and Medical Therapy for CKD 1-5, Acute Kidney Injury and Transplant manual 15 are summarized in Table 2. The majority of each cohort was below the recommended range for energy intake only 7.7% of HD/HHD, 12.5% of PD participants were within recommended range, while 0% of stages G4-G5 nondialysis met requirements for energy. Average carbohydrate consumption for stages G4-G5 nondialysis, HD/HHD, and PD were 172.2, 185.9, and 179.6 g, respectively. The average protein per kilogram in all 3 groups was 0.9 g/kg. Sixty percent of the nondialysis group consumed more protein than recommended, and the majority of HD/HHD and PD cohorts consumed less protein than recommended at 61.5% and 87.5%, respectively. No participants consumed below target range for total fat; 63.3% of the nondialysis group, 45.2% of HD/HHD, and 87.5% of PD were above the target range. Most participants in each cohort were below target range for fiber consumption; 100% were below range for the HD/HHD cohort. Overconsumption of phosphorus and sodium was seen in all 3 cohorts (Table 3).
Daily Intake of Macronutrients, and Proportion of Individuals Above, Below, and Within the Targets as Recommended by the Nutrition and Medical Therapy for CKD Stages 1 to 5, Acute Kidney Injury and Kidney Transplant Manual.

Note. Summary statistics given as mean and standard deviation for normally distributed variables, median and interquartile range for non-normally distributed variables, and percentages for categorical variables. Target ranges were adapted to each stage using the Nutrition and Medical Therapy for CKD Stages 1 to 5, Acute Kidney Injury and Kidney Transplant manual—the manual currently in use by dietitians in the Manitoba Renal Program for standardized patient dietetic counseling. CKD = chronic kidney disease; IQR = interquartile range.
Daily Intake of Micronutrients, and Proportion of Individuals Above, Below, and Within the Targets as Recommended by the Nutrition and Medical Therapy for CKD Stages 1 to 5, Acute Kidney Injury and Kidney Transplant Manual.

Note. Summary statistics given as mean and standard deviation for normally distributed variables, median and interquartile range for non-normally distributed variables, and percentages for categorical variables. Target ranges were adapted to each stage using the Nutrition and Medical Therapy for CKD Stages 1 to 5, Acute Kidney Injury and Kidney Transplant manual—the manual currently in use by dietitians in the Manitoba Renal Program for standardized patient dietetic counseling. CKD = chronic kidney disease; NA = not applicable.
NQoL tool
No differences were seen in nutrition quality of life scores between participant groups (Table 4). Nondialysis participants reported a median score of 42.0 (36.0, 45.0) out of 50, whereas HD/HHD reported 39.0 (23.5, 40.5) and PD reported 37.5 (35.5, 43.0).
Nutrition Quality of Life (NQoL) Subscales, and Total Summed Score, Stratified by Modality Type.

Short diet questionnaire
Supplemental Table 2 lists the major food categories listed in the SDQ. In terms of the main protein meats, all 3 study groups consumed relatively similar amounts weekly. Dairy products were consumed at least weekly for all groups. All groups reported limiting consumption of salty snacks and sweets.
Qualitative Results
Participants spoke of the substantial amount of dietary information that they needed to learn and incorporate into their daily lives once their disease had advanced. The abruptness and rapidity of dietary guidance and change were not perceived to align with the time between early treatment to advanced disease.
When [participant] was first told he had to start dialysis, we had education up our yin yang. It was almost to a point that it was information overload, and you get to a point where you hear 35% of what they’re saying and you remember 15% of that and so it’s a lot of information to absorb all at once. (Family member of someone on dialysis)
Despite the volume of dietary education, participants felt like their questions had not been adequately addressed by their healthcare professionals.
. . . You talk to the nutritionist, and I have to admit I gave the nutritionist a real hard time when I was going to these so called clinics at [name of hospital]. I had questions for her like you wouldn’t believe and it got to a point where she said okay, I have to stop you there because I have more patients to see and she up and left. So, my next time, when I went in it was about 3 months later I refused to talk to her and I never talked to her for a year. (Person with lived experience of CKD)
Participants also described how dietary guidance was received several years after diagnosis; a point, which they believed, would have been better received at first diagnosis to help them prepare for the requisite changes.
. . . It might be more beneficial if you’ve got patients that are pre-dialysis that still have a functioning kidney. It might be beneficial that maybe something be pointed out to them that look, if you’re heading in this direction, going into dialysis, you need to start changing your diet to get ready for dialysis.” (Person with lived experience of CKD)
Finally, a person with lived experience dialysis wondered if dietary guidance would have slowed or halted disease advancement, such that they did not “think [they] would have been on dialysis now.”
In light of the volume, and interrupted delivery of dietary education, it is unsurprising that participants spoke of difficulties adapting to restrictions. In fact, some participants described dietary changes as being the greatest challenge. A person with lived experience captures this theme with the comment “the stressful part wasn’t the blood pressure test, wasn’t talking to the nurse, it wasn’t even talking to the doctors. It was talking to the dietitian because I knew I wasn’t keeping up with the diet.”
Adaptations were further compounded by the dual challenges of a loss of appetite and the desire to deviate from dietary guidance.
The first subtheme, “loss of appetite,” captures how participants reported little desire to eat, and how they quickly achieved satiety when eating. Participants spoke of a lack of tolerance, had no taste or appetite, and noted that “the smell [of food being cooked] turns my brain off.” These challenges were also noted by caregivers, who spoke of how quick these desires were lost once the patient started dialysis.
. . . All of the [loss of] taste and everything progressed probably in the last eight, nine years, and then it just dropped out of sight. When dialysis came on it was completely gone. Completely gone, it was just like he was another person born into this body with a completely different inside system. (Person with lived experience of dialysis)
The second subtheme, “cheating,” reflects the duality of cheating born out of a desire to eat restricted foods, and eating any foods that they could tolerate regardless of dietary advice. A small number of people with lived experience described how they “really ignore” dietary advice, and “don’t care what I eat as long as I eat. So whatever is around I’ll have it.” More commonly, participants noted that they simply ignored dietary advice completely because of the difficulty adapting to restrictions, coupled with a lack of tolerance. As one family member described, “It’s got to a point now, he just eats what he knows is going to stay down, so we are not following a kidney diet anymore.”
Discussion
In this mixed-methods study of adults with CKD and their caregivers, we quantitatively assessed dietary intake patterns of 51 individuals with CKD, and found that 94% had low energy intake, 71% of dialysis patients had low protein intake, and 86% had low fiber intake. We also found that intakes of micronutrients such as sodium and phosphorous were often above recommended levels. In a series of qualitative focus groups, participants described how requisite CKD dietary changes were perceived and how participants coped with these changes. Taken together, these findings provide insight into the burden of requisite dietary changes for the treatment of CKD and provide exploratory findings to support future research.
Similar to our study’s findings regarding energy intake, a study of 599 individuals with CKD stages 3 to 5 not on dialysis in Taiwan found that 56.6% consumed calories at <90% of recommended levels (KDOQI 1823.1 kcal/d; 30-35 kcal/kg/d). 17 In this previous study, low energy intake (≤90% recommendation) was significantly related to worsening GFR, compared with moderate (90%-100% recommendation) and high energy intake (>110% recommendations).
Higher dietary protein intakes pre-dialysis have been shown to be a predictor of poor kidney health outcomes.19,33 We found that 60% of participants with CKD stages G4-G5 non-dialysis were over the recommended protein daily intake of 0.6 to 0.75 g/kg, 15 whereas 61.5% and 87.5% of the HD/HHD and PD cohorts were below target range.
Qualitative findings offer insight as to why protein intake targets were not being achieved. Participants described the burden of incorporating substantial dietary changes into their daily lives while concurrently managing severe disease. For some, these dietary changes were the most difficult part of disease management, and further exacerbated by a general lack of appetite or taste. As such, dietary guidance was often modified or dismissed. Across many populations, dietary change is difficult.34,35 For individuals managing life-limiting conditions, such as CKD, changes in treatment modalities and their corresponding dietary adjustments may need to be emphasized and supported to a greater degree. Specific to CKD, patients may require in-center hemodialysis thrice-weekly at an average of 4 hours a session. These sessions provide an ideal opportunity for patient education, including discussions with dietitians to address issues of food aversion or rapid satiety. Similarly, interventions, such as the provision of specialized and tailored meals to patients, may be possible during these sessions.10,20
The National Kidney Foundation KDOQI states that due to impaired energy metabolism in patients with CKD, the recommended values help maintain neutral nitrogen balance and nutritional status. 14 In our study, we found that 94% of patients failed to meet their daily recommended energy intake of 30 to 35 kcal/kg. Several studies have shown that those with higher body weight tend to survive longer on dialysis.19,36 In the general population, obesity is associated with increased cardiovascular risk and decreased survival. In patients on dialysis, however, an “obesity paradox” or “reverse epidemiology” has been consistently reported, that is, a higher BMI is paradoxically associated with better survival.36,37 This survival advantage of large body size is relatively consistent for HD patients across racial and regional differences, although published results are mixed for PD patients. 36 It can be theorized that both larger muscle mass and higher body fat may provide longevity, whereas thinner body habitus and weight loss are associated with higher mortality. 37
Data from an analysis of 14 543 participants in the National Health and Nutrition Examination Survey III demonstrated that high dietary total fiber intake was associated with lower risk of inflammation and mortality in kidney disease and the associations were stronger in magnitude in those with CKD compared with individuals without CKD. 38 In our study, we found only 6% of participants met the recommended fiber intake of 20 to 30 g/d. Despite sources of fiber such as bread, fruit, and vegetable consumption reported by participants, many were still not meeting the recommended fiber intake. Dietary fiber is important for the CKD population because fiber traps water in the intestinal lumen, helping to prevent constipation and attenuating fluid overload. Furthermore, colonic transit times are a factor involved in the regulation of bacterial protein fermentation and consequently in uremic toxin production.39,40 In a 2015 review of 14 trials, dietary fiber supplementation was shown to reduce serum urea and creatinine levels. 41 Unfortunately, dietary guidelines in CKD that recommend low intake of a certain nutrient or mineral may consequently limit other foods that may be beneficial to patients; for example, recommendations to adhere to low potassium foods often requires individuals to limit foods that are high in fiber, subsequently resulting in low fiber intake.
There are clinical and research implications of our findings. From a clinical perspective, our study provides valuable data to nephrologists and renal dietitians about areas for improvement in terms of dietary education timing and content, as well as macronutrient (protein, fiber, calories) and micronutrient (sodium, phosphorous) intake in the CKD population. Re-educating patients about changing dietary recommendations during the progression of CKD should be prioritized by care teams. Our findings also suggest that additional research into targeted supplementation, of protein and/or fiber in particular, in the dialysis population is warranted.
A strength of our study was that we used a mixed-methods design to develop a deeper and broader understanding of dietary consumption patterns and behaviors in CKD. In addition, our participants were recruited from the CanFIT study, a population followed longitudinally and has been well characterized for CKD and frailty. As well, the dietary recommendations we used as standards are the exact ones provided by dietitians to the sample we evaluated. However, our study had several limitations. This study’s dietary intake data were based on self-report. Self-reported data can be affected by an external bias caused by social desirability or approval. 42 Self-reported data may also suffer from recall bias, especially pertaining to the three 24-hour food recalls. The effect of recall bias has been investigated extensively in the literature, with particular focus on survey methods for measuring dietary or food intake. 42 Moreover, food recall has other limitations such as patient compliance with instructions, missing or inaccurate recording of food items, and inability to capture seasonal or other cycling variations in dietary pattern. 43 As well, the small sample size may not be fully representative of the CKD and dialysis populations. Furthermore, we do recognize that there may be a self-selection bias at play that is prevalent in most survey-based research. There are a number of social factors that we could not control for, for example, socioeconomic status, food insecurity, or employment status, that would impact who would or would not participate in completing either the survey package or the subsequent focus groups. In addition, at baseline in the CanFIT study, individuals with cognitive and/or visual impairments were excluded, and because the study has been ongoing for many years, individuals may have developed impairments since baseline that would preclude them from participating in the current substudy. Future research should be conducted exploring dietary patterns and perceptions in marginalized and underrepresented groups, as well as those with physical and cognitive impairments, and interventions and guidelines should focus on how best to tailor dietary programming in CKD clinics to address the issues that are unique to these groups. Despite these limitations, our study provides data suggesting that individuals in the Canadian CKD population may be consuming an inadequate amount of energy, protein, and fiber than recommended for their condition, providing valuable preliminary data for future research that can further inform clinical practice and the development of interventions.
Conclusion
Patients with CKD and on dialysis may be at increased risk of negative outcomes due to insufficient protein, energy, and fiber intake. These findings are apparent in participants with stages CKD G4-G4 nondialysis, but even more so among patients on dialysis. More research is needed to investigate the associations between low-energy and low-protein diets with frailty in CKD, with the addition of focus groups to get a better understanding of patients’ daily experiences and possible struggles with adhering to dietary recommendations. As well, future randomized controlled trials of interventions could investigate incorporating protein, energy, and fiber sources that may decrease the progression of sarcopenia, frailty, and potentially CKD, while monitoring safety to ensure there is no worsening kidney function.
Supplemental Material
sj-docx-1-cjk-10.1177_20543581221140633 – Supplemental material for Dietary Patterns and Perceptions in Older Adults With Chronic Kidney Disease in the Canadian Frailty Observation and Interventions Trial (CanFIT)
Supplemental material, sj-docx-1-cjk-10.1177_20543581221140633 for Dietary Patterns and Perceptions in Older Adults With Chronic Kidney Disease in the Canadian Frailty Observation and Interventions Trial (CanFIT) by Derek Sin, Oksana Harasemiw, Sarah Curtis, Yasmin Iman, Jeann Buenafe, Julia DaCosta, Rebecca C. Mollard, Navdeep Tangri, Jennifer L. P. Protudjer and Dylan Mackay in Canadian Journal of Kidney Health and Disease
Footnotes
Acknowledgements
The authors would like to thank the people with lived experience of CKD who participated and made this study possible.
Ethics Approval and Consent to Participate
This study was approved by the University of Manitoba Bannatyne Research ethics board (HS14873(H2012:001). All participants provided consent to participate.
Consent for Publication
All the authors provide consent for publication.
Availability of Data and Materials
The de-identified data underlying this article will be shared on reasonable request to the corresponding author.
Declaration of Conflicting Interests
The author(s) declared no potential conflicts of interest with respect to the research, authorship, and/or publication of this article.
Funding
The author(s) disclosed receipt of the following financial support for the research, authorship, and/or publication of this article: This work was supported by a Manitoba Medical Services Foundation (Award # 8-2019-05).
Trial Registration
Not a trial requiring registration.
Supplemental Material
Supplemental material for this article is available online.
References
Supplementary Material
Please find the following supplemental material available below.
For Open Access articles published under a Creative Commons License, all supplemental material carries the same license as the article it is associated with.
For non-Open Access articles published, all supplemental material carries a non-exclusive license, and permission requests for re-use of supplemental material or any part of supplemental material shall be sent directly to the copyright owner as specified in the copyright notice associated with the article.