
Abstract
Purpose of review:
Delayed graft function (DGF) is a significant complication that contributes to poorer graft function and shortened graft survival. In this review, we sought to evaluate the current and emerging role of medical imaging modalities in the assessment of DGF and how it may guide clinical management.
Sources of information:
PubMed, Google Scholar, and ClinicalTrial.gov up until February 2021.
Methods:
This narrative review first examined the pathophysiology of DGF and current clinical management. We then summarized relevant studies that utilized medical imaging to assess posttransplant renal complications, namely, DGF. We focused our attention on noninvasive, evolving imaging modalities with the greatest potential for clinical translation, including contrast-enhanced ultrasound (CEUS) and multiparametric magnetic resonance imaging (MRI).
Key findings:
A kidney biopsy in the setting of DGF can be used to assess the degree of ischemic renal injury and to rule out acute rejection. Biopsies are accompanied by complications and may be limited by sampling bias. Early studies on CEUS and MRI have shown their potential to distinguish between the 2 most common causes of DGF (acute tubular necrosis and acute rejection), but they have generally included only small numbers of patients and have not kept pace with more recent technical advances of these imaging modalities. There remains unharnessed potential with CEUS and MRI, and more robust clinical studies are needed to better evaluate their role in the current era.
Limitations:
The adaptation of emerging approaches for imaging DGF will depend on additional clinical trials to study the feasibility and diagnostic test characteristics of a given modality. This is limited by access to devices, technical competence, and the need for interdisciplinary collaborations to ensure that such studies are well designed to appropriately inform clinical decision-making.
Introduction
The kidney is the most transplanted solid organ in the world and is the treatment of choice for patients with end-stage kidney disease. This is reflected in Canadian statistics showing a 41% increase in the total number of kidney transplants performed from 2010 and 2019. 1 Despite increased perioperative risk and higher mortality in the first 3 months posttransplantation compared with remaining on hemodialysis, 2 patient survival and quality of life after transplant are improved in the long term, as are overall costs.3,4
Posttransplant complications affect long-term graft and patient outcomes.5,6 Delayed graft function (DGF) is a common and important early complication. The DGF is most often defined as an acute kidney injury (AKI) requiring at least 1 session of dialysis in the first week after transplant. There are, however, many definitions used in the literature, from dialysis-based definitions, creatinine-based definitions, or a combination of both. 7 Patients may also be falsely classified as having DGF if they require dialysis for reasons such as hyperkalemia or volume overload, in spite of having acceptable posttransplant glomerular filtration. 8 In the immediate posttransplant period, DGF prolongs hospital stay, increases health care costs, and increases patient morbidity.
Risk factors for the development of DGF include both donor- and recipient-related characteristics, as well as organ preservation and transplant-related parameters. 9 The most contemporary estimates of the incidence of DGF range from 25% to 30%. 10 Even in the modern era of deceased donor kidney transplant, DGF continues to be an important risk factor for biopsy-proven acute rejection (adjusted relative hazard in DGF [vs no DGF] was 1.55, 95% confidence interval [CI]: 1.03–2.32). 6
Given the implications of DGF on short- and long-term transplant outcomes, approaches to help predict perioperative graft function and guide care are being actively studied. For example, the correlation of various urinary and serum biomarkers with the histopathological features seen in DGF continues to be investigated. 11 Another approach has been the innovative use of medical imaging techniques. In this narrative review, we focus on the latter, taking a bench-to-bedside approach to the use of diagnostic imaging in the setting of DGF. We first review the pathophysiology of renal ischemia-reperfusion injury (IRI) and other molecular events that take place during DGF. We discuss how available medical imaging techniques are currently being used in the posttransplant setting. We then review novel medical imaging modalities that are currently being tested, linking their technical capabilities with our current understanding of IRI and their potential role in the assessment of DGF.
Methods
We searched for relevant literature on PubMed and Google Scholar using text words for the main concepts of “kidney transplant,” “delayed graft function,” and the broad concept of “imaging” up to February 2021. Similar keywords were used to search for active trials registered on ClinicalTrials.gov. We focused on English-language, peer-reviewed articles. Internal and external peer review was performed as part of the Kidney Research Scientist Core Education and National Training (KRESCENT) program.
Review
IRI, Anaerobic Metabolism, and Cellular Stress on DGF
During transplantation, IRI occurs in the kidney from when cross-clamping is performed during organ retrieval (or earlier in the setting of donation after cardiac death), followed by cold organ preservation to when the kidney is removed from ice and reperfused.12,13,14 When blood supply is restored to the organs after transplantation, it may elicit a pathophysiological response accompanied by an inflammatory immune response and initiation of cell death/survival pathways.15,16 The magnitude and duration of warm and cold ischemia increase the extent of injury to the renal allograft.
Endothelial cells and tubular epithelial cells are the first cell types injured by IRI and metabolic stress. 17 Ischemic injury results in hypoxia, depletion of adenosine triphosphate (ATP) in the mitochondria of cells, and reduction in intracellular pH, which then switch to anaerobic metabolism. The ATP depletion results in impairment of Na+/K+ pumps and reductions in Ca2+ efflux, leading to Ca2+ overload inside the cell. This generates reactive oxygen species (ROS) and nicotinamide adenine dinucleotide phosphate (NADPH) oxidases.18,19 Several studies have also indicated that ROS play a crucial role in regulating hypoxia-inducible factors (HIFs) during normoxia and hypoxia.20-22 Hypoxia-inducible factors promote adaptation to hypoxia and are important regulators of the molecular signaling pathways associated with IRI.23-25 (Figure 1). There have also been several studies suggesting the initial protective role of HIF-1 and HIF-2 during IRI.26-29

Schematic representation showing ischemic injury.
IRI Leads to Cell Damage and Cell Death: Consequences of DGF
The IRI may cause irreversible cell damage and initiation of multiple cell death pathways such as apoptosis, necrosis, or necroptosis (Figure 2). 30 Apoptosis is a form of programmed cell death that is accompanied by changes in cell morphology such as blebbing, cell shrinkage, and nuclear fragmentation. The characteristic molecular pathway involves activation of receptors such as FS-7-associated cell surface antigen (Fas), tumor necrosis factor α (TNFα), and TNF-related apoptosis-inducing ligand (TRAIL) receptors. These result in the recruitment of death domain containing proteins such as Fas-associated death domain (FADD) protein and TNF receptor type 1–associated death domain (TRADD) protein and activation of caspases, leading to apoptosis.15,30,31 Necrosis, a type of nonprogrammed cell death, is characterized by cell swelling, mitochondrial dysfunction, membrane rupture, and leakage of cellular contents. The leaked cellular contents act as danger-associated molecular patterns (DAMPs) that initiate innate and adaptive immune response, including infiltration of inflammatory cells and release of cytokines, thus leading to cell death.32-34 Recently, necroptosis, which is a controlled form of necrosis, has emerged as a crucial pathological process, which changed the current understanding of cell death. 35 Morphologically, necroptosis is characterized by swelling of the organelles, which is further accompanied by loss of the integrity of the cell membrane and deficiency of nuclear chromatin content. 36 As such, cellular stress activates certain serine/threonine kinases called receptor-interacting proteins (RIPs), particularly RIP1 and RIP3, which together with FADD and TRADD form a complex leading to phosphorylation of mixed lineage kinase domain-like pseudokinase (MLKL) resulting in membrane puncturing, ROS production, and ultimately necroptotic cell death.15,35,37 Finally, autophagy is also crucially involved in IRI. Autophagy performs housekeeping functions in the cell to remove damaged organelles and protein aggregates so as to help the cell deal with stresses such as hypoxia, mitochondrial dysfunction, and nutrient deprivation.38,39 It was also reported that downregulation of autophagy is associated with the severity of IRI in mice kidneys with overexpression of C-reactive proteins. 40
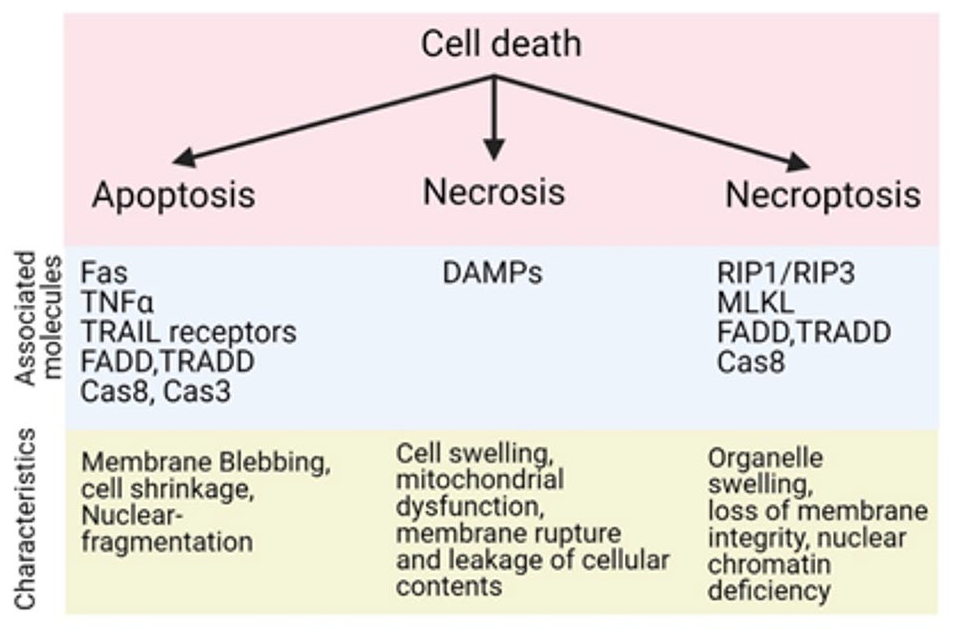
Flow chart representing various types of cell deaths and molecules associated with IRI in kidney.
The pathophysiology of IRI is not fully understood. It is a dynamic and multifactorial process involving inflammatory immune responses, damage to the endothelial cells, and tubular epithelial cells of the kidney, among others. Studies suggest that renal cells may undergo epithelial to mesenchymal transition mediated by transforming growth factor β (TGFβ), which plays an important role in interstitial fibrosis. 41 In addition, endothelial cell injury results in vascular remodeling involving cell death, cell growth, changes in extracellular matrix, and adventitial and interstitial fibrosis. 42 Together, this tissue remodeling due to the IRI and maladaptive repair in the kidney may result in luminal obstruction, chronic hypoxia from vascular injury, and loss of functional renal mass.14,43 Appreciating the underlying cellular pathology, the associated early physiological changes and their timelines can assist in the development of new medical imaging tools which can identify subtle changes that may precede the clinical manifestations which culminate in DGF.
Currently Available Imaging in the Posttransplant Setting: Renal Ultrasound (US)
Medical imaging already plays a significant role in diagnosing and managing complications that may arise posttransplant. Renal US is a noninvasive, inexpensive, and routinely available imaging modality that can be done at the bedside. 44 Grayscale (B-mode) is used for structural evaluation, whereas Doppler modes are used to assess blood flow. The US imaging is often routinely ordered in the first few postoperative days. It is also ordered in the setting of DGF and with new or worsening kidney dysfunction. The US can easily and accurately diagnose gross structural abnormalities, such as urinary obstruction, perinephric fluid collections (seroma, hematoma, urinoma, and abscess), renal artery or vein stenosis, arteriovenous fistula, or infarcts. 45 The US findings may also be supplemented with nuclear medicine renal scans (eg, DTPA [diethylenetriaminepentaacetic acid] or MAG3 [mercaptoacetyltriglycine]) to further characterize collecting system abnormalities. 46
In the setting of DGF due to microscopic parenchymal changes such as injury due to acute tubular necrosis (ATN) or acute rejection (AR), posttransplant US may still be informative, but is nondiagnostic. Changes due to ATN or rejection are often subtle and nonspecific on the US due to the poor soft tissue contrast of this modality. 47 Findings may include increased cortical echogenicity, loss of corticomedullary differentiation, focal or diffuse parenchymal edema, and reduced/reversed/absent end-diastolic flow. Renal arterial resistive index (RI), a common Doppler-based metric that is based on renal blood flow measurements, is defined as (peak systolic velocity – end-diastolic velocity) / peak systolic velocity. Initially developed as a potential method to assess microvascular flow within the kidney, RI may be influenced by multiple factors, such as anatomical placement of the probe, increased intra-abdominal pressure, pulse rate, use of calcineurin inhibitors, high body mass index (BMI), or even atherosclerosis. 48 Accordingly, RI has not been able to distinguish between ATN and AR. 49
The Kidney Biopsy
A kidney biopsy serves as the gold-standard method to determine the etiology of DGF once gross structural complications have been ruled out with conventional US, as described above. Once a tissue sample is obtained, histology along with certain molecular classifiers can be used to determine the cause of DGF.
The ATN is the leading cause of DGF due to compromised blood flow and long preservation time, which, upon reperfusion, leads to IRI.50,51 It is characterized by pathognomonic histological changes of the tubules such as diffuse or focal tubular dilatation, loss of brush border epithelium in the tubular epithelial cell lining, vacuolization, and nuclear content changes, eg, loss of nuclei or presence of nucleoli (Figure 3A). The ATN specifically shows coagulative-type necrosis and detachment of tubular cells from tubular basement membrane as shown in Figure 3B and 3C. 52 As a consequence of the damage to the cell, fluid oozes out through the denuded membrane, leading to interstitial edema53,54

Hematoxylin and eosin (H&E, ×100)–stained kidney tissue depicting characteristic features of acute tubular necrosis such as (A) tubular cell luminal dilatation and loss of brush border epithelium or (B) and (C) coagulative-type necrosis and detachment from basement membrane (adapted from Gaut & Liapis 52 with permissions).
AR, another important but less common cause of DGF, is characterized by lymphocyte cell infiltration in the interstitium and tubules in the kidney. Banff Lesion Scores assess the presence and the degree of characteristic histopathological changes in the different compartments of renal transplant biopsies. 55 Inflammation in nonscarred areas of cortex with eosinophils, neutrophils, or plasma cells and mononuclear cells in the epithelium of the cortical tubules are defining lesions of acute T cell–mediated rejection (TCMR). Inflammation within glomeruli along with inflammation within peritubular capillaries by leukocyte infiltration are features of antibody-mediated rejection (AMR). Binding of anti-donor HLA antibodies causes complement-dependent tissue damage via complement pathway activation. C4d staining of peritubular capillaries and medullary vasa recta, a marker of complement activation, is used as a stable marker for graft tissue damage due to AMR.
The benefits of having a diagnostic biopsy, when indicated, are weighed against the known risks. Kidney biopsies are invasive and associated with risks of bleeding, arteriovenous fistula formation, and urinoma formation. Other considerations include patient anxiety and discomfort, the costs associated with a prolonged hospital admission, and the risk of having a nondiagnostic biopsy from tissue sampling bias.56,57 The complication rate varies depending on clinical factors such as blood pressure, uremia-associated platelet dysfunction, and uncorrected coagulopathies. Technical factors that affect complication risks include the experience of the operator, the gauge of the biopsy needle, and the degree to which imaging is used for guidance during the procedure. As such, the reported rate of complications has ranged widely, between 0.06% and 13%,58,59 but only a minority of patients require intervention. For the purposes of counseling and consent, the risk is generally quoted at a 1.6% (1 to 2 in 100) risk of macroscopic hematuria requiring blood transfusion, 0.3% (1 in 300) risk of bleeding requiring angiography for embolization, and substantially lower risks for graft loss or death. 59
Evolving, Noninvasive Medical Imaging Techniques
Given the inherent risks associated with a kidney biopsy and the limitations of current imaging modalities, there is a need for other noninvasive modalities to evaluate renal allograft injury. Although computed tomography (CT) scans are routinely available, they are generally limited by the need for nephrotoxic iodinated contrast agents to better visualize the parenchyma. 5 Several evolving medical imaging techniques have the potential to contribute to the perioperative transplant course. Herein, we focus on 2 modalities that have the greatest potential for clinical translation in nephrology due to their versatility, ease of use, and safety: contrast-enhanced ultrasound (CEUS) imaging and multiparametric magnetic resonance imaging (MRI). Other modalities for imaging the kidney (eg, positron emission tomography [PET], elastography-based approaches, laser speckle Doppler) were not reviewed given the paucity of data, but this may change as registered clinical studies using these techniques remain active.
Renal CEUS
The CEUS imaging is gaining ever-increasing acceptance to complement the low specificity of Doppler US imaging in the kidney transplantation setting. 60 The core premise behind CEUS is the use of US contrast agents as shown in Figure 4A. These are micrometer-sized (1-10 µm diameter) bubbles made from an inert lipophilic gas core, stabilized by a lipid, protein, or polymer outer shell. 61 These metabolically inert contrast agents do not induce an immune response from the host and travel through the microcirculation unimpeded, with similar velocity to red blood cells. 62 The gas content of the microbubbles is excreted via the lungs within 10 to 15 minutes of administration, whereas the shell components are metabolized either through the liver or filtered by the kidney. 63 The microbubble-driven signal enhancement in CEUS is a direct consequence of the increased acoustic impedance mismatch between the gas of the bubble and the surrounding blood and tissue. 64 The microbubbles undergo vigorous compressions and expansions (ie, stable oscillations) in the presence of US pulses, producing strong backscattered acoustic signals in the 1 to 10 MHz range of diagnostic US imaging. 65 At low mechanical index, the harmonic oscillations of the microbubbles permit increases in the signal-to-noise ratio, enabling real-time visualizations of flow and identification of anatomical/flow-related abnormalities 66 (Figure 4B). In addition, microbubbles are also capable of quantifying tissue perfusion (Figure 4C). This is achieved via the intentional collapse (ie, cavitation) of the microbubbles by increasing the mechanical index of the incident US beam. 67 This facilitates the visualization of the replenishment of the vascular space, permitting kinetic/spatiotemporal studies of tissue perfusion.

(A) Schematic illustrating the core concepts of contrast-enhanced ultrasound imaging. The intravenous injection of microbubbles can be accompanied by either (B) low mechanical index oscillations which facilitates the visualization of blood flow or (C) a temporary increase in mechanical index which results in microbubble destruction. The later leads to refilling of the vascular compartment, permitting quantification of the replenishment kinetics (adapted from Roberts & Frias 61 with permissions).
Given these capabilities of CEUS and successes in imaging the perfusion of focal liver lesions, 68 it is perhaps not surprising that the utility of CEUS for assessing the perfusion characteristics of kidney allografts has been investigated.48,69-76 The CEUS offers a multitude of quantitative parameters which, unlike Doppler findings, are directly correlated to the microvascular perfusion of the graft. Figure 5A to D shows representative CEUS images from a normal renal transplant. 77 Upon the administration of the microbubble contrast bolus, a normal transplant will demonstrate enhancement of the arteries within the first 20 seconds (Figure 5A). In the early parenchymal phase (20-45 seconds), the cortex shows enhancement first while the renal pyramids appear hypoechoic (Figure 5B). Between 45 and 120 seconds, contrast progresses from the inner to the outer medulla until the entire parenchyma is homogenously enhanced along the cortex (Figure 5C). The washout of the contrast agents occurs concurrently in the cortex and the medulla after 2 to 5 minutes (Figure 5D). The time-intensity curve (TIC) (Figure 5E) is generated by detecting the perfusion of the microbubbles in a selected area within the kidney. 78 Several parameters from the TIC, such as the time to peak (TTP), peak intensity (PI), and area under the curve (AUC), are used to analyze the perfusion patterns from kidneys. A transplant affected by chronic rejection shows weaker, inhomogeneous contrast enhancement with a lower and delayed TTP, PI, and overall AUC. 60 Generally, in kidneys exhibiting DGF, the corticomedullary phase of the CEUS enhancement appears later and with lower AUC values than normal grafts, suggesting decreased vascular volume. 75

(A)-(D) Representative contrast-enhanced ultrasound images from a normal renal transplant from a 33-year-old male showing the various stages of contrast enhancement in the span of 2 to 5 minutes (adapted from Morgan et al 77 with permissions). (E) Schematic of the time-intensity curve illustrating the wash-in and wash-out effects of the microbubbles, as well as the TTP, PI, and AUC metrics (adapted from Pecere et al 78 with permissions).
Multiparametric Renal MRI
Over the past decade, renal MRI has emerged as a promising technique for evaluating various aspects of renal pathophysiology.79,80 The MRI is noninvasive, offering multiparametric results within a single modality. It can be helpful with obese patients where US can be technically challenging, or to assess deeper structures (eg, fluid collections) in the abdomen and pelvis. 81 The MRI provides several versatile modes and permits interrogations of both kidney morphology (Figure 6A) and functionality (Figure 6B-6D). 82 Blood oxygen level–dependent MRI (BOLD-MRI, Figure 6B) can assess changes in renal tissue oxygenation by measuring the paramagnetic activity of deoxyhemoglobin. 82 Diffusion biomarkers derived from Diffusion Weighted Imaging MRI (DWI-MRI, Figure 6C) measures the propensity of water protons to diffuse to surrounding tissue. 83 The apparent diffusion coefficient (ADC) depends on the renal architecture, microvascular perfusion, and tubular flow. Moreover, diffusion tensor imaging (DTI-MRI) provides additional data on the direction of movement. 84 Arterial spin labeling (ASL-MRI, Figure 6D) is a family of techniques that allows for measurement of the spin in arterial blood water, allowing for perfusion measurements.85,86 Other applications in the transplant setting have also included (1) evaluations of renal length and medullary volume in screening kidney transplant recipients and predicting subsequent graft failure 87 ; (2) measurement of renal perfusion as a means for monitoring graft kidney function 88 ; and (3) dynamic contrast-enhanced MRI for calculating glomerular filtration rate in patients with renal artery stenosis and urinary obstruction. 89

Variations of MRI imaging in the kidney. (A) Conventional MRI imaging provides morphological evaluation of the kidney anatomy. Functional evaluations can be conducted using (B) BOLD for measuring deoxyhemoglobin content, (C) ADC in DWI for assessing water movement, (D) ASL for measuring blood perfusion (adapted from Cox et al 82 with permissions).
Can Renal CEUS and Multiparametric MRI Distinguish Between ATN and AR?
Several studies have looked at the ability of CEUS to differentiate ATN from AR. Over a decade ago, an small study of 14 patients showed that CEUS could help differentiate between ATN and AR by using parameters such as the cortical to medullary ratio of regional blood flow, mean transit time, and TTP enhancement (Figure 5E). 71 Following this, Grzelak et al performed CEUS on 28 patients with DGF, 10 of whom had biopsy-proven AR and the other 18 with biopsy-proven ATN. Although all patients had a delay in the inflow of the contrast medium to the cortex and renal pyramids, the delay was more significant in patients with AR than in those with ATN. 72 Similarly, Fischer and colleagues demonstrated significant temporal delay in the wash-in signal between the renal artery and cortex in patients with AR. 69 Although they noted that large perirenal hematomas also show an inflow delay (proportional to the size of the hematoma), the finding remains valuable in the setting of DGF where large hematomas are not visualized. Jin and colleagues developed a simple index to identify kidney transplant AR derived from 23 cases of biopsy-proven AR, 10 cases of ATN, and 24 normal cases. 90 The index was based on eGFR and the difference in rising time between the medulla and cortex (ΔRTm-c), which is influenced by transplant kidney swelling, increased conspicuity of the medullary pyramids, and medullary pyramid enlargement in AR. Depending on the cutoff used, the index had a sensitivity or specificity of up to 91%. As shown in Figure 7A, a stable transplant reveals homogenous parenchymal enhancement with a positively skewed, smooth TIC curve. 90 The latter rises rapidly, reaching PI as the microbubbles enter the cortex. After a fast decrease (<20 seconds), the flow of the agents from the cortex to the medulla is manifested as a second peak, which declines in about 20 seconds. Both AR and ATN kidneys show a coarser TIC, with slower ascending and descending rates compared with the stable graft. Moreover, AR kidney show very rapid fluctuations in signal amplitude (Figure 7B) that not as pronounced in ATN kidneys (Figure 7C). Further study of the index in other early renal transplant populations is needed to validate this imaging biomarker. There are currently 2 clinical trials underway on the use of CEUS in detecting early transplant complications (clinicaltrials.gov NCT02911714 and NCT02733029). Both are assessing the ability of CEUS to differentiate AR from other causes of dysfunction. Results from these trials will provide additional evidence on the utility of CEUS in the early posttransplant setting. The clinical adaptation of the use of CEUS in kidney imaging is facilitated by guidelines published by the European Federation of Societies for Ultrasound in Medicine and Biology 91 and the recent founding of the International Contrast Ultrasound Society. 73
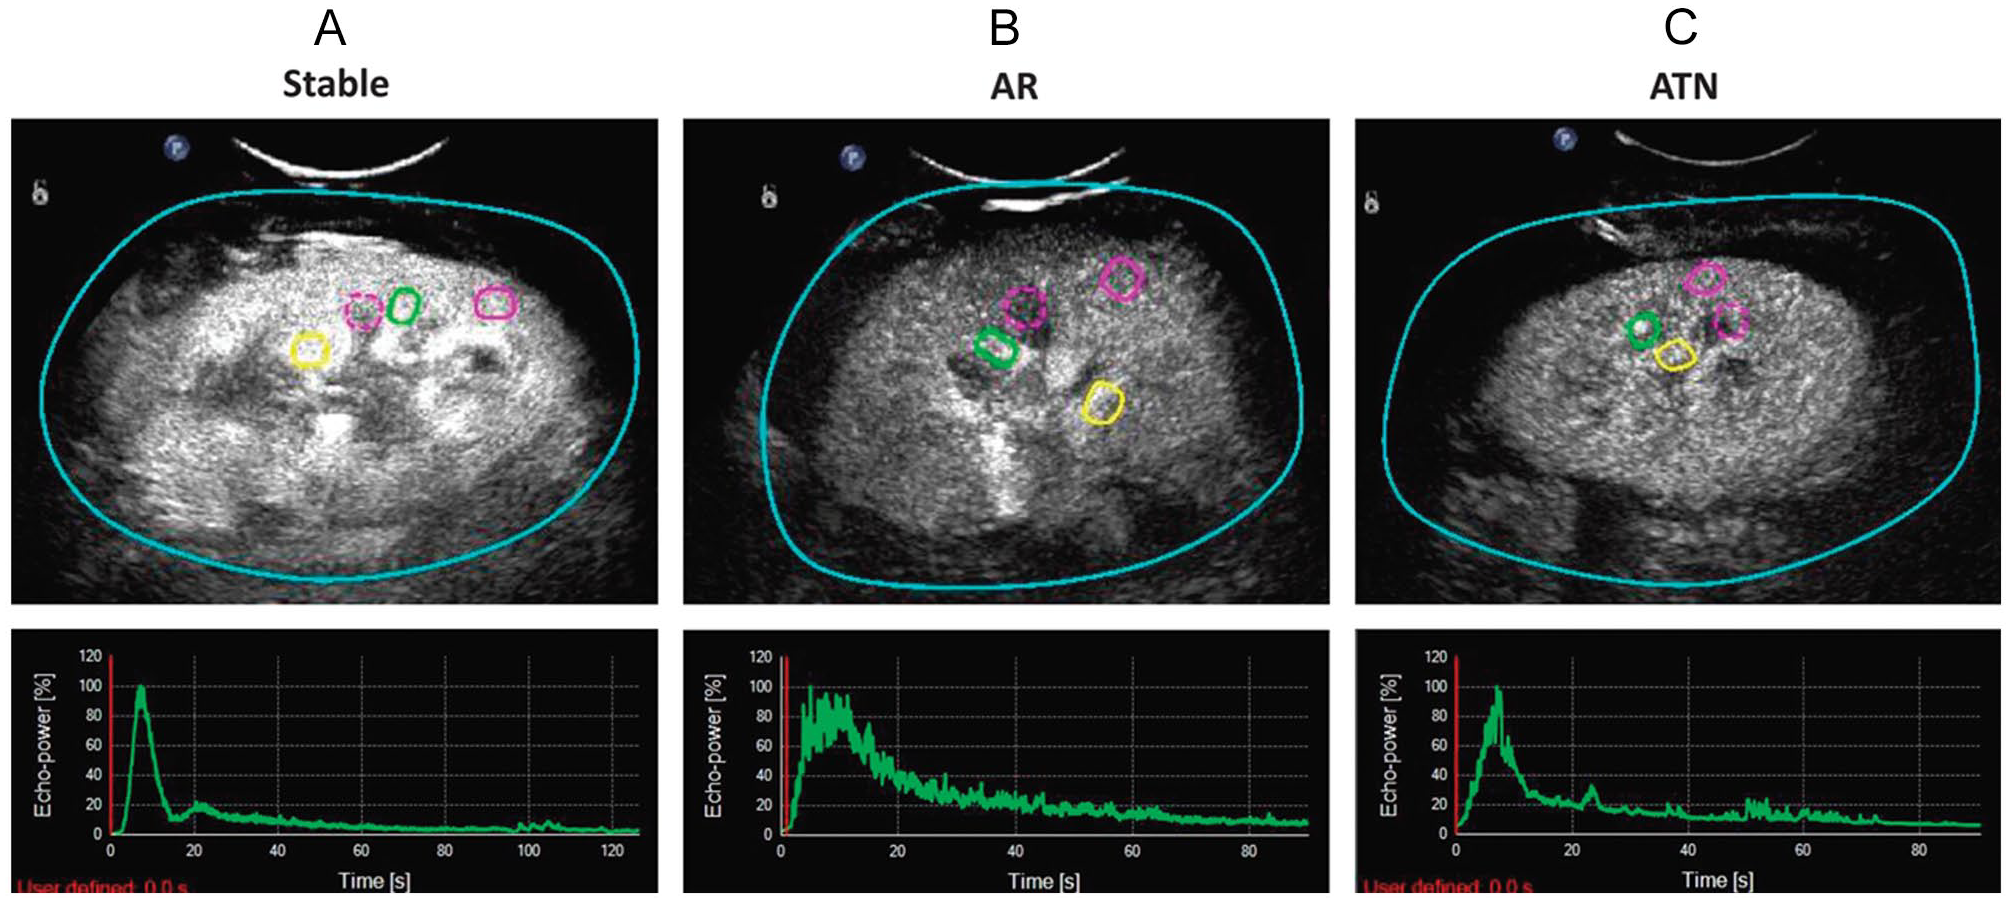
Representative contrast-enhanced ultrasound images (top row) and time-intensity curves (bottom row) from grafts with (A) stable function and biopsy-confirmed (B) acute rejection and (C) acute tubular necrosis indications of delayed graft function. The colored regions of interests denote the segmental artery (yellow), interlobar artery (green), medulla (purple dotted), and cortex (purple solid) (adapted from Jin et al 90 with permissions).
Various types of multiparametric functional MRI modes have been investigated for their capacity to better characterize DGF into AR and ATN. Figure 8 shows representative functional MRI images of healthy kidneys and DGF kidneys. As early as 2006, Djamali and colleagues investigated the use of BOLD-MRI to assess changes in medullary oxygen bioavailability in allografts with DGF. 92 Using deoxyhemoglobin as an endogenous contrast agent (as indicated by R2* levels) on 23 patients, they found that medullary R2* were highest in patients with normal functioning kidneys, and significantly lower in patients with DGF. Among those with the latter, medullary R2* was lower in patients with acute rejection compared to those with ATN (Figure 8). The same pattern was seen with the medullary:cortical R2* ratio. Subsequent studies also found significant differences in medullary R2* level between kidneys with DGF due to ATN or AR.93,94 These findings indicate that MRI may be useful as an adjunctive tool to help determine the need or timing of when to perform a kidney biopsy (ie, if BOLD-MRI findings are more suggestive of ATN, one may feel more comfortable waiting to see whether the patient improves functionally). The BOLD-MRI was less helpful in differentiating subtypes of acute rejection (TCMR vs AMR)92,93; thus, if findings were more consistent with AR, a biopsy would still be required to confirm AR subtype and appropriate treatment. Larger cohorts of patient scans will inform the utility of BOLD-MRI as a noninvasive tool in the setting of DGF. Multiparametric MRI is an actively evolving modality with other MRI modes (DWI-MRI, DTI-MRI, and ASL-MRI) also showing value in differentiating immediate graft function from DGF.87,95-99
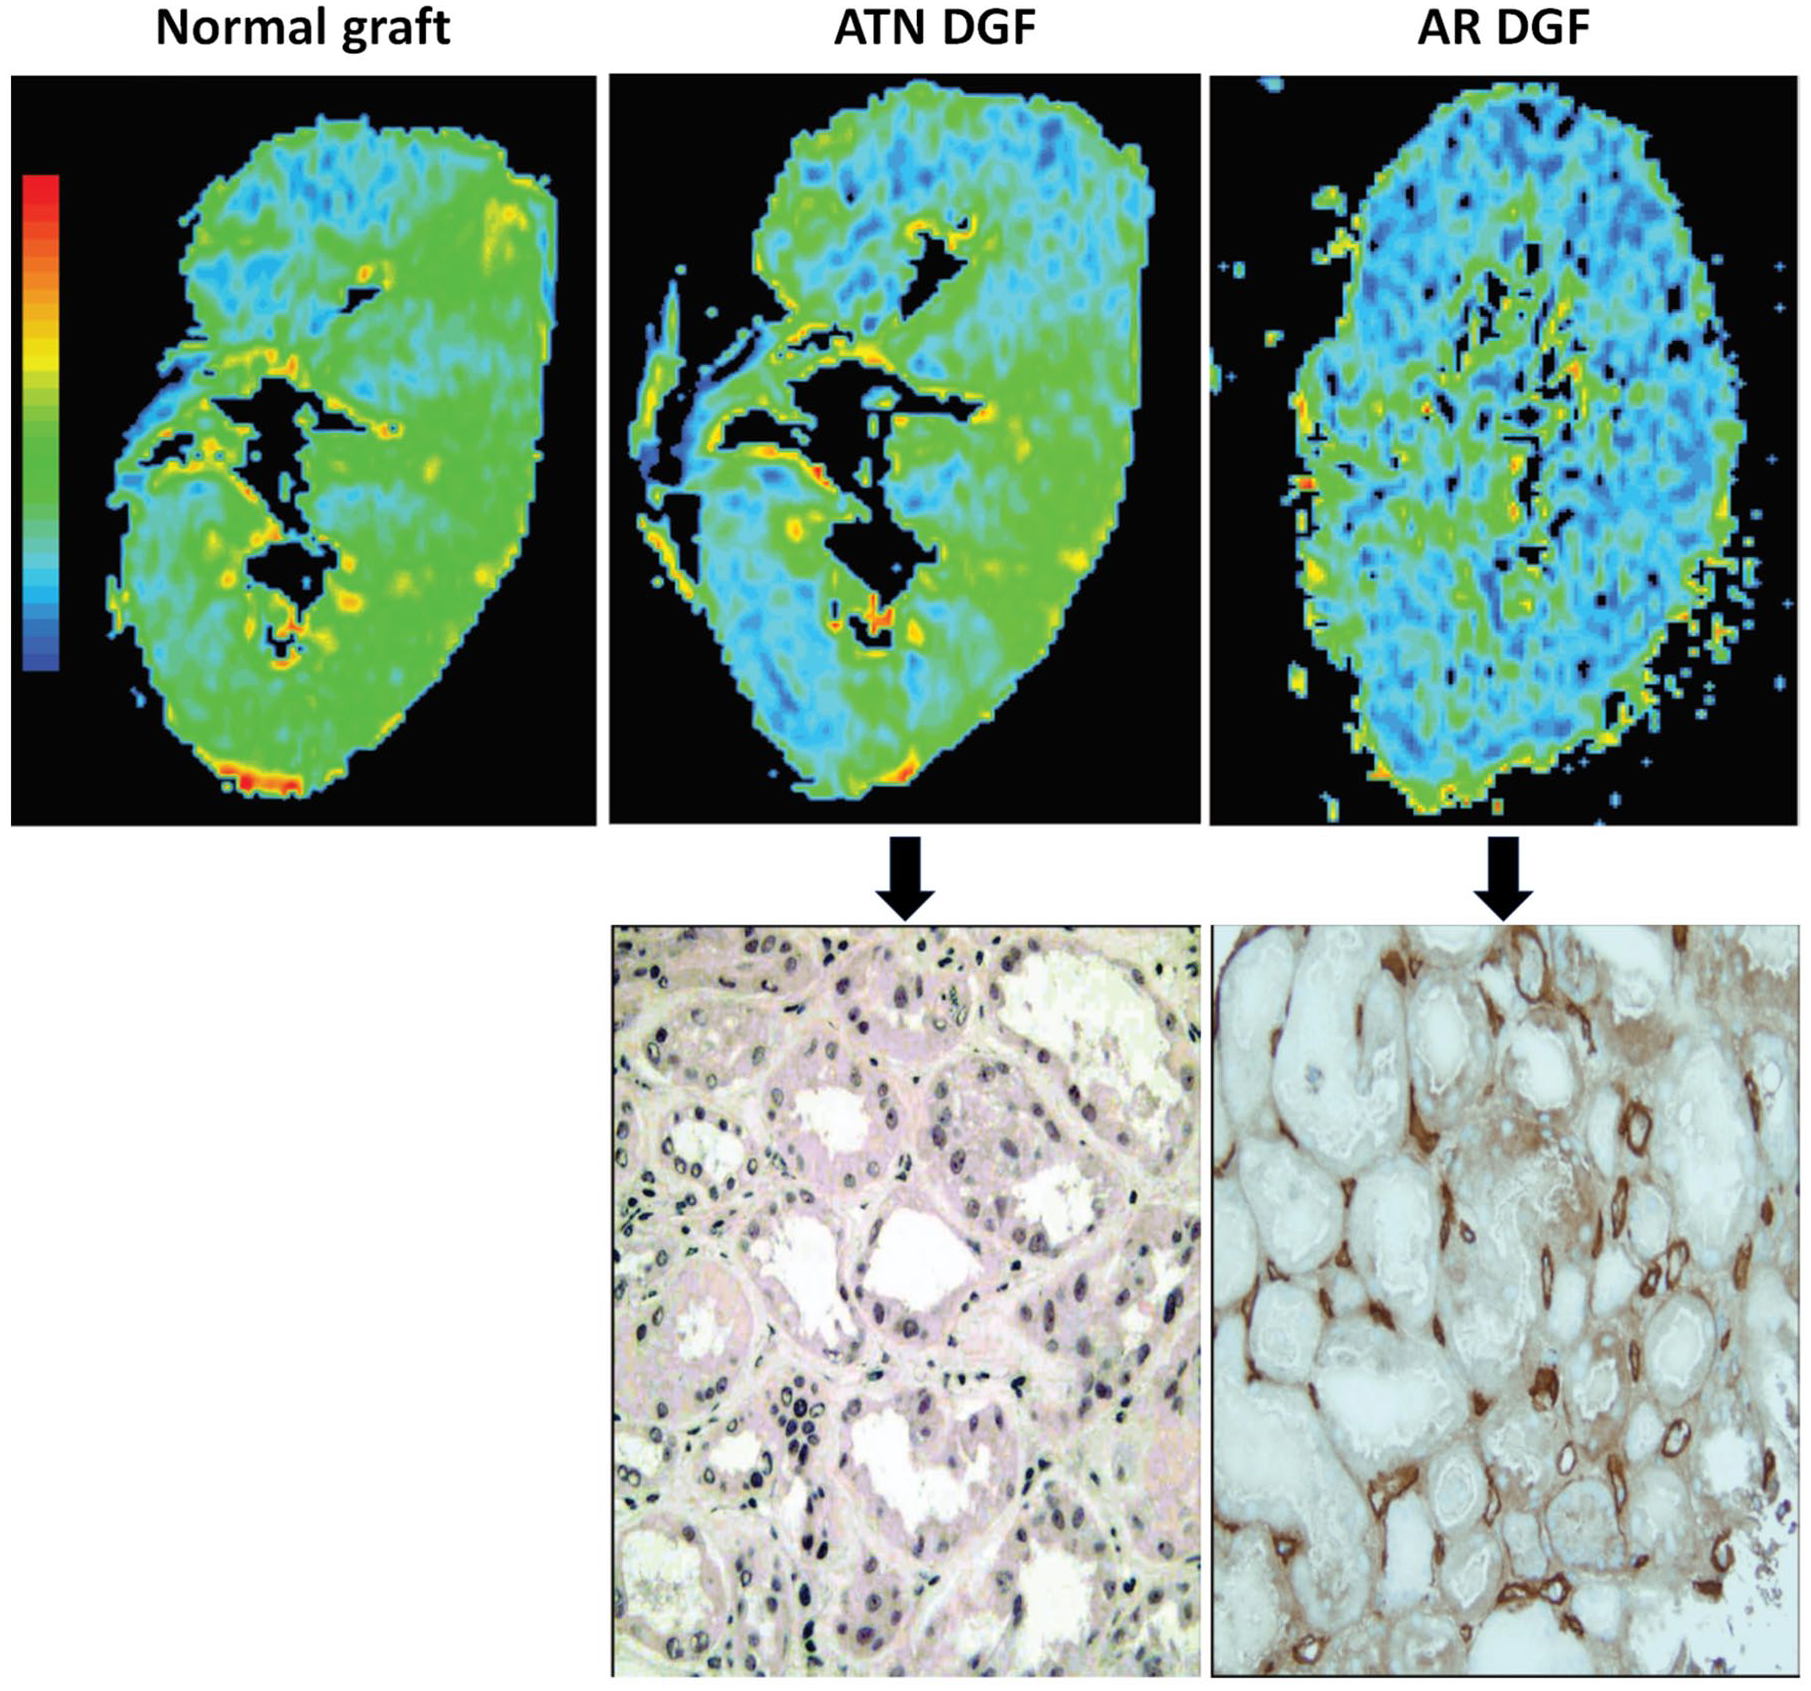
Blood oxygen level–dependent MRI R2* images and corresponding histopathological findings from kidneys with normal graft function, ATN and AR indications of DGF.
Perspective and Future Directions
There is preliminary evidence on evolving imaging modalities for the noninvasive assessment of DGF, particularly their ability to differentiate ATN from AR. These modalities could be integrated into the posttransplant clinical workflow around the 48- to 72-hour mark, prior to when a biopsy would be typically performed for DGF. Currently, neither CEUS nor multiparametric MRI have been used extensively in clinical care. Existing studies have been limited by their single-center nature with relatively small cohorts of patients; many did not use standardized imaging sequences, timepoints, or definitions of DGF. Despite their proposed use over the last 15 years and wider application in other specialties (eg, brain or liver imaging), CEUS and multiparametric MRI use in transplant nephrology has lagged. To facilitate the integration of these modalities by nephrologists interested in having adjunct, noninvasive tools in the posttransplant setting, we highlight the unique advantages and drawbacks of both modalities (Table 1).
Summary of Reviewed Imaging Techniques, Their Advantages, and Limitations in the Setting of DGF.

Note. DGF = delayed graft function; MRI = magnetic resonance imaging.
The benefits of CEUS include (1) its portability allowing for examinations to be conducted at the patient’s bedside while MRI requires transport of patients to the radiology department where MRI machines are housed 60 ; (2) CEUS examinations are shorter and provide real-time representation of the distribution of the gas-filled contrast agents in the kidney microvasculature, whereas multiparametric MRI provides representative images at predefined timepoints; and (3) CEUS is more readily accessible. The MRI has a larger upfront expense and significant maintenance costs. 100 Large-scale clinical studies are more challenging to conduct as research-specific MRI machines are not routinely available and resources must be shared with clinical care. Nevertheless, MRI, too, has unique benefits: (1) MRI has superior soft tissue contrast compared with US imaging; (2) MRI can provide panoramic information to simultaneously evaluate multiple organ transplants (eg, dual kidney transplant or combined liver and kidney transplant). Scanning multiple organs with CEUS would require multiple contrast agent boluses, increasing the length of time between scans while the microbubbles clear out. 68 (3) CEUS examinations require skilled operators at the bedside who are familiar with anatomical presentations of post-transplant kidney complications, 101 whereas MRI scans can be conducted using predefined imaging sequences (eg, BOLD, ASL, or DTI). 83 Imaging artifacts are present in both modalities; however, the superficial and fixed position of the transplanted graft in the iliac fossa makes imaging of the kidney easily accessible by both modalities. Taken together, both CEUS and multiparametric MRI can better visualize both macro- and microvascular circulation and provide additional benefits compared with conventional B-mode and Doppler sonography indices. Appreciating the role of IRI in ATN, 102 there is certainly a basis for their value in the assessment of DGF. These imaging modalities are both worthy of further study. A prospective cohort study could be utilized to assess the diagnostic value of either CEUS or MRI. Either modality could be integrated into clinical workflow around the 48- to 72-hour mark for patients with persistent DGF. Imaging would then be followed by transplant biopsy to establish the sensitivity of the imaging biomarkers for detecting etiologies of DGF based on the underlying pathology. A study of this nature would be best facilitated by interdisciplinary collaborations between transplant nephrologists, radiologists, pathologists, and imaging physicists to properly design clinical studies to fully maximize the clinical adaptation of these modalities.
Conclusion
Medical imaging has revolutionized our understanding of various aspects of kidney morphology, function, metabolism, and even the microstructure of the interstitium. The management of early posttransplant complications is already informed by widely available kidney US. Both CEUS and MRI can better visualize the microvascular circulation, tubular flow, and overall renal perfusion, providing a pathophysiological basis for its potential to better characterize early posttransplant renal parenchymal disorders, such as DGF. Although existing studies show promise in being able to distinguish between ATN and AR, they have generally included only small numbers of patients and have not kept pace with the ongoing technical advances of these imaging modalities. There remains unharnessed potential with CEUS and MRI, and more robust clinical studies are needed to better evaluate their role in the current era, expanding the compendium of noninvasive tools for the care of kidney transplant recipients.
Footnotes
Acknowledgements
The authors would like to thank Drs Darren Yuen, Todd Alexander, Adeera Levin, and Sunny Hartwig for internal reviews of the manuscript.
Ethics Approval and Consent to Participate
Not applicable.
Consent for Publication
All authors consent to publication.
Availability of Data and Materials
Not applicable.
Declaration of Conflicting Interests
The author(s) declared no potential conflicts of interest with respect to the research, authorship, and/or publication of this article.
Funding
The author(s) disclosed receipt of the following financial support for the research, authorship, and/or publication of this article: E.H., H. K., and A.Y. are supported by a Kidney Research Scientist Core Education and National Training (KRESCENT) Program postdoctoral fellowship (cosponsored by the Kidney Foundation of Canada, the Canadian Society of Nephrology, and Canadian Institutes of Health Research). E.H. is also supported by a Banting Fellowship from the Canadian Institutes of Health Research. A.Y. is also supported by the Clinician Investigator Program at the University of Toronto, with funding from the Ministry of Health and a Postdoctoral Research Fellowship from the Canadian Institutes of Health Research.