
Abstract
Background:
In Ontario, kidney transplants have risen by 4% annually in recent years. An understanding of how this will affect the future annual number of posttransplant follow-up visits informs how to organize and deliver care.
Objective:
We projected the required number of annual posttransplant follow-up nephrology visits to inform posttransplant care delivery.
Design:
Population-based retrospective cohort study.
Setting:
Linked databases from Ontario, Canada (population 14 million).
Patients:
Incident kidney transplant recipients from years 2008 to 2013.
Measurements:
Frequency, distance traveled, and current and projected visits for posttransplant follow-up.
Methods:
Assuming a graft survival of 13 years and using the mean number of posttransplant clinic visits in years 1, 2, and 3, we forecasted the number of clinic visits needed in the year 2027.
Results:
Using data from 2443 recipients, the mean (SD) number of clinic visits per recipient was 14.0 (9.2) in the first year after transplant, and 3.9 (6.2) and 3.0 (5.3) in the second and third year, respectively. If transplant rates rise by 4% per year until 2027, the estimated annual visits number will increase from 30 622 to 43 948. The median (25th, 75th percentile) distance between transplant center and patient’s home was 30 (13, 65) km. The median round-trip travel distance for these visits in the first year after transplantation was 603 km per recipient, and median driving cost was Can$344 (2017).
Limitations:
Regarding patient expense, limitations include that distances traveled were calculated orthodromically, and we did not account for patient cost of follow-up beyond that of vehicular travel. Regarding follow-up projections, limitations include the assumption that graft life span will not change, follow-up patterns do not differ between donor kidney type, and we did not survey stakeholders as to their preferred method of follow-up.
Conclusion:
We quantified the increase in posttransplant visits when regional annual rates of transplantation rise. Strategies recognizing the burden of these visits may enhance patient-centered care, as it is unclear how some patients manage costs, nor how the current health care system will manage the demand.
What was known before
It is well known that there is a growing number of kidney transplants happening across the country. All of these patients require lifelong specialist follow-up after kidney transplant.
What this adds
This research provides projections as to the number of kidney transplant recipients who will need to be seen in the coming decade, and the number of follow-up visits that clinics will need to make capacity for.
Introduction
Many regions across North America have initiatives to increase the number of kidney transplants, including increased focus on living donation, and increased use of donors passing from a cardiac death.1-3 With better immunosuppression, immunology, and posttransplant care, the duration of recipient and graft survival is also increasing after transplant (with associated greater lengths of posttransplant follow-up care).4,5 These factors naturally increase the amount of resources and effort needed by the health care system to deliver posttransplant care. Our search of PubMed found studies on posttransplant follow-up care models6-14 but failed to identify any study on predicting how an increase in the annual number of kidney transplants affects the future expected annual number of posttransplant follow-up visits (Table S1 in Supplemental Material). In addition, understanding the distance and cost of patient travel for posttransplant clinic visits may inform new strategies in care delivery.
Ontario is Canada’s largest province, with a population of 14 million and an area of 1 million km2. Through concerted efforts in both deceased and living donation populations, the number of kidney transplants in Ontario has risen by 4% per year in recent years and totaled 688 kidney transplants in 2017. In the 17-year period between 2000 and 2017, annual kidney transplants performed in all centers in Ontario rose from 364 to 688, representing an increase of 89%. All patients require posttransplant follow-up visits, including those from the current year as well as those transplanted in years prior. Although there are program variations, typically, visits in the first month are once to twice weekly, and then slowly tapered as their stability increases, and by their first year posttransplant are typically once per month or less. Following this, and depending on how patients are progressing, visits change to once every 2 to 4 months as time from their transplant and stability increase. With the increase in transplant activity, we were prompted to undertake this case study to forecast the annual number of posttransplant clinic visits required by the year 2027.
Methods
Study Overview
We analyzed provincial health care databases for the following: (1) the annual number of outpatient nephrology clinic visits in kidney transplant recipients who were discharged from hospital after kidney transplant from January 1, 2008, to March 31, 2013 (to understand the average number of visits per recipient in the first, second, third, and fourth year after transplant, we restricted follow-up to 4 years after discharge as we assumed that the annual number of follow-up visits thereafter would be constant); (2) the location of these visits (ie, at the transplant center vs nontransplant center); (3) the distance recipients traveled for outpatient nephrology clinic visits; and (4) the cost of physician payments for outpatient nephrology clinic visits, and (5) the out-of-pocket costs borne by recipients for visit-related travel. We forecasted the total number of posttransplant outpatient nephrology visits in Ontario over the next decade (2018-2027) under 2 different scenarios (described below) and the estimated recipient driving distance and travel costs saved if outpatient nephrology visits were relocated from the transplant center to the patient’s nearest nephrologist.
Setting
We conducted this study using 8 administrative health care databases held at ICES (Institute for Clinical Evaluative Sciences) in Ontario, Canada. In Ontario, universal access to hospital services and physicians is provided to all residents. These health care interactions are captured in the databases described below. The data sets were linked using unique encoded identifiers and analyzed at ICES. The use of data for this project was authorized under section 45 of Ontario’s Personal Health Information Protection Act, which did not require review by a Research Ethics Board.
Data Sources
We used the Canadian Organ Replacement Register (CORR) to identify kidney transplant recipients. CORR accurately identifies kidney transplant recipients compared with data collected directly from transplant centers, with a sensitivity of 96%. 15 The Ontario Renal Reporting System was used to assign kidney transplant recipients to Ontario’s 26 chronic kidney disease (CKD) programs. The Registered Persons Database provides information on vital status and demographic information, whereas the ICES Physician Database identifies nephrologists. Information on Ontario physicians’ fee-for-service billing claims was provided by the Ontario Health Insurance Plan (OHIP). The Canadian Institute for Health Information Discharge Abstract Database and Same Day Surgery Database provide information on diagnostic and procedural events that occur during a hospitalization. Information on emergency department visits was provided by the National Ambulatory Care Reporting System. The only reason for loss to follow-up in our databases was emigration from the province (<0.5% annually). 16
Study Population
We included all incident adult kidney transplant recipients in Ontario who were discharged from hospital for their kidney transplant surgery from January 1, 2008, to March 31, 2013. We excluded the following recipients: died prior to or on the date of discharge from hospital and recipients with a missing donor type (ie, living vs deceased donor; missing in ~1% of recipients). We excluded recipients of a simultaneous multiorgan transplant as in many programs they are followed by surgeons (vs nephrologists) and the immune suppression management is often different. We also excluded kidney transplant recipients from 1 of the 6 transplant centers in Ontario (Kingston General Hospital) due to their use of an alternative funding model and because they performed a small number of kidney transplants (<1.5% of all transplants performed in the province during the study period). We defined cohort entry (index date) as the date of discharge from the transplant hospital for the kidney transplant surgery.
Measures
Outpatient Posttransplant Nephrology Clinic Visits
We defined outpatient nephrology clinic visits as evidence of a kidney transplant recipient having a physician billing claim by a nephrologist after discharge from hospital for their index kidney transplantation. We excluded visits occurring during a hospital admission, inclusive of the admission and discharge date. Billing claims made on the same day as an emergency department visit were also excluded, as we wanted to exclude unscheduled urgent care in our primary analysis. If a recipient had multiple nephrologist billing claims on the same day, we restricted to a maximum of 1 visit per day. Given the number of visits is often variable over time, we examined the total number of posttransplant visits in the 0 to <1 year, 1 to <2 years, 2 to <3 years and 3 to 4 years after discharge from the kidney transplant admission. We followed kidney transplant recipients until death, graft failure, and end of follow-up. We defined graft failure as return to chronic dialysis or preemptive retransplantation. The last possible date for follow-up was March 31, 2017. In an additional analysis, we included both inpatient and outpatient visits to a nephrologist. We also examined the total number of unique kidney transplant outpatient follow-up visits to a nephrologist in a given calendar year.
Location of Outpatient Nephrology Visits
The Ontario Renal Network, a provincial government agency, coordinates the 26 regional CKD programs that provide care to all chronic dialysis (n~10 000) and advanced CKD patients (n~16 000) in the province. Nephrologists practice in groups within these 26 CKD programs. The CKD programs are similar to the United States end-stage renal disease (ESRD) networks. These CKD programs provide pretransplant general nephrology care, and patients receive their care at the CKD program closest to their residence. The CKD programs refer patients for transplantation to 6 Ontario adult transplant centers (located within the 26 CKD programs). To determine whether posttransplant follow-up visits occurred at 1 of the 5 Ontario CKD programs with an adult transplant center included in our study (St. Michael’s Hospital, Toronto; London Health Sciences Center, London; University Health Network, Toronto; The Ottawa Hospital, Ottawa; and St. Joseph’s Healthcare, Hamilton), we examined the physician billing institution number associated with the nephrology billing claim. If the institution number was associated with 1 of the 5 adult transplant centers, we classified the visit as a transplant center visit. All other institution numbers were classified as a nontransplant center visit. We classified billing claims with a missing institution number as a nontransplant center visit, as institution numbers are only mandatory for services performed in a hospital setting (missing for approximately 5% of all visits).
Distance Traveled for Posttransplant Outpatient Nephrology Visits
To calculate the distance kidney transplant recipients traveled for posttransplant outpatient nephrology visits, we selected the recipient’s residential postal code as of July 1st of their transplant year. Orthodromic distance in kilometers was calculated by converting postal codes into latitude and longitude geographical units. An equation was then used to calculate the distance from the recipient’s home to the transplant center. 17 Details on the equation can be found in the Table S2 in Supplemental Material. To estimate round-trip travel distance, we multiplied distances by 2.
To visually display the geographic distribution of kidney transplant recipients relative to their transplant center, we created a map. We identified the census division (CD) (ie, counties) where each kidney transplant recipient resided. There are 49 CDs in Ontario. We then identified CDs that had >50% of recipients traveling to 1 transplant center. Each transplant center was assigned a unique color and CDs with >50% of recipients traveling to 1 center were shaded the same color as the transplant center.
Costs
To calculate cost of physician payments through billed services for posttransplant outpatient nephrology visits (including visits occurring at a transplant center and nontransplant center), we included all billing claims made by a nephrologist, including multiple billing claims on the same day for 1 recipient. We did not account for inflation. To estimate the out-of-pocket cost, we assumed patients were driving privately owned vehicles on authorized roads at an average cost of Can$0.57 per kilometer. 18
Projecting Posttransplant Outpatient Nephrology Visits
To forecast the total number of posttransplant outpatient nephrology visits in Ontario from the years 2000 to 2017, we made the following assumptions: (1) a kidney allograft lasts 13 years 19 ; (2) all kidney transplants occur on January 1 of the associated year; and (3) the mean number of posttransplant visits per recipient remains the same in posttransplant years 5 to 13 as years 3 to 4. We used the mean number of visits in each year after transplant and the total number of transplants in Ontario each year (including transplants at Kingston General Hospital) to forecast the number of posttransplant clinic visits per year over the next decade (2018-2027). We forecasted the number of visits under 2 assumptions of transplant rates: (1) the annual number of kidney transplants continues to increase by 4% each year over the next 10 years and (2) the annual number of transplants remains constant over the next 10 years. To evaluate how a higher frequency of visits as grafts fail may influence our projections, we also forecasted the number of visits under an alternative scenario where the mean number of visits increased to 6 in the 12th year and 9 in the 13th year. We also present forecasts based on the median, 25th percentile, and 75th percentile number of visits instead of the mean.
Statistical Analysis
We reported continuous variables as mean (SD) or median (25th, 75th percentile) and categorical variables were reported as counts (percentages). All analyses were conducted with Statistical Analysis System (SAS) software, version 9.4 (SAS Institute, Cary, North Carolina).
Results
Kidney Transplant Recipients
We observed 2443 recipients in the 4 years following their kidney transplant. During this time, 166 (6.8%) kidney transplant recipients died and 152 (6.2%) experienced graft failure.
Posttransplant Outpatient Nephrology Clinic Visits
We found in the first year after hospital discharge from the transplant surgery that there were a total of 34 771 outpatient visits to a nephrologist, with a mean of 14.0 visits per recipient (SD = 9, range = 0-120). The mean number of visits per recipient decreased to 3.9 years in the second year, and 3.0 and 2.6 visits in the third and fourth years, respectively (Table 1 and Figure 1). Approximately 86% of these visits in the first year occurred at a CKD program with a transplant center and declined to 73% in subsequent years (Table 1). When including both inpatient and outpatient visits to a nephrologist, there were a total of 47 142 visits in the first year after the hospital discharge for kidney transplant surgery, with a mean (SD) of 19.0 (14.4) visits in the first year and 5.4 (8.7), 4.4 (7.8), and 4.1 (8.2) in years 2, 3, and 4, respectively.
The Number of Outpatient Nephrology Visits by Year After Kidney Transplantation.

Note. Data based on 2443 transplant recipients from Ontario, Canada.
Includes outpatient nephrology visits occurring at any facility (ie, visits to the 5 transplant centers and visits occurring in a chronic kidney disease program without a transplant center).
The 5 Ontario transplant centers included were St. Michael’s, University Health Network, St. Joseph’s Healthcare, London Health Sciences Center’s University Hospital, and Ottawa General Hospital.

Outpatient nephrology clinic visits per recipient per year.
In 2014, 90% of the approximate 228 nephrologists practicing in Ontario performed at least 1 posttransplant clinic visit per year of follow-up. About 5% to 7% of nephrologists performed more than 1000 unique kidney transplant outpatient visits per year (which were nephrologists with a primary clinical focus in kidney transplantation). Only 13% to 18% of nephrologists saw more than 50 unique kidney transplant recipients per year.
Distance Traveled for Posttransplant Outpatient Nephrology Visits
The mean (SD) distance between the transplant center and a recipient’s home was a 70-km (131) 1-way drive and the median (25th, 75th percentile) distance was a 30-km (13, 65) 1-way drive. Approximately 6% of transplant patients lived over 200 km away from their transplant center (1-way). In the first year after transplant, the mean (SD) round-trip travel distance for all nephrology follow-up visits was 1495 (3005) km per recipient and the median (25th, 75th percentile) distance was 603 (264, 1543) km. The mean distance traveled decreased in subsequent years (Table 2).
Round-Trip Distance Traveled by Recipients for Posttransplant Outpatient Visits in Kilometers.

Ontario transplant centers generally recommend kidney transplant recipients stay in the city where they have been transplanted for several weeks after transplant; therefore, we performed an additional analysis to determine the distance traveled from their home to the transplant center beyond 45 days, up to 1 year after hospital discharge. Beyond 45 days, the mean (SD) distance traveled per recipient was 833 (2154) km in the remainder of the year and a median (25th, 75th percentile) distance of 334 (152, 806) km.
Figure 2 demonstrates the geographic distribution of kidney transplant recipients relative to their transplant center. Kidney transplant recipients residing in CDs located in the northern part of Ontario need to travel large distances to attend transplant centers unless an alternate method of follow-up is arranged. Kidney transplant recipients attending the 5 most northern CKD programs (which represents 6% of all kidney transplant recipients) had a median (25th, 75th percentile) 1-way travel distance from their home to a transplant center of 427 (374, 558) km.
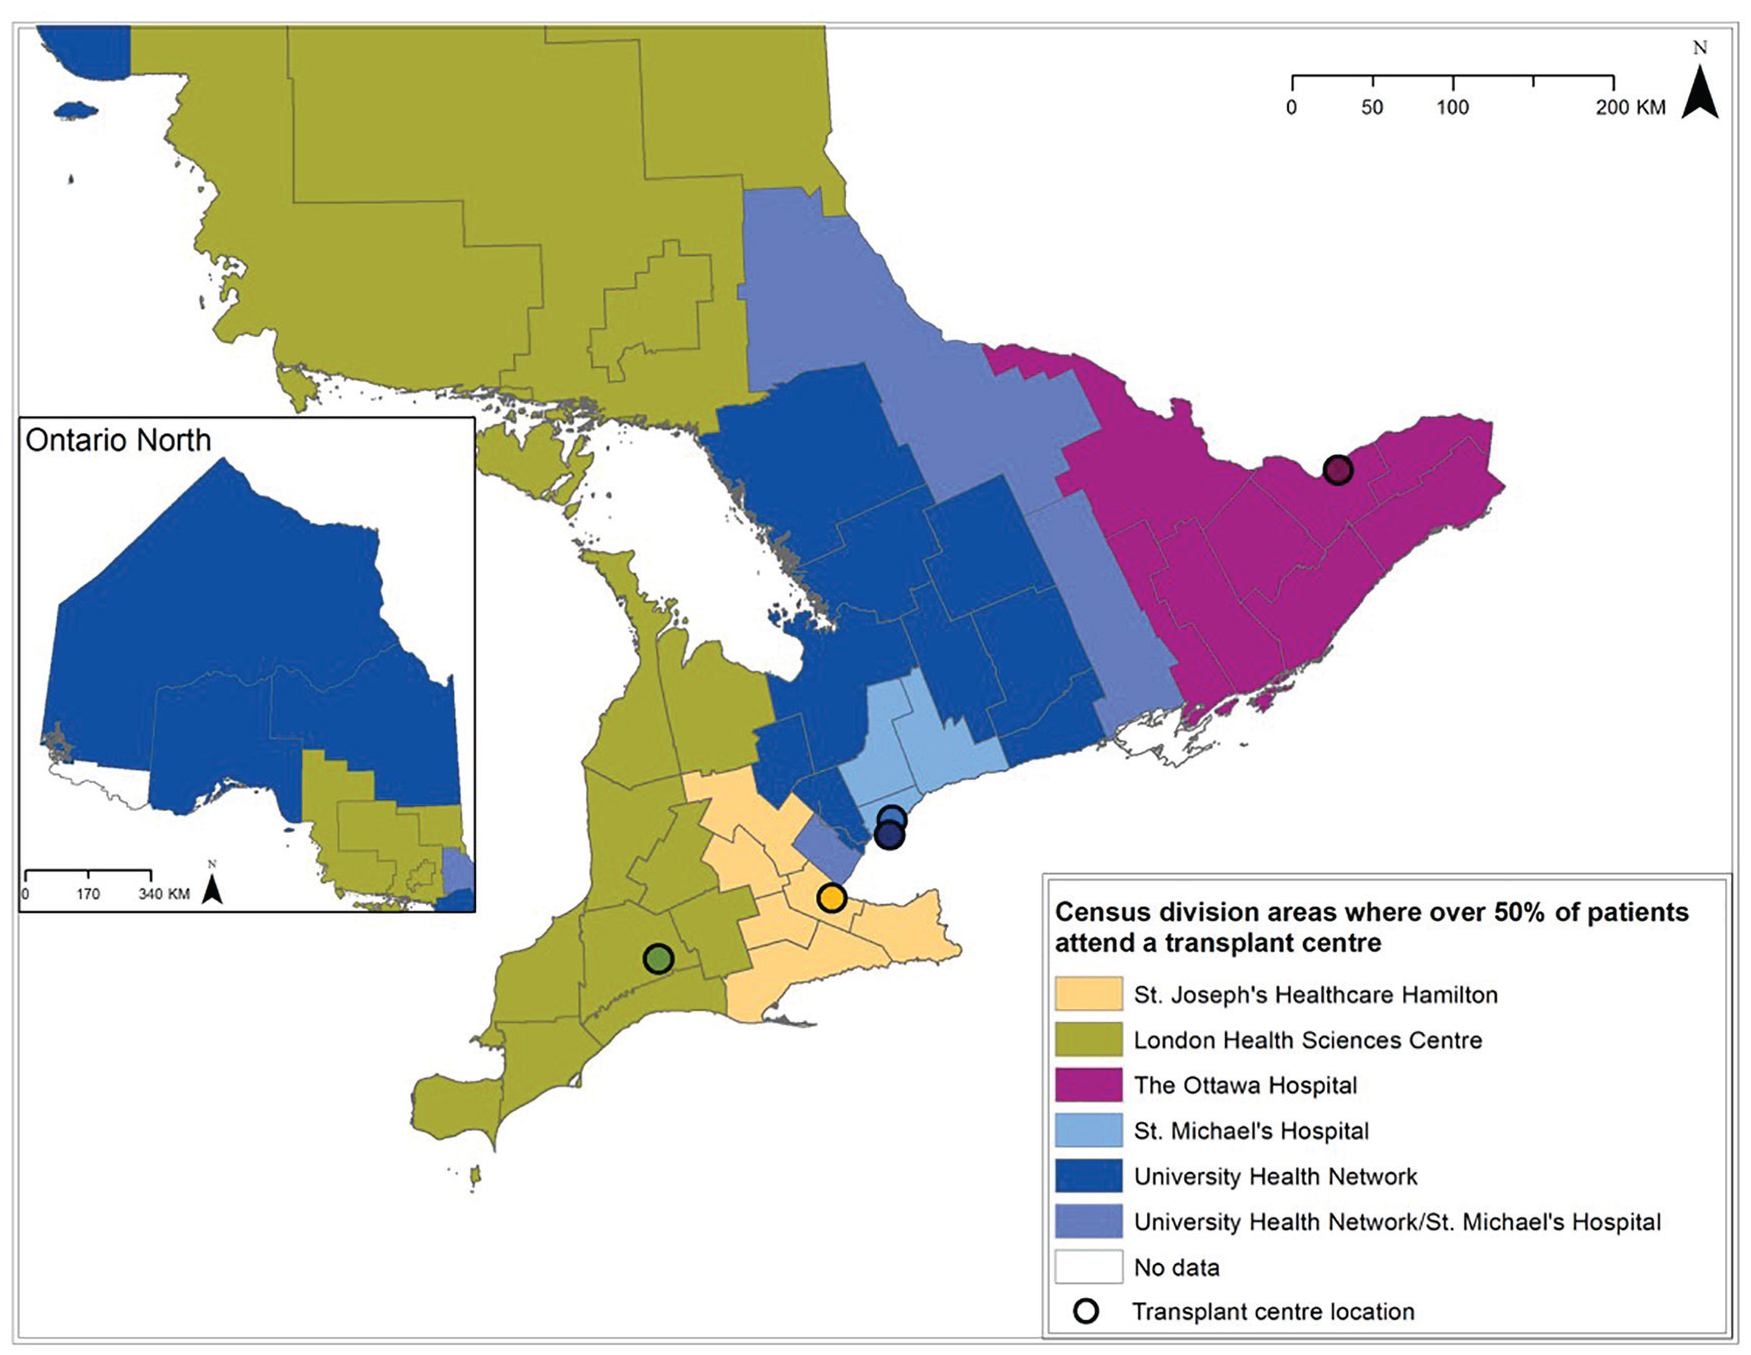
Census division area where over 50% of patients attend a transplant center.
Costs
Nephrologists’ remuneration for providing outpatient visits to kidney transplant recipients in their first year was a mean (SD) of Can$698 (931) per recipient. This cost decreased with each subsequent year after transplant (Table 3).
Nephrologist Remuneration for Providing Posttransplant Outpatient Nephrology Visits, and the Estimated Out-of-Pocket Travel Expense for Patients to Attend Posttransplant Outpatient Nephrology Visits.

Note. All costs are in Canadian dollars.
Includes only nephrologist billing codes. In April 2015, there was a change to the physician billing fee schedule. Therefore, costs would be lower if we restricted to billings occurring after the year 2015.
The estimated out-of-pocket driving expense that recipients paid to travel to their outpatient follow-up visits was an average of Can$852 and a median (25th, 75th percentiles) of Can$344 (151, 880) in the first year after transplant. This decreased substantially in subsequent years when the visit frequency decreased (Table 3).
Forecasted Posttransplant Outpatient Nephrology Visits
Our estimate of the total number of posttransplant outpatient follow-up visits in 2017 was 30 622 visits for 7058 unique Ontario kidney transplant recipients. If transplant rates increase by 4% per year, there would be a rise to an estimated 43 948 visits in 2027, including all patients transplanted in the prior 13 years and new transplants in each subsequent year (Figure 3). This represents an increase of 13 326 annual visits when comparing 2017 with 2027, for 10 589 unique patients. If transplant rates do not change at all from 2017 onward, there would be an estimated annual 34 890 posttransplant outpatient visits for 8878 unique patients in 2027. This represents an increase of 4268 annual visits when comparing 2017 with 2027. In the scenario where we assume the mean number of visits increases in the 2 years prior to graft failure in year 13, the forecasted number of visits increases to 49 648 in 2027. Forecasting using the medians instead of means results in 33 651 predicted visits in 2027. Similarly, using 25th percentiles results in a forecast of 22 335 visits, and 75th percentiles forecast 54 284 visits.

Projected posttransplant outpatient visits to nephrologists after 2017 if there is no change in transplant rates versus if there is a 4% annual increase in transplant rates.
Discussion
In this study, we found that most posttransplant visits occur at CKD programs with a transplant center. Many nephrologists see transplant patients in follow-up; however, a few nephrologists (transplant nephrologists) perform the bulk of these visits. Our study found that most patients do not travel a great distance to attend transplant clinic visits, but the small number of patients who live remotely do have to travel long distances and this transportation is costly. One possible method to manage the long distances traveled by some patients would be to consider relocation of their posttransplant visits to the nearest CKD program. However, in doing so, programs must consider the barriers to relocating transplant care to communities, including access to surgical opinion, renal biopsy and pathology, virus and drug-level testing, and level of comfort that nontransplant nephrologists have in providing posttransplant care. Regardless of where care occurs, our forecasting demonstrates that the annual outpatient clinic visits will grow dramatically in the coming decade, irrespective of whether transplant rates continue to increase or remain steady.
This study highlights the importance of considering follow-up modeling, resources, and infrastructure for the kidney transplant population in a time where the field of transplantation is growing. It underscores just how many posttransplant visits the system must be able to accommodate in the coming years (which will require an expansion of human resources to meet the demand). Although our data are through the year 2013 and we projected a 4% growth rate based on that data, there has been a dramatically higher growth rate in the 3 most recent years: a 20% increase in transplants in 2016 through 2018 compared with prior years. 20 This suggests that our projections for outpatient follow-up visits are conservative compared with what the system will in fact need. For example, if a 10% annual growth was seen from 2017 onward, there would be 63 430 outpatient nephrology visits in Ontario in 2027 from transplant patients from the preceding 13 years. This would represent an additional 32 808 visits. In addition, given that we did not include unscheduled transplant visits in our analysis, our estimates again are more conservative than actual visit numbers that will be seen. Currently, initiatives have placed great emphasis on increasing access to transplantation, perhaps without equal attention to the associated increase in the amount of posttransplant follow-up care required. Posttransplant follow-up requires expertise of doctors, nurses, pharmacists, and clerical staff, along with laboratory medicine, radiology, and pathology. It also requires a physical space in which to carry provide care. Our study suggests that the growth in transplantation will put increasing demands on each of these pillars to an extent that system restructuring will likely be required.
The purpose of our study was not to examine restructuring of kidney transplantation follow-up, per se. However, the projections in growth of follow-up observed in our analysis beg the question of how the current system will manage the demand. Novel models of care may be less useful in the first year after transplant, as there is little that can be modified for the follow-up of a patient immediately after transplant. However, as time passes and stability increases, new models of care can be considered. Some ideas may be to increase the number of transplant nephrologists; to increase engagement and modify financial incentives for nephrologists to follow kidney transplant recipients; to hire clinical associates, nurse practitioners, or physician assistants with specialized training in transplantation; to expand the use of traveling nephrologists for remote clinics; and/or to do virtual visits with patients who live at a distance. Although these options are not well studied, there is 1 small retrospective study showing that kidney transplant recipients who received community-nephrology follow-up had similar graft survival outcomes when compared with transplant center follow-up. 12 However, this is just one of several models that could be undertaken to manage posttransplant follow-up, as the preferred model of care for patients and nephrologists is currently unknown. Given the higher number of inpatient visits in the first year after transplant compared with other years, it may be important to continue seeing kidney transplant patients at their transplant center for the first year.
Our study has several limitations. First, we calculated distances using orthodromic distance which underestimates the distance patients must travel, and subsequently underestimates driving costs. In addition, we assume that patients do not relocate after transplant. Second, we were unable to account for other costs to patients such as overnight accommodation and missed employment. Third, our projections are based on the assumption that graft life span will remain unchanged from historical approximation, and that outpatient visit frequency will remain unchanged. Fourth, we did not factor in the different follow-up patterns for kidney donated by living donors, death from neurologic cause, or death from cardiac cause. Fifth, our data do not take into account patient and physician preferences, which is required for future follow-up planning. Sixth, we assume that grafts last 13 years, which may be more with advanced immunosuppression, or less with advanced age of transplant recipients. Furthermore, there are increased visits at the end of a transplanted grafts life span that we did not account for in the primary projection graphs, but did consider in the additional sensitivity analysis. Finally, predicting human resources needed to follow recipients after transplant was beyond the scope of this research.
In summary, with the rising rates of kidney transplantation, accommodating the increased volume of patient follow-up visits is unlikely to be sustainable in its current form. Transplant clinics, hospitals, provincial regulatory bodies, government, and associated staff must consider the upcoming large rise in outpatient follow-up visits when resource planning for the future of transplant clinics. Any restructuring of posttransplant kidney care should take into account patient and provider preferences, and stakeholder engagement for what a future model may entail.
Supplemental Material
SUPPLEMENT_Submit_Sept – Supplemental material for Projecting the Number of Posttransplant Clinic Visits With a Rise in the Number of Kidney Transplants: A Case Study From Ontario, Canada
Supplemental material, SUPPLEMENT_Submit_Sept for Projecting the Number of Posttransplant Clinic Visits With a Rise in the Number of Kidney Transplants: A Case Study From Ontario, Canada by Shawna Mann, Kyla L. Naylor, Eric McArthur, S. Joseph Kim, Greg Knoll, Jeffrey Zaltzman, Darin Treleaven, Alexandra Ouedraogo, Anthony Jevnikar and Amit X. Garg in Canadian Journal of Kidney Health and Disease
Footnotes
List of Abbreviations
CD, census division; CORR, Canadian Organ Replacement Register; CKD, chronic kidney disease; ESKD, end-stage kidney disease; OHIP, Ontario Health Insurance Plan; SAS, statistical analysis system.
Ethics Approval and Consent to Participate
ICES is a prescribed entity under section 45 of Ontario’s Personal Health Information Protection Act. Section 45 authorizes ICES to collect personal health information, without consent, for the purpose of analysis or compiling statistical information with respect to the management of, evaluation or monitoring of, the allocation of resources to or planning for all or part of the health system. Projects conducted under section 45, by definition, do not require review by a Research Ethics Board. This project was conducted under section 45, and approved by ICES’ Privacy and Legal Office.
Consent for Publication
All authors consent to the publication of this study.
Availability of Data and Materials
The data set from this study is held securely in coded form at ICES. While data sharing agreements prohibit ICES from making the data set publicly available, access may be granted to those who meet pre-specified criteria for confidential access, available at ![]() . The full data set creation plan and underlying analytic code are available from the authors upon request, understanding that the programs may rely upon coding templates or macros that are unique to ICES.
. The full data set creation plan and underlying analytic code are available from the authors upon request, understanding that the programs may rely upon coding templates or macros that are unique to ICES.
Declaration of Conflicting Interests
The author(s) declared the following potential conflicts of interest with respect to the research, authorship, and/or publication of this article: S.J.K. and G.K. have received investigator-initiated research grants from Canadian Institutes of Health Research and Astellas Canada. A.X.G. received an investigator-initiated grant from Astellas for a Canadian Institutes of Health Research study in living kidney donors.
Funding
The author(s) disclosed receipt of the following financial support for the research, authorship, and/or publication of this article: This study was funded by a grant received from the Ontario Renal Network through Cancer Care Ontario (CCO). This study was supported by the ICES (Institute for Clinical Evaluative Sciences) Western site. The ICES is funded by an annual grant from the Ontario Ministry of Health and Long-Term Care (MOHLTC). Core funding for ICES Western is provided by the Academic Medical Organization of Southwestern Ontario (AMOSO), the Schulich School of Medicine and Dentistry (SSMD), Western University, and the Lawson Health Research Institute (LHRI). The research was conducted by members of the ICES Kidney, Dialysis and Transplantation team, at the ICES Western facility. The opinions, results, and conclusions are those of the authors and are independent from the funding sources. No endorsement by ICES, AMOSO, SSMD, LHRI, Canadian Institutes of Health Research (CIHR), CCO, or the MOHLTC is intended or should be inferred. Parts of this material are based on data and/or information compiled and provided by CIHI. However, the analyses, conclusions, opinions, and statements expressed in the material are those of the author(s), and not necessarily those of Canadian Institute for Health Information (CIHI). Parts of this material are based on data and information provided by CCO. The opinions, results, and conclusions reported in this article are those of the authors and do not necessarily reflect those of CCO. No endorsement by CCO is intended or should be inferred. A.X.G. was supported by the Adam Linton Chair in Kidney Health Analytics.
Supplemental Material
Supplemental material for this article is available online.
References
Supplementary Material
Please find the following supplemental material available below.
For Open Access articles published under a Creative Commons License, all supplemental material carries the same license as the article it is associated with.
For non-Open Access articles published, all supplemental material carries a non-exclusive license, and permission requests for re-use of supplemental material or any part of supplemental material shall be sent directly to the copyright owner as specified in the copyright notice associated with the article.