
Abstract
Background:
Type 2 diabetes mellitus (T2DM) is associated with an excess risk of cardiovascular disease (CVD) and chronic kidney disease (CKD). Although CVD, CKD, and use of antihyperglycemic treatments are all key drivers of the costs and consequences experienced by people with diabetes, no recent Canadian data describe these characteristics among adults with diabetes.
Objective:
To describe prevalence of CVD, CKD, and use of antihyperglycemic treatments among adults with diabetes.
Design:
Retrospective population-based, cross-sectional study.
Setting:
Alberta, Canada.
Patients:
All adults with T2DM as of March 31, 2017.
Measurements:
We described the demographic and clinical characteristics by CKD stage and CVD status and type. CKD stage was categorized according to international guidelines and based on estimated glomerular filtration rate (eGFR) and severity of albuminuria.
Methods:
Clinical and demographic characteristics were defined using provincial administrative data; medication use was based on data from the provincial drug plan. Additional analyses examined subgroups based on demographic characteristics, clinical characteristics, and medication use.
Results:
There were 260 903 participants, all of whom had T2DM. Median age was 64 years; 53.6% were male; and 10.9% lived in rural communities. Median duration of diabetes was 7.7 years. Half of the participants had A1C <7%. Overall, 33.0% had CKD; among these most had eGFR <60 mL/min/1.73 m2; 11.1%, 5.6%, and 2.9% had CKD stages 3a, 3b, and 4/5, respectively. The overall prevalence of CVD (prior myocardial infarction, stroke/transient ischemic attack, or peripheral artery disease) was 22.5%; prevalence increased in parallel with the presence of CKD: 14.4%, 28.8%, 35.7%, 44.3%, and 50.9% for stages 1, 2, 3a, 3b, and 4/5, respectively. Prescriptions for antihyperglycemic medications were more common in people with CKD as compared with those without. However, the use of all antihyperglycemic medications except insulin and meglitinide was progressively lower in the presence of more severe CKD.
Limitations:
The study is based on administrative data; therefore, the findings could be influenced by measurement error (eg, accuracy of diagnostic and procedural codes and prescription drug codes used).
Conclusions:
These findings will be useful to policy makers seeking to understand the burden of diabetes-related kidney disease as well as the potential budget implications and potential clinical benefits of expanded use of antihyperglycemic use in this population.
What was known before
Diabetes-related kidney disease is common and is associated with adverse health outcomes.
What this adds
This study provides population-based estimates of the demographic and clinical characteristics of Alberta patients with type 2 diabetes mellitus by stage of kidney disease and history of cardiovascular disease, including a detailed examination of the number and type of antihyperglycemic agents prescribed in this population. These findings will be useful to those seeking to understand the burden of diabetes-related kidney disease and its treatment.
Introduction
Diabetes mellitus affects more than 400 million people worldwide, and the prevalence of diabetes is growing rapidly, especially for type 2 diabetes mellitus (T2DM) and in low- and middle-income countries.1-3 T2DM is associated with an excess risk of microvascular and macrovascular complications including cardiovascular disease (CVD) and chronic kidney disease (CKD). The simultaneous presence of T2DM and CKD is associated with future risk for cardiovascular events that is similar to people with prior myocardial infarction 4 as well as a heightened risk for hypoglycemia, compared with people with diabetes but no CKD. Besides the excess risk of CVD events, a key clinical consequence of CKD is progressive kidney function loss—which is associated with adverse outcomes, high health care costs, and the possibility that chronic renal replacement (dialysis or kidney transplantation) will be required. 5
Because CVD and CKD are both key drivers of the costs and consequence experienced by people with diabetes, information on the prevalence of these conditions would be potentially useful to policy makers seeking to project the future resources and personnel needed to provide health services for this high-risk group. However, no recent Canadian data describe the population burden of diabetic kidney disease among adults with diabetes (or its pharmacological treatment) by stage of CKD and level of estimated glomerular filtration rate (eGFR).
The current study describes the demographic and clinical characteristics of patients with T2DM by CKD stage and CVD status and type. Our primary objective was to provide cross-sectional population-based estimates of the distribution (prevalence) of CKD stage among prevalent Albertan adults with T2DM. Additional subgroup analyses examined how this prevalence varies by demographic characteristics, clinical characteristics, and medication use. We also examined the number and type of antihyperglycemic agents currently used by stage of CKD and type of CVD.
Methods
This retrospective population-based cross-sectional study is reported according to the STROBE guidelines. 6 The institutional review boards at the Universities of Alberta (Pro00053469) and Calgary (REB16-1575) approved this study. This is a study of administrative data without any intervention. No study participants were placed at risk as a result of the study. Informed consent was not required.
Data Sources and Cohort
We used the Alberta Kidney Disease Network database, which incorporates data from Alberta Health (AH; the provincial health ministry) including physician claims, hospitalizations, and ambulatory care utilization; Alberta pharmaceutical network data; and the clinical laboratories in Alberta. This database has been widely used4,7,8 because of its population-based coverage of a geographically defined area, including demographic characteristics, health services utilization, and clinical outcomes. Additional information on the database is available elsewhere, including the validation of selected data elements and the standardization and calibration of serum creatinine assays. 9 All adults 18 years of age and older registered with AH were included in the database; all Alberta residents are eligible for insurance coverage by AH and >99% participate in coverage. The database was used to assemble a cohort of adults (18 years and older) with T2DM who resided in Alberta on March 31, 2017 (index date). Patients with type 1 diabetes mellitus (International Classification of Diseases, Ninth Revision [ICD-9] code: 250.x1 and 250.x3) in any of their previous records were excluded.
Diabetes Mellitus and Comorbidities
T2DM and comorbidities were defined using a previously published framework using validated algorithms as applied to Canadian physician claims data, each of which had positive predictive values ≥70% as compared with a gold standard measure such as chart review. 10 Conditions included T2DM, 11 chronic heart failure,12,13 dementia,12,13 depression,12,13 myocardial infarction, 14 peripheral artery disease (PAD), 15 and stroke or transient ischemic attack (TIA). 16 Each participant was classified with respect to the presence or absence of these 7 chronic conditions (lookback extended as far as April 1994 where records were available). 17 Detailed methods for classifying comorbidity status and the specific algorithms used are found elsewhere. 10 Myocardial infarctions were included in our definition of coronary artery disease (CAD) along with percutaneous coronary intervention (ICD-9 procedures codes: 36.01, 36.02, 36.05, 36.06, and CCI 1.IJ.50, 1.IJ.57.GQ, 1.IL.35) and coronary artery bypass grafting (ICD-9 procedures codes: 36.1, 36.2, and CCI 1.IJ.76). Cardiovascular disease was defined as CAD, PAD, and stroke/TIA.
Assessment of CKD
We assessed the presence of CKD based on measurements of eGFR and albuminuria. Stage of CKD was based on the participant’s most recent evaluated outpatient GFR within 18 months before the index date: >90 mL/min/1.73 m2 together with moderate or greater albuminuria (stage 1), 60 to 89 mL/min/1.73 m2 together with moderate or greater albuminuria (stage 2), 45 to 59 mL/min/1.73 m2 (stage 3a), 30 to 44 mL/min/1.73 m2 (stage 3b), and <30 mL/min/1.73 m2 (stages 4 and 5, with or without renal replacement therapy). People without stage 1 to 5 CKD were considered not to have CKD. eGFR was calculated using the CKD Epidemiology Collaboration (CKD-EPI) equation. Albuminuria (if available) was captured using the participant’s most recent outpatient measurement within 18 months before the index date using either the albumin:creatinine ratio (ACR), the protein:creatinine ratio (PCR), and the dipstick. A PCR assessment was used when ACR was not available, and dipstick results were used when PCR was not available. Measurements were categorized as follows: missing, none/mild (ACR <3 mg/mmol, PCR <15 mg/mmol, dipstick negative/trace), moderate (ACR 3-30 mg/mmol, PCR 15-50 mg/mmol, dipstick 1+), severe (ACR 31-220 mg/mmol, PCR 51-350 mg/mmol, dipstick 2+ and 3+), and nephrotic range (ACR >220 mg/mmol, PCR >350 mg/mmol, dipstick ≥4+). Participants with missing values for albuminuria were considered not to have albuminuria when categorizing CKD stage. We also did analyses that categorized participants in terms of eGFR only (ie, without consideration of albuminuria, using the same eGFR thresholds as above: >90, 60-89, 45-59, 30-44 and <30 mL/min/1.73 m2).
Other Variables and Antihyperglycemic Agents
Demographic variables included age, gender, urban or rural residence, duration of diabetes, laboratory measurements (glycated hemoglobin [A1C] and low-density lipoprotein cholesterol [LDL-C]), body mass index (BMI), and utilization of antihyperglycemic agents. The laboratory measurements were the most recent outpatient measures within 18 months on the index date. We identified participants with BMI ≥35 kg/m2 as in our prior work. 18
Use of an antihyperglycemic agent was defined as at least one prescription for an antidiabetic agent with a duration of at least 30 days within 18 months of the index date. Available agents were categorized into treatment classes: biguanide (metformin), dipeptidyl peptidase-4 (DPP-4) inhibitors (linagliptin, saxagliptin, sitagliptin), glucagon-like peptide-1 (GLP-1) receptor agonists (dulaglutide, exenatide, liraglutide), insulin, meglitinides (nateglinide, repaglinide), sodium-glucose cotransporter type 2 (SGLT-2) inhibitors (canagliflozin, dapagliflozin, empagliflozin), sulfonylureas (chlorpropamide, glibenclamide, gliclazide, glimepiride, tolbutamide), and other agents (acarbose, orlistat, pioglitazone, rosiglitazone). Fixed dose combinations comprised of 2 antihyperglycemic agents were also included if they were available in Alberta.
Statistical Analyses
We did analyses with Stata MP 15·1 (www.stata.com) and reported descriptive statistics—counts and percentages, or medians and interquartile range (IQR), as appropriate. Multiple subgroups were explored: primarily CKD stage and prior CVD (CAD, PAD, and stroke/TIA) but also A1C (<7%, 7%-8%, 8.1%-9%, >9%).
Results
Characteristics of Study Participants
Participant flow is shown in Supplemental Figure S1; 3 481 650 individuals were excluded since they did not have T2DM and a further 56 653 were excluded as they did not have an eGFR measurement in the 18 months prior to the index date, leaving 260 903 participants in the cohort. The median age of the cohort of adults with T2DM was 64 years.
There were slightly more men than women with T2DM (53.6% vs 46.4%), and 10.9% lived in rural communities (towns with <10 000 people). The median duration of T2DM was 7.7 years and 8.1% did not have A1C outpatient measurement in the prior 18 months. In those with measured A1C, slightly more than half (55.3%) had A1C <7%. Median eGFR was 83 mL/min/1.73 m2 and median LDL-C was 2.1 mmol/L. Albuminuria was not measured in 15.3% of the participants. In those with measured albuminuria, 19.9% had moderate-to-nephrotic range albuminuria. There were 12.9% of participants with a prior stroke or TIA, 11.7% with chronic depression, 10.6% with heart failure, 10.5% with CAD, 4.9% with dementia, and 3.4% with PAD. The distribution of antihyperglycemic medication use was as follows: 48.0% biguanides (all of which were metformin), 15.2% insulin, 14.4% sulfonylureas (90.9% of which were gliclazide), 11.8% DPP-4 inhibitors, 7.6% SGLT2 inhibitors, 3.7% meglitinides (all of which were repaglinide), 2.4% GLP-1 receptor agonists, and 1.9% use from other classes.
CKD Stage
Overall, 33.0% had CKD and 67.0% did not. Among those classified as having CKD, the majority had eGFR <60 mL/min/1.73 m2 (Table 1); 5.6% and 2.9% had advanced CKD, stages 3b and 4/5, respectively. Among those with CKD, age 65 years or older (15.4% vs 2.5%), women (9.3% vs 7.9%), rural participants (9.3% vs 8.5%; Table 2), participants with BMI ≥35 kg/m2 (10.1% vs 8.8%), severe albuminuria (34.9% vs 12.2% moderate vs 5.0% none/mild; Table 3), chronic heart failure (29.8% vs 6.0%; Table 4), and dementia (23.9% vs 7.7%) were all more likely to be associated with advanced CKD (stage 3b, 4, or 5) as compared with less advanced stages (1, 2, or 3a). As expected, duration with T2DM was longer for those with advanced CKD compared with those with stage 1, 2, or 3a CKD (13.3 vs 9.3 years; Table 3) and LDL-C was lower (1.8 vs 1.9 mmol/L). Stage 1 and 2 CKD was most common in participants with A1C >9% (Table 5); however, A1C level per se was not clearly associated with more advanced CKD.
CKD Stage, Prior CVD, and A1C Overall and by Age and Gender.
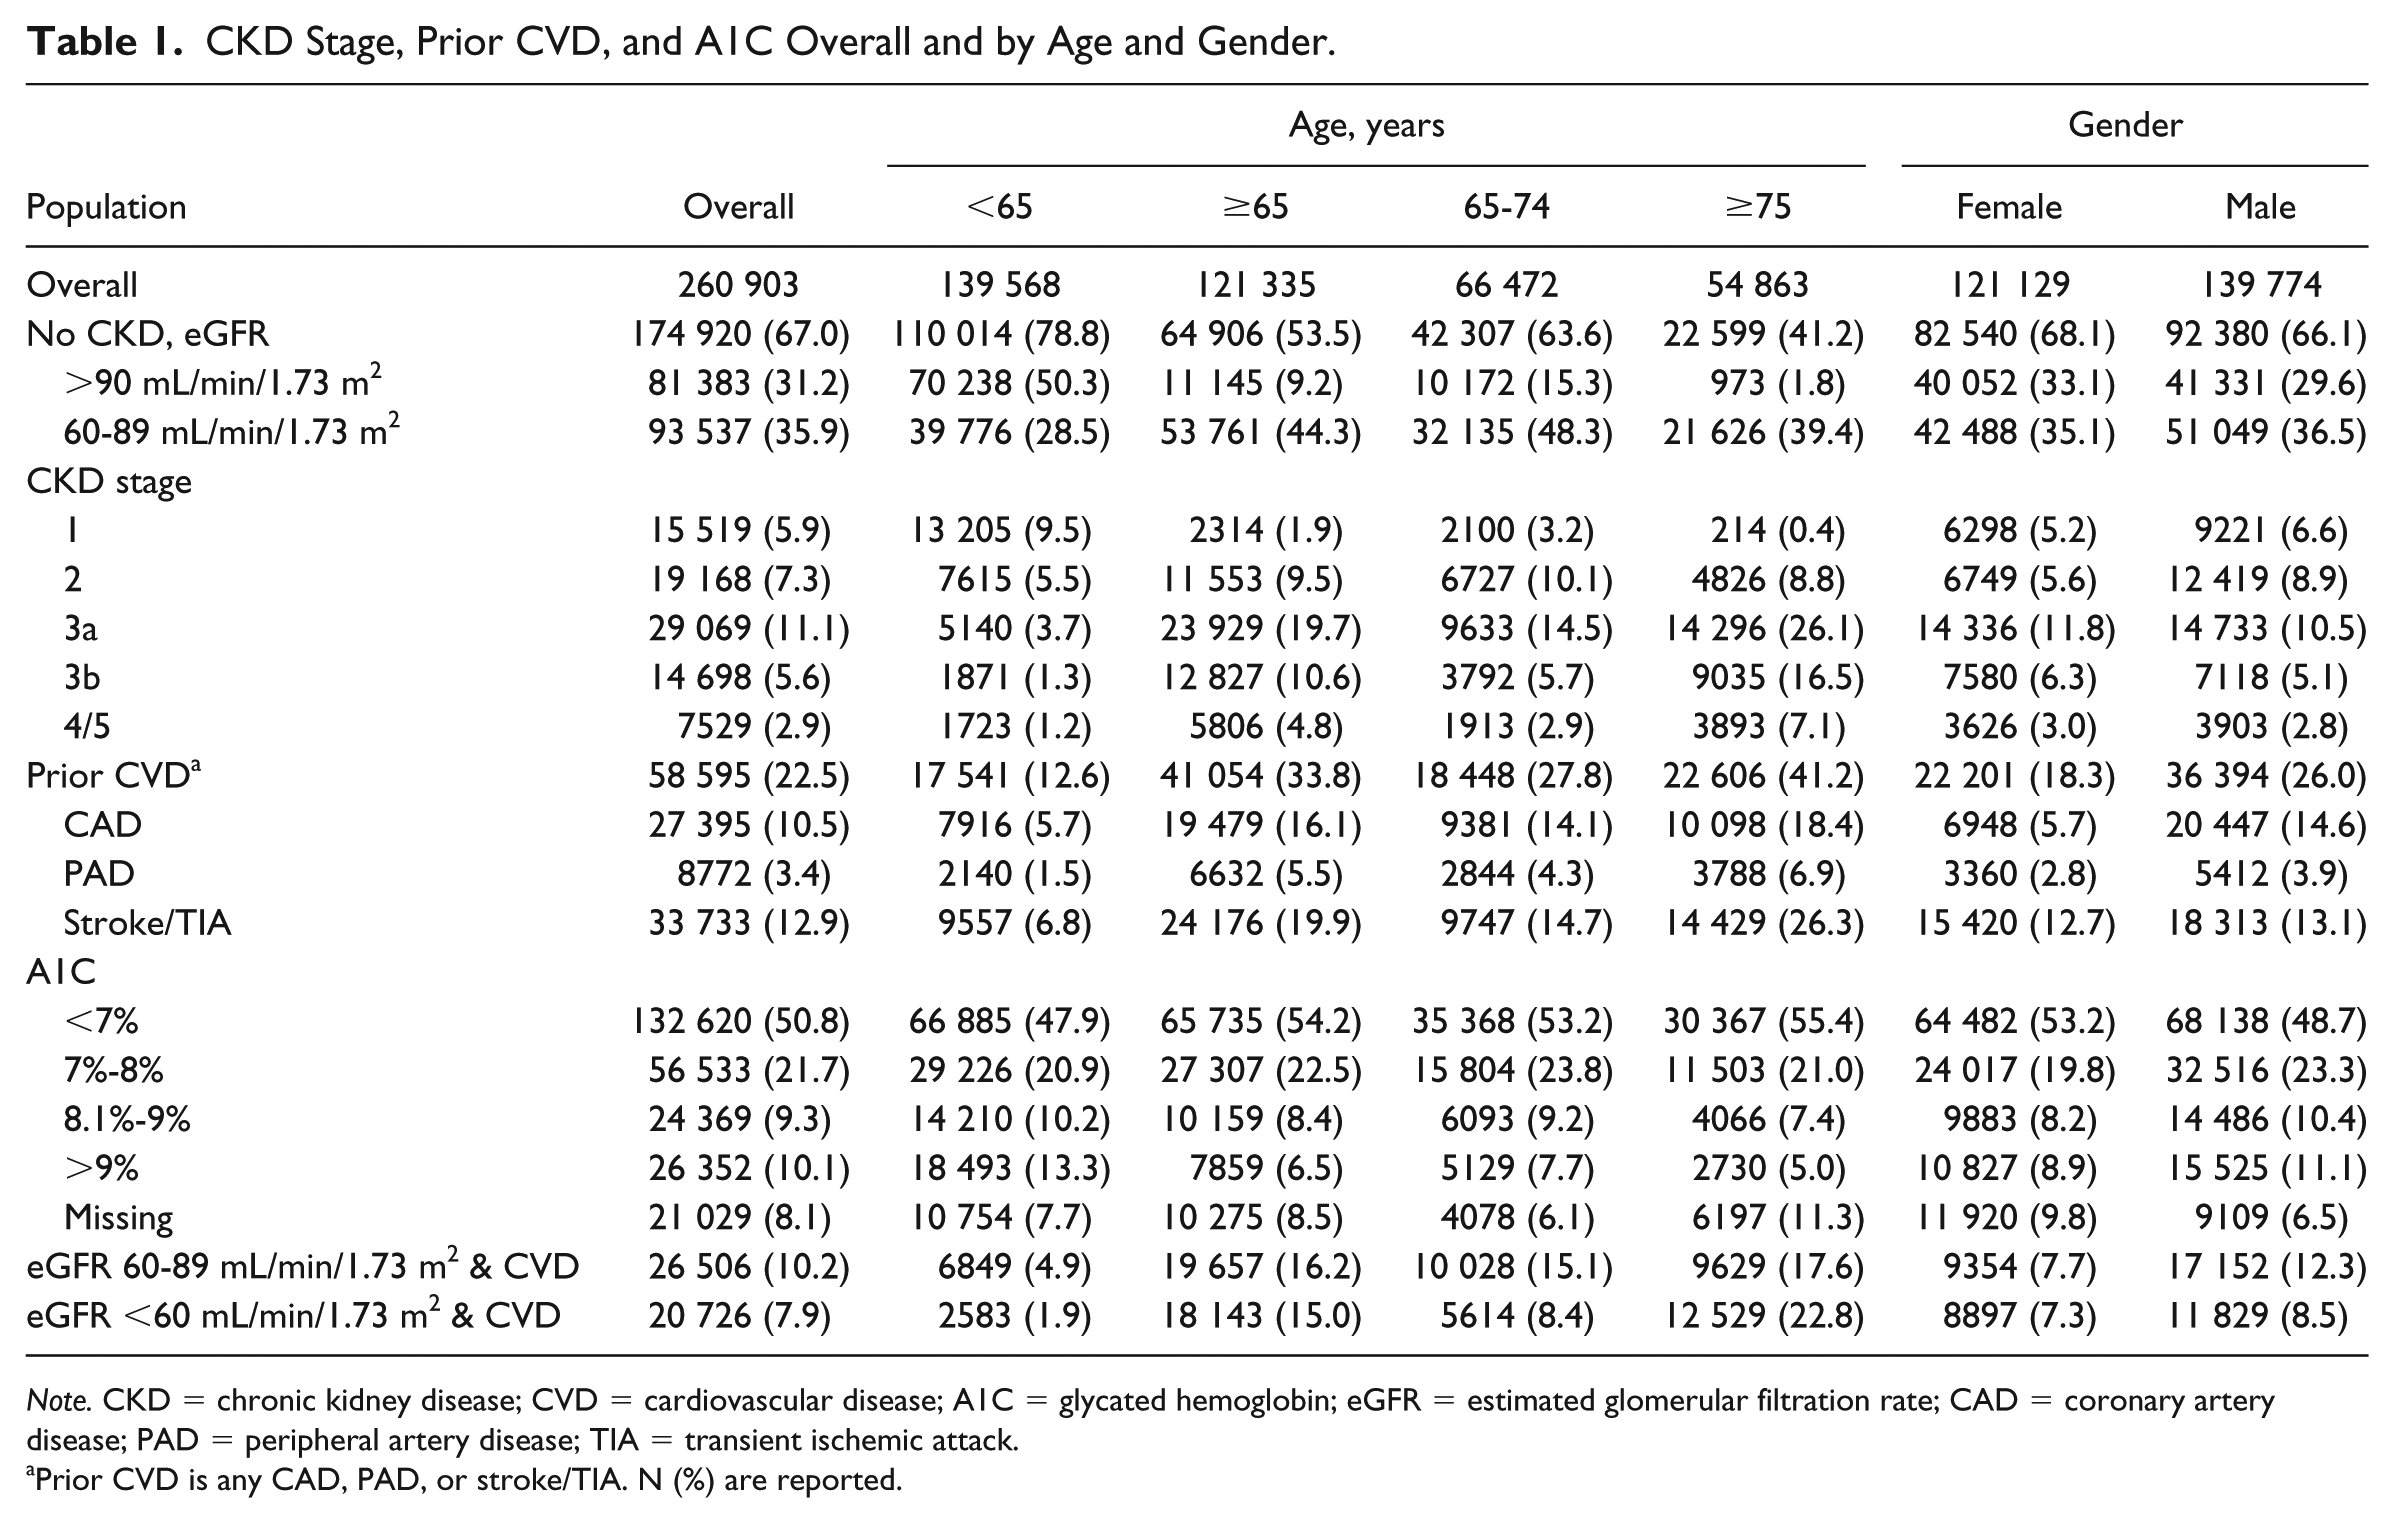
Note. CKD = chronic kidney disease; CVD = cardiovascular disease; A1C = glycated hemoglobin; eGFR = estimated glomerular filtration rate; CAD = coronary artery disease; PAD = peripheral artery disease; TIA = transient ischemic attack.
Prior CVD is any CAD, PAD, or stroke/TIA. N (%) are reported.
CKD Stage, Prior CVD and A1C by Region and BMI.
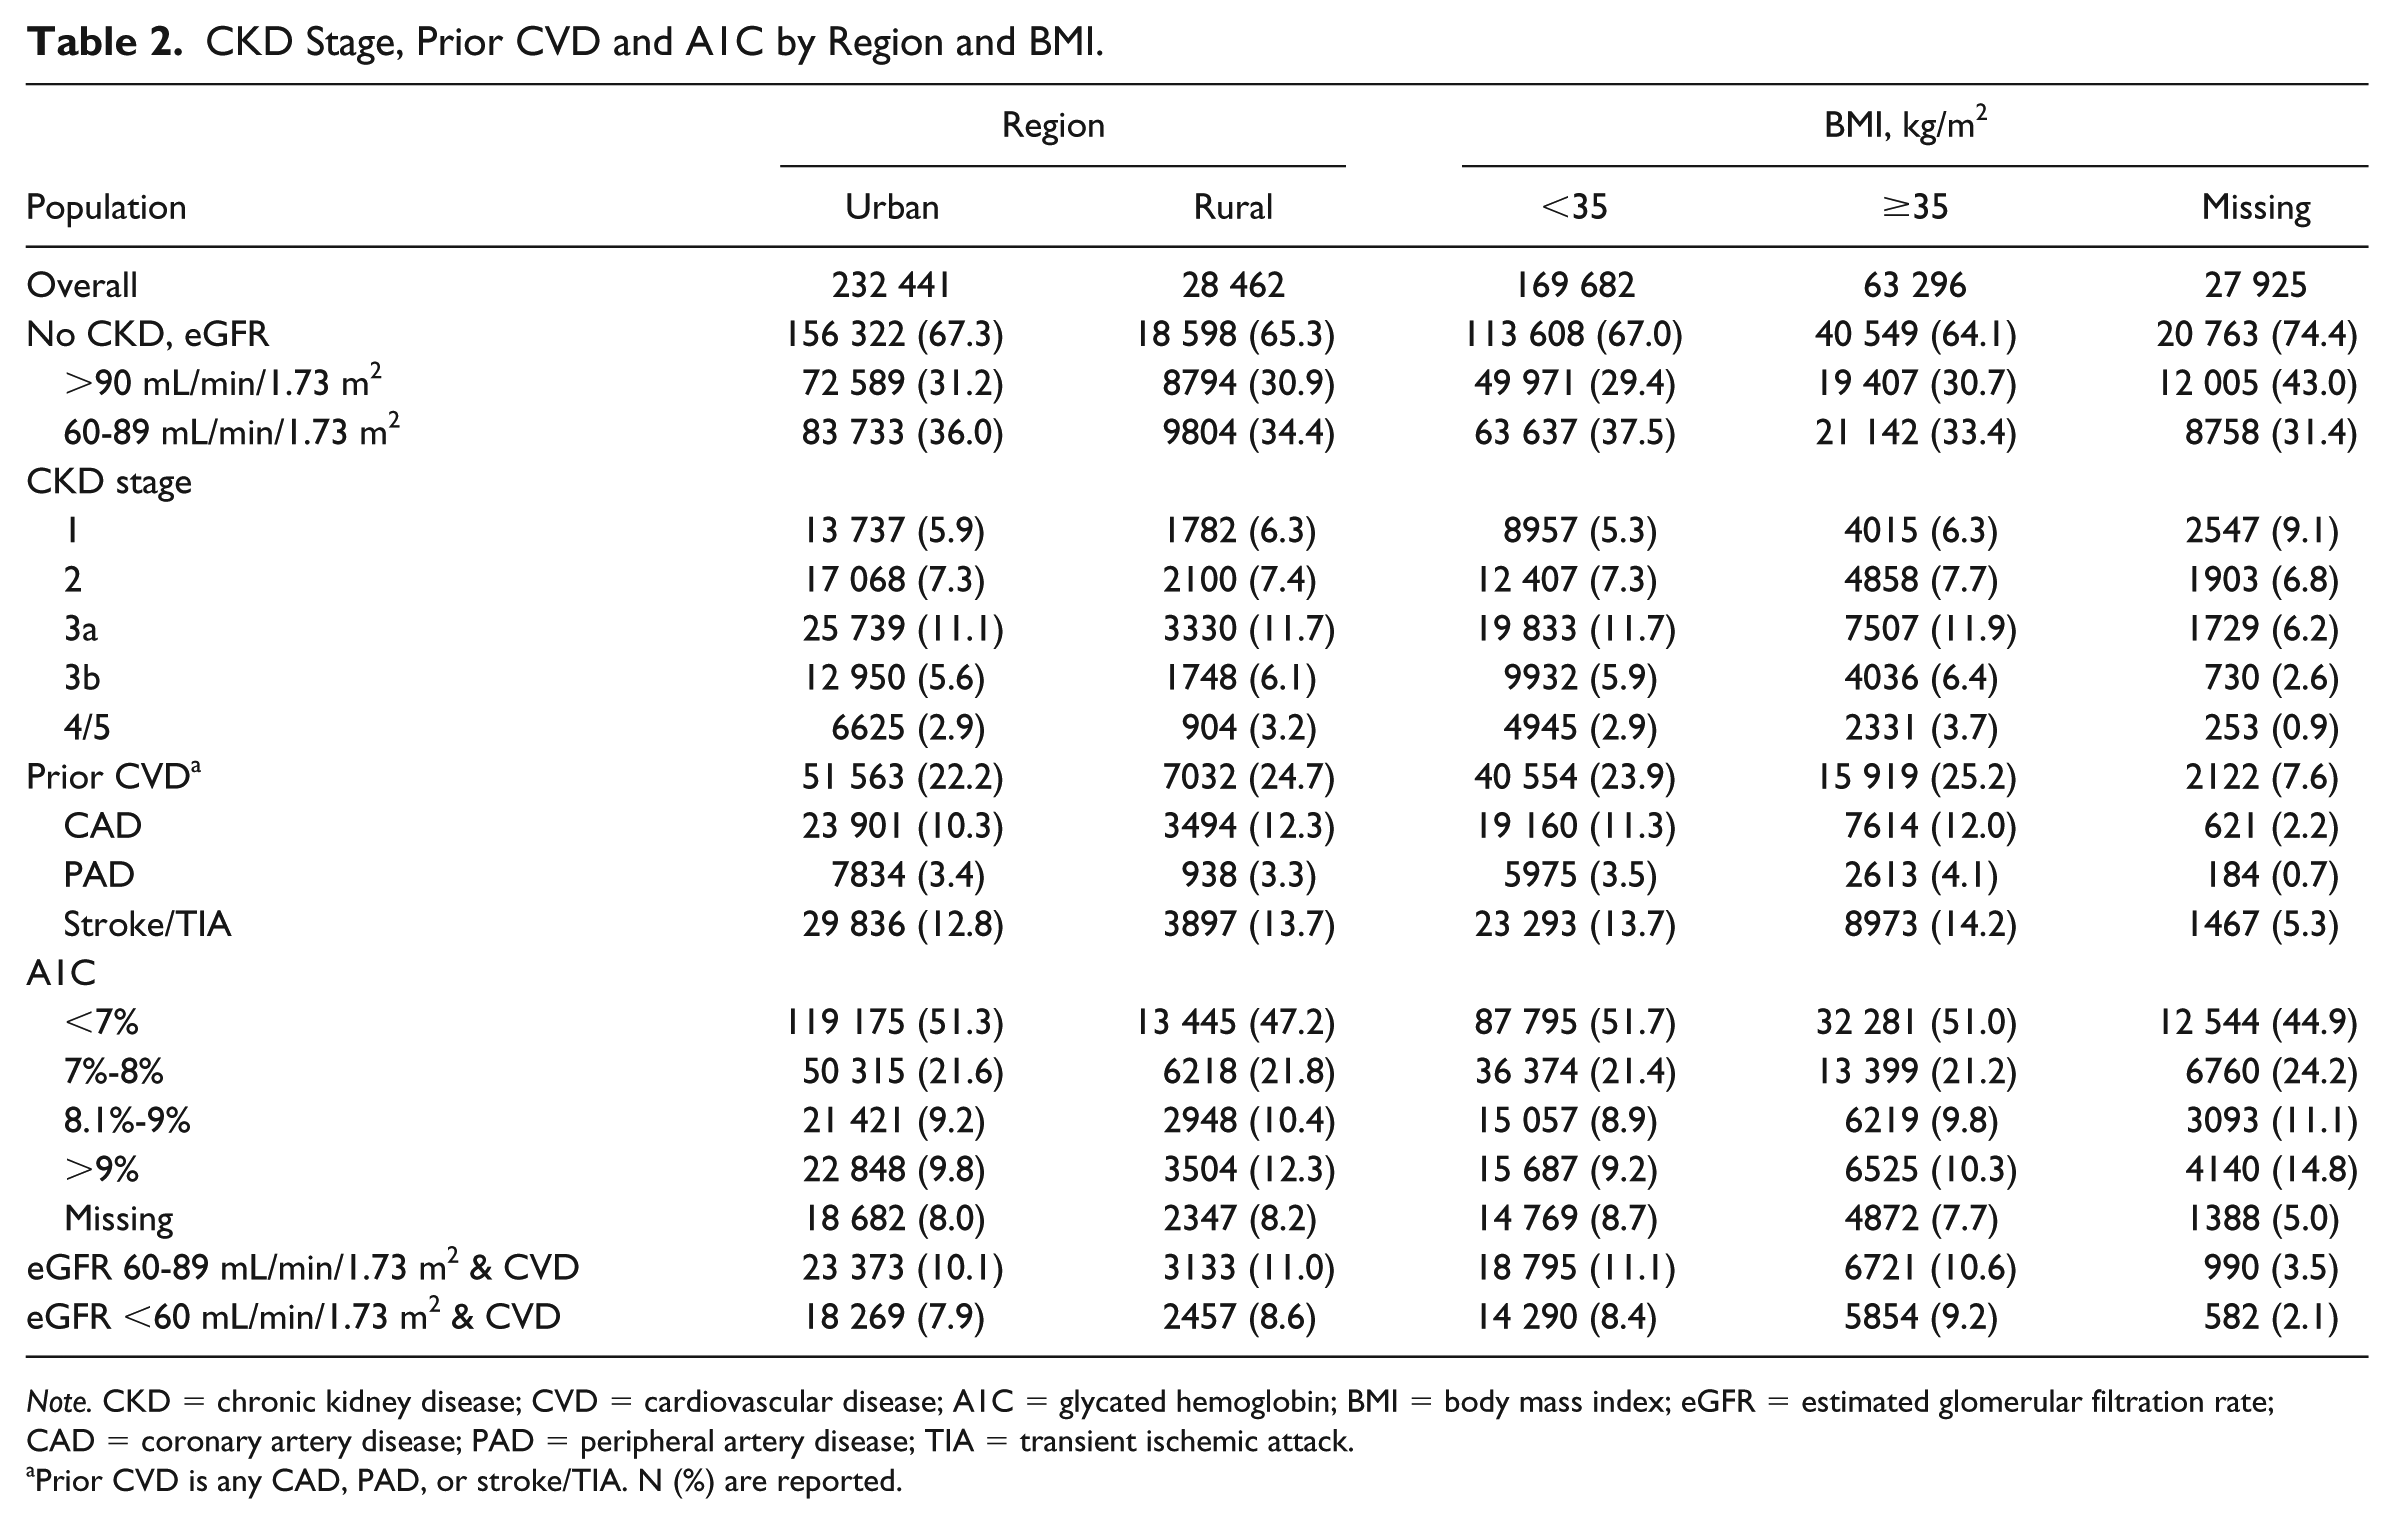
Note. CKD = chronic kidney disease; CVD = cardiovascular disease; A1C = glycated hemoglobin; BMI = body mass index; eGFR = estimated glomerular filtration rate; CAD = coronary artery disease; PAD = peripheral artery disease; TIA = transient ischemic attack.
Prior CVD is any CAD, PAD, or stroke/TIA. N (%) are reported.
CKD Stage, Prior CVD, and A1C by Duration of T2DM Years, LDL-C, and Albuminuria.
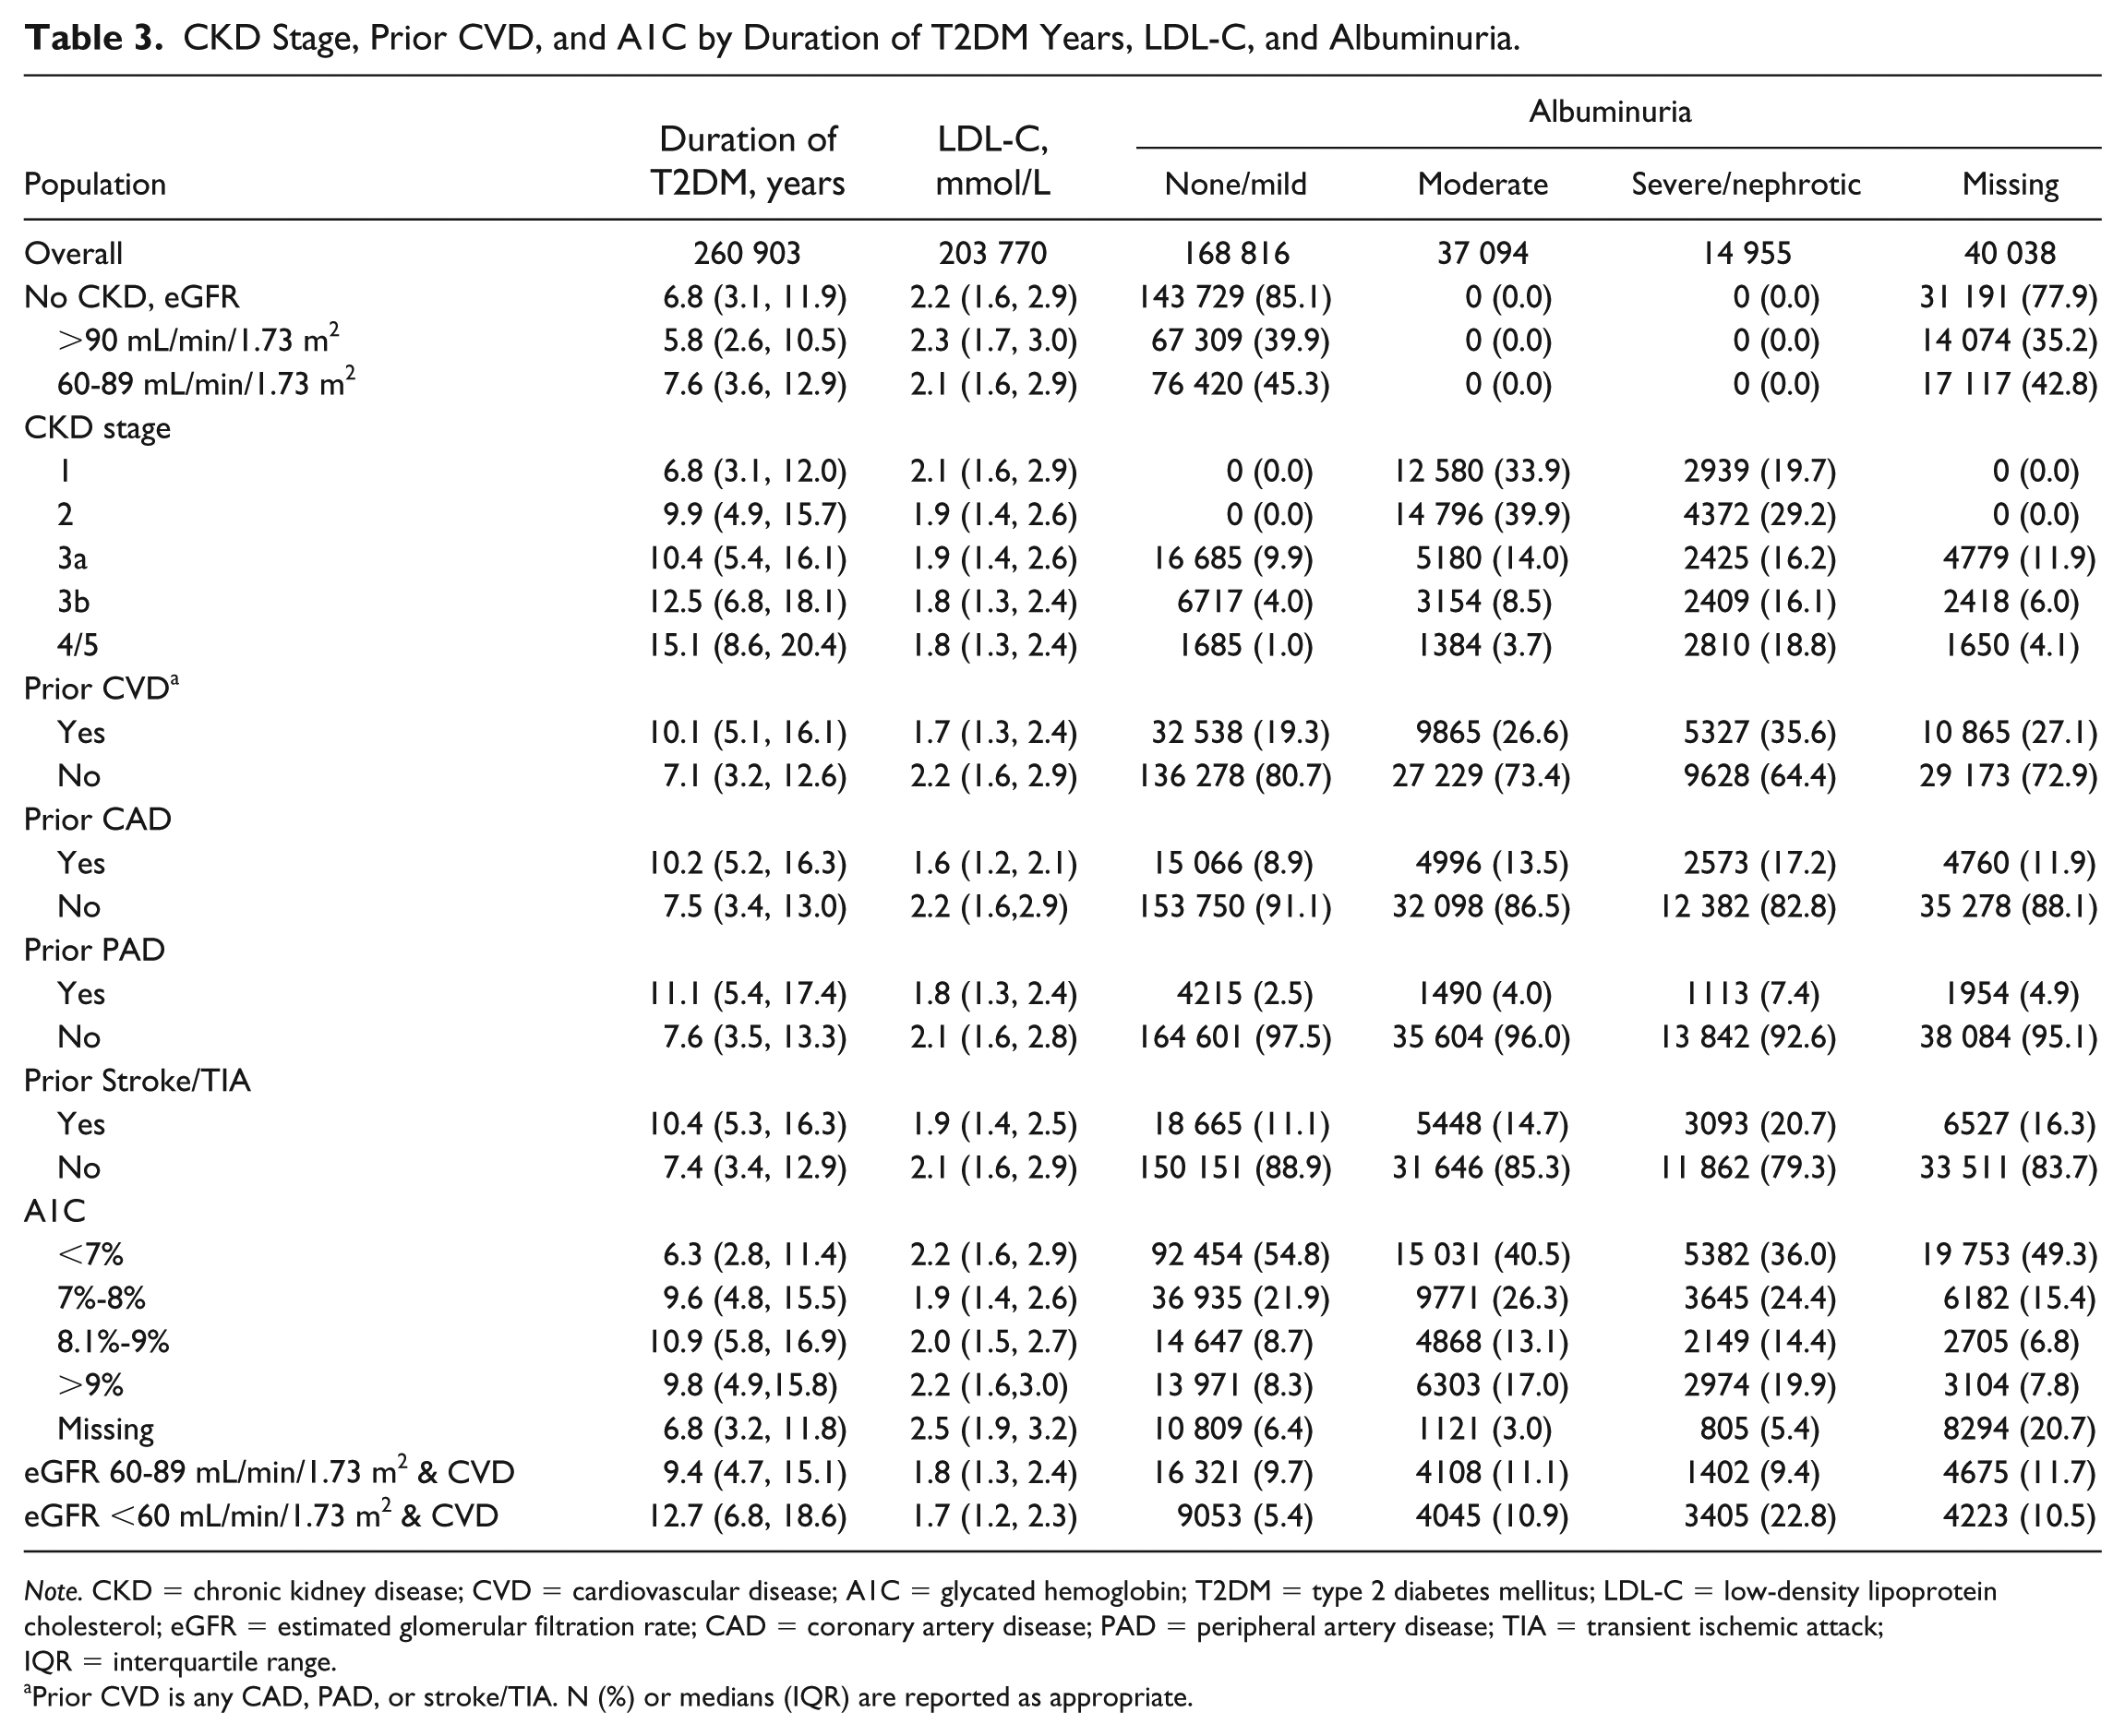
Note. CKD = chronic kidney disease; CVD = cardiovascular disease; A1C = glycated hemoglobin; T2DM = type 2 diabetes mellitus; LDL-C = low-density lipoprotein cholesterol; eGFR = estimated glomerular filtration rate; CAD = coronary artery disease; PAD = peripheral artery disease; TIA = transient ischemic attack; IQR = interquartile range.
Prior CVD is any CAD, PAD, or stroke/TIA. N (%) or medians (IQR) are reported as appropriate.
CKD Stage, Prior CVD, and A1C, by Chronic Heart Failure, Dementia, and Depression.

Note. CKD = chronic kidney disease; CVD = cardiovascular disease; A1C = glycated hemoglobin; CAD = coronary artery disease; eGFR = estimated glomerular filtration rate; PAD = peripheral artery disease; TIA = transient ischemic attack.
Prior CVD is any CAD, PAD, or stroke/TIA. N (%) are reported.
CKD Stage and Prior CVD, by A1C.

Note. CKD = chronic kidney disease; CVD = cardiovascular disease; A1C = glycated hemoglobin; eGFR = estimated glomerular filtration rate; CAD = coronary artery disease; PAD = peripheral artery disease; TIA = transient ischemic attack.
Prior CVD is any CAD, PAD, or stroke/TIA. N (%) are reported.
The prevalences of the different eGFR categories were 96 902 (37%), 112 705 (43%), 29 069 (11%), 14 698 (6%), and 7529 (3%) for eGFR >90, 60-89, 45-59, 30-44, and <30 mL/min/1.73 m2, respectively (Supplemental Table S1).
Figure 1 shows prevalence of antihyperglycemic class use by CKD stage. Biguanides, followed by insulin, sulfonylureas, and DPP-4 inhibitors were the drug classes most frequently used by participants with CKD stages 1 through 3b. In participants with CKD stage 4/5, insulin followed by biguanides, sulfonylureas, meglitinides, and DPP-4 inhibitors were most frequently used.

Any use of antihyperglycemic classes by CKD stage.
Cardiovascular Disease
Three quarters of the participants had no prior CVD (Table 1). In those with prior CVD, stroke/TIA was the most frequent (12.9%) followed by CAD (10.5%) then PAD (3.4%). Participants 65 years or older (33.8% vs 12.6%), men (26.0% vs 18.3%), rural participants (24.7% vs 22.2%), participants with BMI ≥35 kg/m2 (25.2% vs 23.9%), severe albuminuria (35.6% vs 26.6% moderate vs 19.3% none/mild; Table 3), chronic heart failure (57.9% vs 18.3%; Table 4), dementia (50.8% vs 21.0%), and depression (25.5% vs 22.1%) were more likely to have prior CVD. Duration of T2DM was longer (10.1 vs 7.1 years; Table 3) and LDL-C was lower (1.7 vs 2.2 mmol/L) for those with prior CVD. The prevalence of prior CVD was highest in participants with A1C 8.1% to 9% (Table 5). A1C level per se was not clearly associated with a prior history of CVD.
The prevalence of any CVD, CAD, PAD, or stroke/TIA was 14.4%, 6.8%, 2.0%, 7.7% for stage 1, 28.8%, 14.4%, 4.3%, 15.6% for stage 2, 35.7%, 17.2%, 5.6%, 21.2% for stage 3a, 44.3%, 21.7%, 8.1%, 27.0% for stage 3b, and 50.9%, 23.6%, 15.2%, 30.2% for stage 4/5 CKD, respectively.
Figure 2 shows prevalence of antihyperglycemic class use by prior CVD. Biguanides, followed by insulin, sulfonylureas, DPP-4 inhibitors, SGLT2 inhibitors, and meglitinides were the classes most frequently used by participants with prior CVD.

Any use of antihyperglycemic classes by prior CVD.
Figure 3 and Table 6 show use of antihyperglycemic class use by CKD stage and prior CVD. Supplemental Tables S2 and S3 show use of monotherapy and antihyperglycemic agent use alone or in combination, respectively, as a function of CKD stage. Use of DPP-4 inhibitors tended to be higher for people with CKD than without, but use became progressively less common in parallel with lower eGFR. Similar findings were observed for all other agents except for insulin and meglitinide monotherapy and in combination, which was more common at lower eGFR. Supplemental Table S4 shows antihyperglycemic agent use alone or in combination, respectively, as a function of prior CVD.

Use of antihyperglycemic classes by CKD stage and prior CVD.
Anti-Hyperglycemic Class by CKD Stage and Prior CVD.
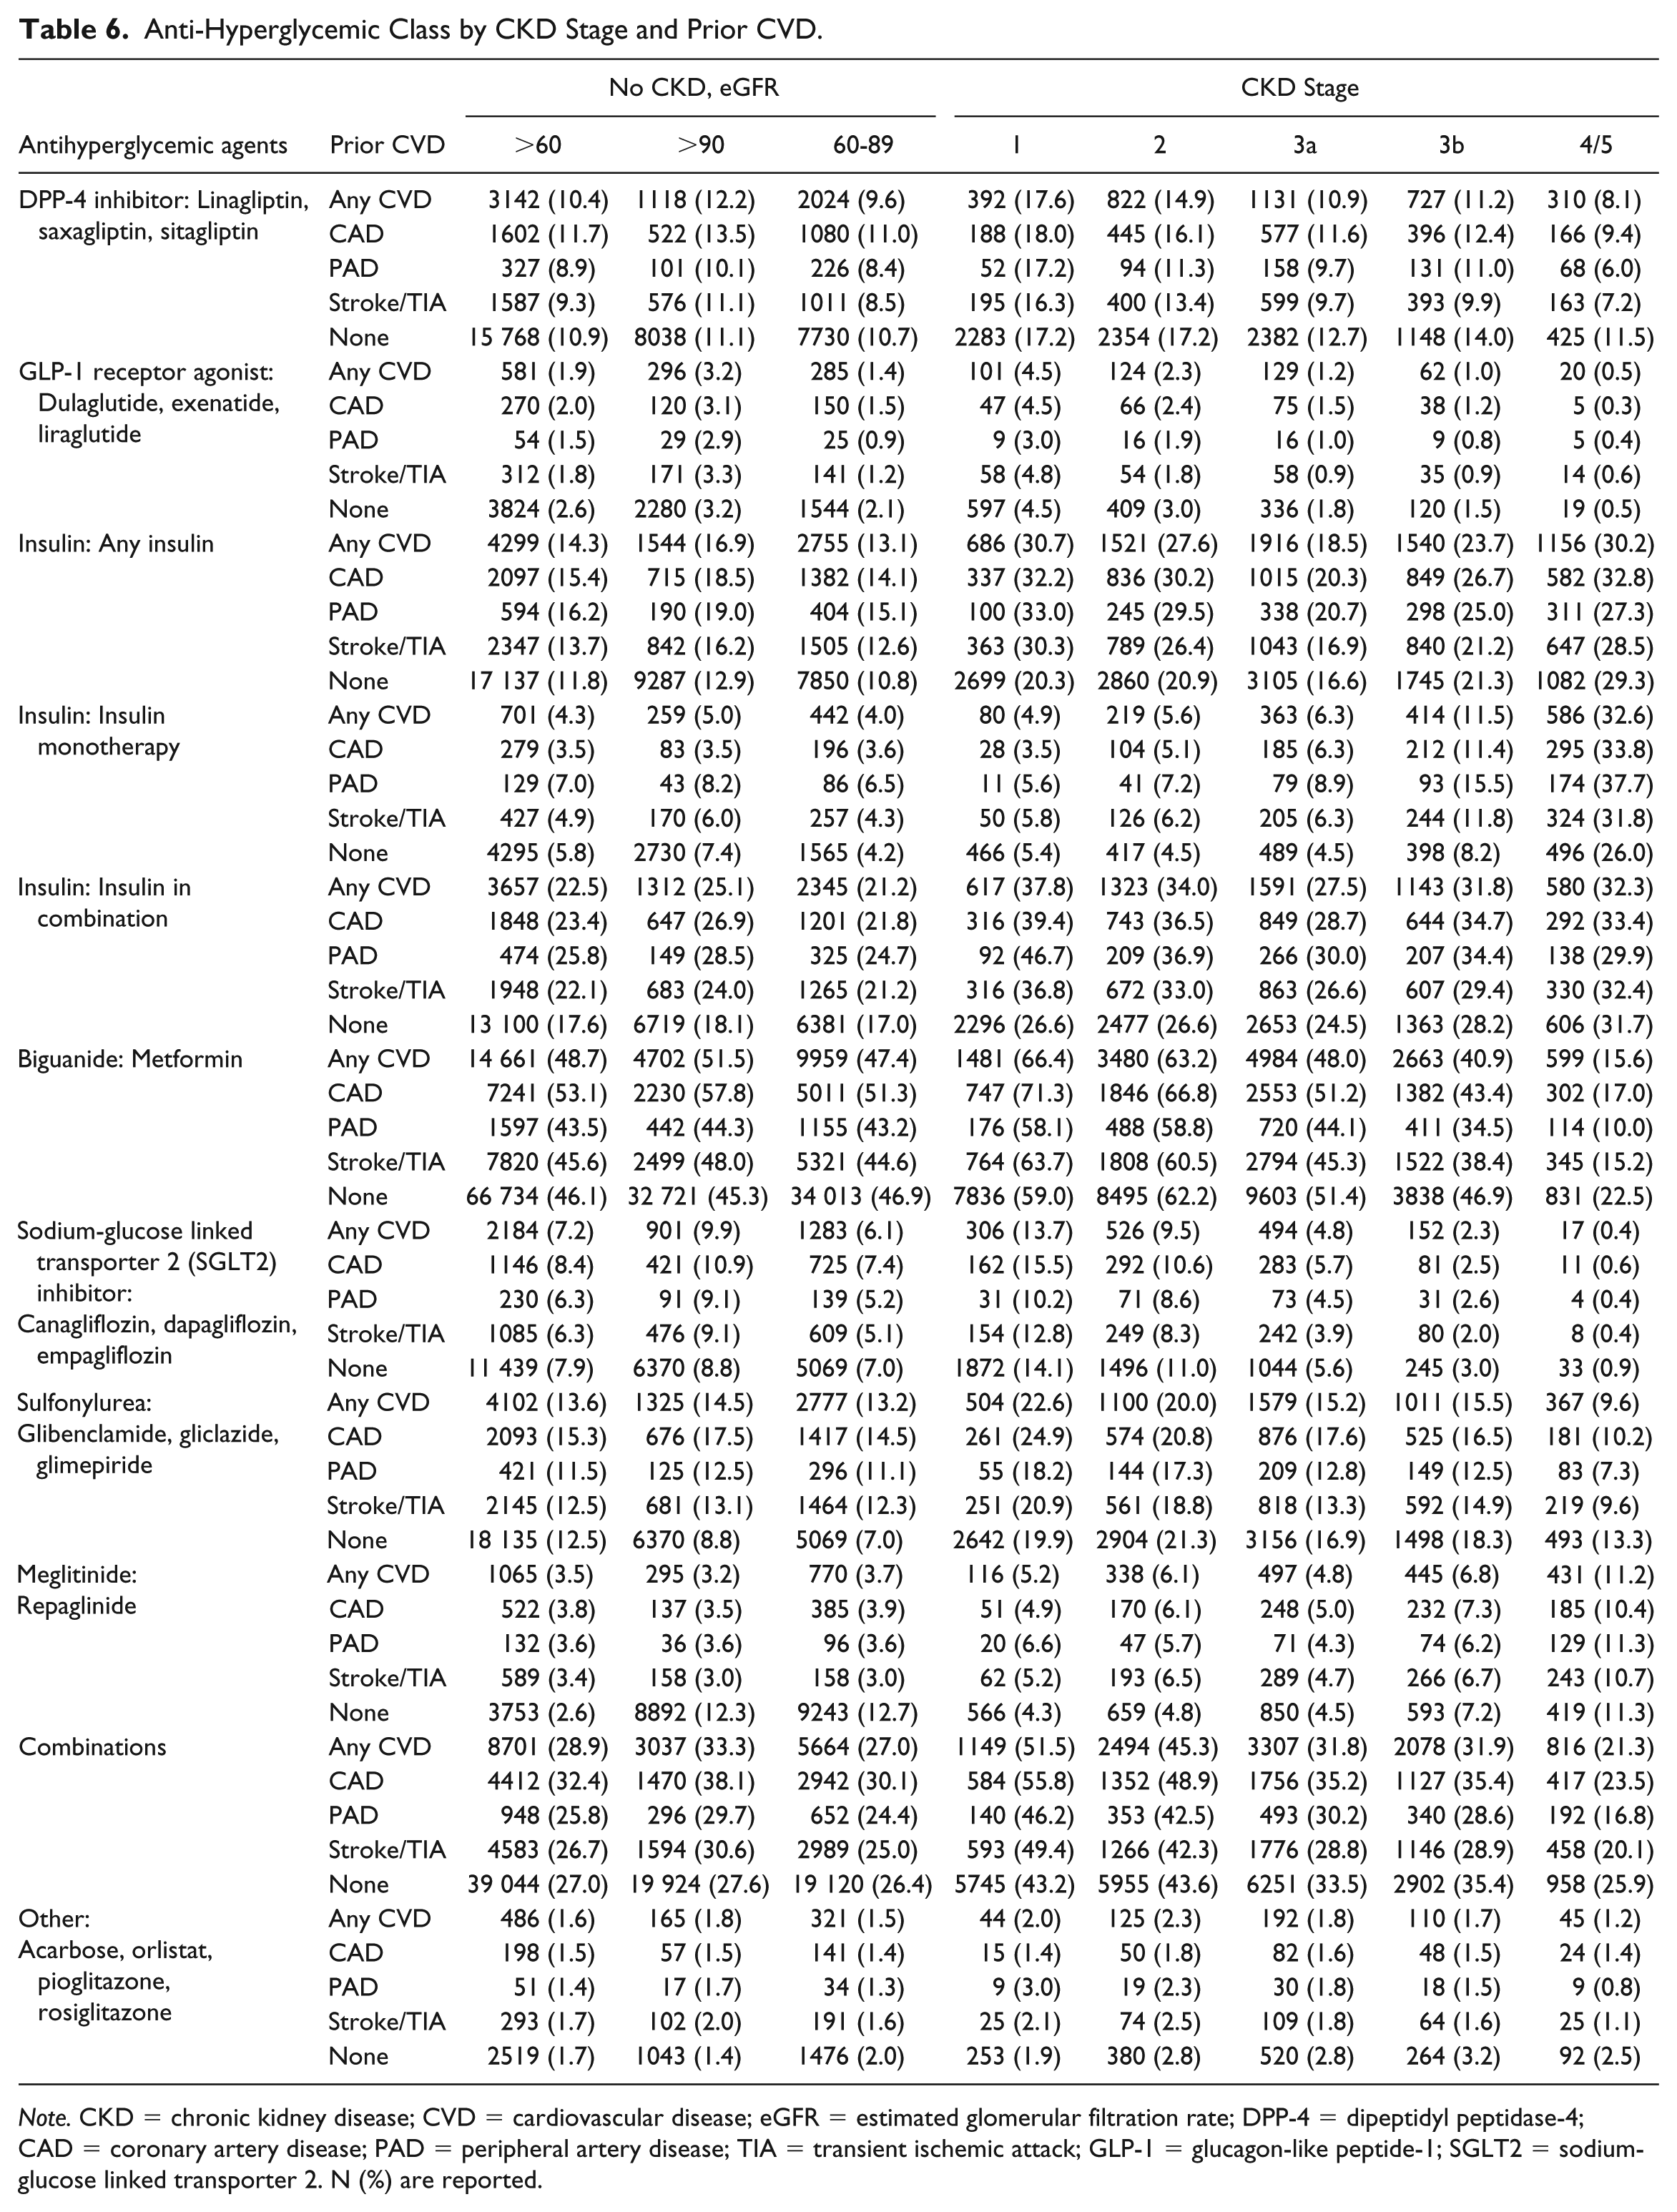
Note. CKD = chronic kidney disease; CVD = cardiovascular disease; eGFR = estimated glomerular filtration rate; DPP-4 = dipeptidyl peptidase-4; CAD = coronary artery disease; PAD = peripheral artery disease; TIA = transient ischemic attack; GLP-1 = glucagon-like peptide-1; SGLT2 = sodium-glucose linked transporter 2. N (%) are reported.
A1C Management
About half of the participants had A1C <7% (Table 1): participants 65 years and older (54.2% vs 47.9%), women (53.2% vs 48.7%), urban participants (51.3% vs 47.2%), no/mild albuminuria (54.8% vs 40.5% moderate vs 36.0% severe), and depression (52.6% vs 50.6%) were more likely to have A1C <7%. Participants younger than 65 years (13.3% vs 6.5%), men (11.1% vs 8.9%), rural participants (12.3% vs 9.8%), participants with BMI ≥35 kg/m2 (10.3% vs 9.2%), severe albuminuria (19.9% vs 17.0% moderate vs 8.3% none/mild; Table 3), and depression (11.0% vs 10.0%) were more likely to have A1C >9%. The level of A1C control was not clearly associated with duration of T2DM, or with LDL-C level (Table 3).
Discussion
This population-based study of 260 903 adult residents of Alberta provides detailed estimates of the prevalence of T2DM as a function of CVD and CKD status, including use of antihyperglycemic medications and a detailed assessment of common comorbidities. There were 6 key findings in this population of people with diabetes, nearly half of whom were aged ≥65 years. First, approximately one third of people with diabetes had CKD and nearly two-thirds had eGFR
Previous Work
A previous population-based study explored health care use among 569 384 adults with diabetes in Ontario, Canada. 20 The prevalence of CKD stage by eGFR is not reported, but can be calculated from the numbers in the article; the prevalence of CKD was 35.2%, 44.6%, 17.2%, and 2.3% for >90, 60-89, 30-59, and <30 mL/min/1.73 m2, respectively, which is very similar to the results of our study. Our article extends the findings from the Ontario study by including results related to albuminuria and by including detailed information on antihyperglycemic medication use. A previous report from the Canadian Health Measures Survey used eGFR and albuminuria to identify the presence of CKD, and suggested that the prevalence of CKD in the general Canadian population during 2007-2009 was 12.5% 21 ; the higher prevalence observed in the current population is consistent with the known status of diabetes as a major risk factor for CKD. A recent study from the US National Health and Nutrition Examination Survey (NHANES) 2007-2014 22 demonstrated that the prevalences of stage 3a, 3b, and 4 or 5 CKD among people with diabetes were 12.5%, 5.3%, and 2.2%, respectively, similar to the 11.1%, 5.6%, and 2.9% observed in the current study. These findings are generally similar to the prevalences of the same CKD stages reported among a population of Spanish patients seen in primary care clinics (11.6%, 5.2%, and 1.2%, respectively) 23 ; the lower proportion of more severe CKD in the latter study may reflect the discharge of such patients from primary care settings to nephrology subspecialty practices.
Our study also reports on the total prevalence of mildly reduced eGFR (60-89.9 mL/min/1.73 m2), most cases of which do not constitute CKD because of the absence of albuminuria. Specifically, of the 112 705 people in the current study with eGFR 60 to 89.9 mL/min/1.73 m2, only 19 168 (17.0%) had CKD.
We did not identify prior studies describing secular trends in the prevalence of CKD among Canadian patients with diabetes. However, studies from the United States suggest that the prevalence of CKD among US patients with diabetes has been approximately stable from 2007 to 2012. 24
Limitations
This study has several important strengths, including its large size, population-based design, and its use of eGFR and albuminuria to classify participants with respect to CKD status. However, the study also has several limitations that should be considered when interpreting results. First, like all studies based on administrative data, the findings could be influenced by measurement error (eg, accuracy of diagnostic and procedural codes and prescription drug codes used). Second, this analysis was based on data from patients treated in a single Canadian province, and so might not be representative of Canadians living in other provinces where the burden of disease, management practices, or reimbursement status may vary. Third, we used administrative data to identify people with diabetes. The algorithm that we used has 80% sensitivity and 86% positive predictive value for type 1 and type 2 diabetes, although we excluded patients with any claim for type 1 diabetes, which may have slightly altered these diagnostic characteristics of the algorithm. Nonetheless, because no algorithm is perfectly sensitive and because not all cases of diabetes have been identified in clinical practice, our data likely underestimate the true prevalence of T2DM in Alberta. Fourth, not all Alberta patients had assessments of albuminuria, and thus our findings underestimate the true prevalence of CKD among those with diabetes. Finally, we required all patients to have a minimum of 1 year of medical records available prior to their last encounter in the database, which could also have influenced the generalizability of our findings.
Conclusion
In summary, this study reports on the demographic and clinical characteristics of Alberta patients with T2DM by CKD stage and CVD status and type, including a detailed examination of the number and type of antihyperglycemic agents prescribed in this population. These findings will be useful to clinicians, researchers, and policy makers seeking to understand the burden of diabetes-related kidney disease as well as the budget implications and potential clinical benefits of expanded use of antihyperglycemic use in this population.
Supplemental Material
Supplemental_Figures_and_tables – Supplemental material for Characteristics of Adults With Type 2 Diabetes Mellitus by Category of Chronic Kidney Disease and Presence of Cardiovascular Disease in Alberta Canada: A Cross-Sectional Study
Supplemental material, Supplemental_Figures_and_tables for Characteristics of Adults With Type 2 Diabetes Mellitus by Category of Chronic Kidney Disease and Presence of Cardiovascular Disease in Alberta Canada: A Cross-Sectional Study by Marcello Tonelli, Natasha Wiebe, Jean-Francois Richard, Scott W. Klarenbach and Brenda R. Hemmelgarn in Canadian Journal of Kidney Health and Disease
Footnotes
Ethics Approval and Consent to Participate
The institutional review boards at the Universities of Alberta (Pro00053469) and Calgary (REB16-1575) approved this study. This is a study of administrative data without any intervention. No study participants were placed at risk as a result of the study. Informed consent was not required.
Consent for Publication
All authors have reviewed a final version of the manuscript and have consented to publication.
Availability of Data and Materials
Declaration of Conflicting Interests
The author(s) declared the following potential conflicts of interest with respect to the research, authorship, and/or publication of this article: Marcello Tonelli had access to all the data used in these analyses and is the guarantor. Marcello Tonelli was supported by the David Freeze Chair in Health Services Research at the University of Calgary. Brenda Hemmelgarn was supported by the Roy and Vi Baay Chair in Kidney Research at the University of Calgary. She has received funding from Amgen for investigator-initiated research. Scott Klarenbach was supported by the Kidney Health Research Chair and the Division of Nephrology at the University of Alberta. He is also the director of the Real World Evidence Unit at the University of Alberta, which includes engagement in industry sponsored real world evidence studies. He has received no research or direct funding from industry. J-F Richard is an employee of Merck Canada, Incorporated. This study is based in part by data provided by Alberta Health and Alberta Health Services. The interpretation and conclusions contained herein are those of the researchers and do not represent the views of the Government of Alberta or Alberta Health Services. Neither the Government of Alberta/Alberta Health nor Alberta Health Services expresses any opinion in relation to this study.
Funding
The author(s) disclosed receipt of the following financial support for the research, authorship, and/or publication of this article: This work was funded by Merck Canada, Incorporated. The sponsor had the right to comment on the manuscript prior to submission but the final decisions about the content of the manuscript and the submission of the manuscript remained with Marcello Tonelli.
Supplemental Material
Supplemental material for this article is available online.
References
Supplementary Material
Please find the following supplemental material available below.
For Open Access articles published under a Creative Commons License, all supplemental material carries the same license as the article it is associated with.
For non-Open Access articles published, all supplemental material carries a non-exclusive license, and permission requests for re-use of supplemental material or any part of supplemental material shall be sent directly to the copyright owner as specified in the copyright notice associated with the article.