
Abstract
In this paper, we empirically test whether the spread of political symbols in Twitter is due to complex contagion. We analyzed behavior consisting of editing the Twitter account name to include an icon with a yellow ribbon; a symbol that represents the demand for the release of imprisoned Catalan politicians and civil leaders. To test this hypothesis, we used a behavioral, non-reactive, relational, and dynamic dataset of a large sample of potential users. First, we show that the probability of displaying a ribbon is associated with the proportion of peers who also display it (friends that share their support for the political cause). Second, we rule out alternative explanations as simple contagion and homophily. To rule out simple contagion, we run three empirically calibrated, agent-based simulations. We use our dataset to rule out homophily. And third, we suggest that adoption cannot be interpreted as the result of a compliance mechanism or as the result of normative pressures. Instead, the most plausible micro-level generative mechanism that leads to a complex contagion pattern is a peer learning process. Our study makes several contributions to the field. We show how digital data can be effectively used to identify new explananda and test the plausibility of competing behavioral explanatory mechanisms. We also contribute to the development of the theory of complex contagions. Our study widens the set of conditions for complex contagion and the set of reasons to explain why complex contagion might occur.
Introduction
In this paper, we analyze a case study on the diffusion of a political symbol among a political community in Twitter. At the height of the Catalan conflict in 2017, several politicians and civil leaders were sent to prison or went into exile and the yellow ribbon appeared as a symbol representing the demand for their release and safe return. In Twitter, many users changed their account names to include a yellow ribbon. This behavior rapidly spread, mostly among the pro-independence community. The study aims to determine the social mechanisms that provide the best explanation for the diffusion of this behavior.
Our study makes several theoretical and methodological contributions to the field. First, we show how digital data, even with its important limitations, can be effectively used for explanatory purposes. The empiricist view that Big Data can “speak for itself” without the help of strong theories has been challenged by authors from different backgrounds (see, for example, Keuschnigg et al., 2018; Kitchin, 2014; Törnberg and Uitermark, 2021). Despite their different approaches to social research, the authors agree in the need for a theory grounded approach to computational social science. Analytical sociologists have made the case that sociology, in general (Hedström, 2005; Manzo, 2014) and digital/computational sociology, in particular (Keuschnigg et al., 2018; Spaiser, 2021) should become a more explanatory-oriented approach. Sociological research should aim to unravel the micro-level mechanisms that explain the social, macro-level aggregate outcomes that we observe using statistics. Digital data is therefore seen as an opportunity for identifying new explananda and building new mechanism-based and empirically tested theories of their generative processes. Here we show how Twitter data can be useful for both purposes.
Second, our paper is focused on the idea that the rich, finely grained, relational, and dynamic datasets—built with the digital footprints left by our online behavior—could constitute an opportunity for empirically testing the plausibility of competing behavioral explanatory mechanisms. While traditional data sources make it almost impossible to follow Elster's (2015) suggestion of using the hypothetico-deductive method to build hypotheses of causal mechanisms and to test some of their observational consequences—as a way of constructing intentional explanations—we aim to show that digital data can be creatively used for that specific purpose.
Third, the paper also makes a contribution to the development of Centola and Macy's theory of complex contagions (Centola and Macy, 2007; Centola, 2010, 2018). According to this theory, information and diseases are characterized by simple contagion: one contact with a single carrier can be enough for the disease or the information to be transmitted. However, many social behaviors spread through complex contagion: the adoption of an observed behavior only takes place when the agent is exposed to multiple sources of activation. Several behaviors and attitudes have been shown to spread through complex contagion (for an overview of this field of research, see Guilbeault et al., 2018), but what about political symbols? Could the use of the rainbow to signal support for the LGBT movement, the letter A surrounded by a circle to signal support for the anarchist movement, the raised fist to signal support for the Black Lives Matter movement, etc., be considered complex contagion? Given the importance of symbols in the political arena (see, for example, Aneckstein, 1972), it is somewhat surprising that there is very little research which focuses on this question (for an exception, see State and Adamic, 2015). As a result, our research presents one of the first empirical studies on the complex contagion of political symbols.
In our case, the theoretical relevance of finding empirical evidence for the complex contagion of political symbols is twofold. On the one hand, the theory states that complex contagion often occurs when adopting innovative behavior is considered costly and/or risky and therefore there is initial resistance to adoption (Centola, 2021a). In contrast, we found support for the hypothesis of complex contagion even in low-risk/low-cost behavior among people who would usually not resist adoption. This is an important contribution to the general hypothesis on the paramount role of complex contagion in the diffusion of political behaviors. In turn, Centola (2021a, 2021b) identified four mechanisms to explain why complex contagion might be required for adoption: social coordination, legitimacy, credibility and emotional excitement. However, our research found evidence of complex contagion as a consequence of a fifth reason: social learning. We present evidence that shows that when peers adopt certain behaviors, it sends a signal providing information of, and suggesting, a new and original way of expressing a common political belief. Adoption, in this case, is dependent on the strength of the signal, given that it conveys information on the strength of the social suggestion of expressing a common belief in a particular way. This is not social coordination (adoption is not more or less useful depending on the number of adopters, since the behavior consists of an individual expression of political identity), it is not legitimacy (the symbol was already legitimated by the political and civil organizations that proposed it), it is not credibility (no information regarding the risk or usefulness of the behavior is required) and it is not emotional excitement (displaying the symbols does not require nor produces any kind of collective excitement). Our study, therefore, widens the set of behaviors than lead to complex contagion and the set of reasons to explain why complex contagion might occur.
The paper is organized as follows. First, we present the case and its historical context. Second, we describe the research design: we set out our focus behavior, the set of hypotheses to be tested, the sample selection process, the data gathering process and the construction of variables. The third section presents the results and discussion and the last section, the conclusions.
The case: historical context
In 2017, the independentist majority of the Catalan parliament called a referendum on self-determination in the Spanish region of Catalonia. This referendum was considered illegal by the Supreme Court of Spain, but the Catalan government upheld the call, and the referendum finally took place on the 1st October, despite the police using force to try to stop voters from voting. According to the Catalan government, more than 1000 people were injured during the incident. 1 A mostly symbolic declaration of independence followed the referendum, and as a consequence of this process, several civil leaders of the independentist movement and politicians from the Catalan government were arrested and spend more than a year in prison awaiting trial. Other politicians, among them the then Catalan president Carles Puigdemont and four ministers went into exile. In October 2018, almost all the imprisoned civic leaders and politicians were finally found guilty of sedition (and some of them also of misappropriation) and received prison sentences ranging from 9 to 13 years. For a wide segment of the Catalan population, these prisoners are considered political prisoners, and a social movement against their imprisonment emerged.
In October 2017, two civil organizations in Catalonia (Omnium Cultural and the Catalan National Assembly) responded to the imprisonment of their leaders (Jordi Cuixart and Jordi Sánchez, respectively) by asking Catalans to wear a yellow ribbon in support for the prisoners. The yellow ribbon quickly spread throughout the territory: it suddenly appeared painted in the streets, hung on balconies, tied on trees, fences and traffic signals, as pins on blazers, jackets and backpacks, and more recently, in anti-Covid masks. It also was at the center of several social and political controversies. The yellow ribbon finally became a symbol in support not only of freedom for the Catalan prisoners but also for the safe return of the exiles.
Research design and data gathering
Our focus behavior
Behavior consisting of editing the name of the account to include a political symbol is a way of expressing political opinions in Twitter that has been generally ignored by researchers. In our case, including the yellow ribbon in this space has become highly frequent among Catalan independentists. We consider it our focus behavior. This is an interesting political behavior for several reasons: (a) it is an intentional, costly (relatively, compared with other behaviors such as tweeting or retweeting) and complex behavior that requires knowledge of how to perform the steps required to edit the account name; (b) given the limited space of 50 characters, for an individual to write their name and include a specific symbol signals that the cause must have a special significance as part of the individual's identity, and (c) it is a behavior with a certain level of permanence that affects future behaviors: until the moment when the subject reverses the behavior, posting something means that their name with the yellow ribbon will probably appear in their followers’ timeline. It is therefore a more permanent declaration than supporting the cause in a tweet that will be rapidly buried in the timeline.
Data interest, scope, and limitations
There are basically two reasons for the scientific interest in Twitter. Like any other social network, Twitter can be used for multiple purposes, but as stated by Gayo-Avello (2015:52), it is the default platform for microblogging. In fact, it has been defined as a “conversational microblog” that has become “the center of an entire communication ecosystem” (Barash and Golder, 2010:144). Political blogging is obviously among its main uses. Twitter has certain traits that have made it an arena for political debate, for example, the principle of “following” users without mandatory reciprocity (Ruiz-Soler, 2017:18; Russell, 2013:7), the use of hashtags that allows users to identify, read, and interact with other users (even non-followed users) that are interested in specific topics or are participating in real-time events, etcetera. This wide use of Twitter as a political tool, for communication, exchange, or coordination, is why the network has become an increasingly used source of data for social research on political opinion (for an overview, see for example, Severo and Lamarche-Perrin, 2018). Another reason is that Twitter can be considered a “digital socioscope” (Mejova et al., 2015), a source of easily accessible, massive, and global yet, at the same time, microscopic data on social and political behavior.
Focusing on Twitter allows us to analyze enormously rich sets of data: (i) Twitter data is massive data, in the sense that it has allowed us to access a huge quantity of information of a large sample of the population; (ii) at least in our case, it is behavioral data, and generally speaking, observational data has been traditionally hard to obtain, at least for large samples of people; (iii) it is data that records non-reactive behaviors; (iv) it is relational data, since it also captures structures of relations among the subjects of the sample; and (v) it is dynamic data: it allows us to track the evolution of our sample's behavior over time.
However, it is also necessary to carefully consider the nature of the data. Two questions stand out here. First, technology and platform infrastructures are not neutral, void spaces where social interactions occur, but structured field games in which certain logics of interaction are more probable (Boyd and Crawford, 2012; Kitchin, 2014; Marres, 2017). If we compare Twitter with other social networks like Instagram or TikTok, it is clear that the design and general uses of Twitter make it a platform in which it is more likely to observe a peer-based diffusion of political behaviors. And second, we must take into consideration that this platform not only facilitates peer interaction and influence. Beyond the general design of the platform and its uses, some of its technical traits could also magnify that influence. For example, the Twitter algorithm that constructs users’ timelines could shape their perception of what their peers do, basically by selecting certain types of peers to be shown. Whether this has an effect on peer influence in this case or not is an empirical question, so we designed a test to explore this possibility.
What can be observed is also limited by the available data. Big Data is “ready-made” data (Salganik, 2019), so we could only test what is testable given the set of data that the Twitter API offers, which excludes some data that could be potentially relevant to our research. For example, we can now determine whether an account displays a ribbon in the name, and therefore infer that at some point the user performed the behavior of editing the name, but we cannot determine when the edit occurred, or whether the user edited the name to include the symbol and then re-edited to delete it before we gathered our data.
Research design and hypotheses
There is an important distinction between the complex contagion of a behavior and the diffusion process of a behavior that constitutes complex contagion. Testing whether a behavior constitutes complex contagion involves providing evidence that multiple exposures to an innovation can satisfactorily explain who adopts a behavior, when, and with what macro-level consequences. Given that we know that complex contagion diffuses more efficiently through specific topologies, analyzing the diffusion of a behavior that constitutes complex contagion involves providing evidence of the role that certain network traits, such as transitivity, play in the dynamics and level of diffusion. These two different research goals require very different methodological approaches. In this paper, we focus on providing evidence that complex contagion is the most plausible explanation for an observed statistical pattern (our explanandum). Therefore, we cannot provide insights into the traits of the diffusion itself as it happened, what triggered the diffusion, or the paths that it took owing to the characteristics of the social network. Instead, we focus on testing for observable effects of complex contagion while also testing for other alternative explanations for adoption. The logic of our inquiry follows a mechanisms-based strategy for explaining social phenomena (Elster, 2015; Hedström, 2005; Manzo, 2014). According to this strategy, we must first be able to observe the macro-level statistical pattern that we would observe if our proposed mechanism (complex contagion) had generated the diffusion of our focus behavior. Once this statistical pattern is shown, we then must propose a micro-level causal mechanism responsible for the individual-level process of behavior change, that is, a mechanism that could causally explain why the exposure to multiple sources of activation has an impact on individuals’ behavior. Finally, we must be able to (always provisionally) dismiss alternative micro-level causal mechanisms that could have produced the same result and offer some empirical evidence that our proposed mechanism was probably the main mechanism at work.
Following this research logic, we test two main hypotheses containing six sub-hypotheses:
Hypothesis 1. Our focus behavior spreads through complex contagion. Testing this hypothesis requires offering empirical support for the following sub-hypothesis:
a.1) If a complex contagion mechanism were at work, we would observe a statistical pattern in which displaying the yellow ribbon is statistically associated with the proportion of friends (or some reference subgroup of friends) displaying it (we use the term “friends” to refer to those accounts followed by a user). Hypothesis 1.1 states that this statistical pattern will be shown in our data.
a.2) Simple contagion must be ruled out as an alternative explanation to complex contagion since, at least theoretically, it could also generate the same statistical association between the probability of adoption and the proportion of adoptions among neighbors. Hypothesis 1.2 states that a simulation model of complex contagion would better perform a generative test of our explanandum than a simple contagion model. a.3) Homophily refers to “the tendency for social ties to form disproportionately between individuals who share some socially significant attribute.” (Skvoretz, 2013:486). As stated by McPherson et al. in their seminal work (2001), “similarity breeds connection”. Lazarsfeld and Merton (1954) made a classical distinction between status-homophily (similarity between people through group-affiliation or positions within a group) and value-homophily (the notion that relationships are more common between people with similar values). In Twitter, clusters of behaviors/opinions can result either from people matching their friends’ behavior/opinion (social influence) and/or people creating links with others with similar behaviors/opinions (value-homophily). Hypothesis 1.3 states that the observed correlation is not the product of value-homophily and can therefore only result from social contagion.
Hypothesis 2. A social learning mechanism can explain why our focus behavior is complex contagion. Testing this hypothesis requires offering empirical evidence backing it, but also a previous progressive rejection of alternative explanations. We conceive this rejection as a four-step process:
b.1) First, we must discern which type of social influence process could be taking place. Social influence refers to any situation where the probability of an individual exhibiting a certain behavior is affected by other people. This includes social phenomena as different as compliance (acquiescence to a request), conformity (matching your behavior to that of others) (Cialdini and Goldstein, 2004; Moscovici, 1968) and strategic interaction (considering others’ behavior to choose your best alternative). Considering the expressive nature of our focus behavior, and therefore the inexistence of any kind of externalities, no utility maximizing strategic interaction is at work here, so by definition this possibility is ruled out. If Hypothesis 1 has been positively tested, we must be able to show some empirical evidence to dismiss compliance as a plausible explanation of what we observe. Hypothesis 2.1 states that the observed correlation between users’ behavior and their friends’ behavior is not the product of compliance.
b.2) If we can rule out compliance, then we must identify whether this is more likely a case of social conformity (matching your behavior to the perceived general behavior) or peer conformity (matching your behavior to the behavior of your peers). Since people tend to follow different types of accounts on Twitter (people with whom we share ideas, but also relatives, friends, colleagues, etc.), we assume that our opinion regarding a certain political issue is usually not affected by our whole set of friends, but only by the subset of friends with which we believe to share a similar opinion on that issue (our peers on this matter). Hypothesis 2.2 states that the members of our sample do not conform to the behavior of their whole set of friends but to the behavior of their peers.
b.3) If social conformity is ruled out, then we must determine which could be the specific mechanism behind peer conformity. Deutsch and Gerard (1955) made a distinction between two possible causes: normative and informational influence. In the former, normative pressures to conform can trigger a desire for acceptance or being liked by others and/or a willingness to avoid sanctions for deviating from the group. In the latter, we use others’ behavior as a source of information regarding how to behave, that is, informational influence can be thought as equivalent to social learning. When normative peer influence is at work, we conform because we believe that our peers expect us to conform. When informational peer influence (social learning) is at work, we conform because we believe that our peers’ behavior deserves to be adopted (their behavior shows us what an appropriate, productive, moral or funny behavior looks like). Given the non-face-to-face interactions that take place on Twitter, the frequent anonymity, and the difference between friends (those whom I see) and followers (those who see me), Hypothesis 2.3 states that normative influence do not have a relevant role in the explanation of why our peers’ behavior affects us, so the most plausible mechanism is social learning. Some empirical evidence backing this mechanism should also be observed.
b.4) Most of the time, social learning deals with individuals’ previous opinions, either acting in the same (as in our case) or in opposite directions. We expect our focus behavior to be mainly the product of social learning, but the already mentioned traits of our focus behavior suggest that the level of individual commitment to the cause must also have a relevant role. Hypothesis 2.4 states that peer conformity and individual conviction both contribute to the explanation of our focus behavior.
Sample selection
The main goal of the sample selection process was to obtain a sample of accounts that publicly expressed their support for the political cause at hand, so they could be users or potential users of the symbol. To do so, we conducted a search for tweets and retweets published from the 19th to the 26th of September 2018 (from Wednesday to Wednesday) including the following hashtags: #freetothom (free everybody), #llibertatpresospolítics (freedom political prisoners), #LlibertatPresesPolitiques (freedom political prisoners, in feminine), #FreeJunqueras (referring to the then vice-president of Catalonia, Oriol Junqueras), #LlibertatPresosPoliticsiexiliats (freedom political prisoners and exiles) and #LlibertatJordis (freedom Jordis, referring to activists Jordi Sánchez and Jordi Cuixart).
Hashtags on Twitter usually synthetize and categorize the issue of the post, helping others to find all the issue-related publications and establish conversations. However, our selected hashtags are of a particular type: they are not neutral descriptions of the issue of the post. Instead, they are a way to explicitly support the cause at hand. It is highly unlikely that someone would use any of those hashtags if they do not back the political cause. 2 These hashtags are political declarations. For this reason, we used these posts as the criterion for our sample selection. The search delivered 63,700 tweets and retweets (4684 tweets and 59,016 retweets) published by 22,634 accounts. These accounts were then considered the initial sample of this research.
It was not possible to use a simple random sampling process given the unknown universe of potential users. Following the idea that hashtags can be the focus and source of a virtual community (Yang et al., 2012), we chose instead to capture the whole community of users that publicly backed the cause and interacted around our selected hashtags during the reference week. This sample procedure resembles a “one-step” cluster sampling process, which considers the communities that interact each week as clusters, but with the important difference that our clusters are not mutually exclusive (users can belong to different clusters). Statistical representativeness is not guaranteed with this sample procedure, but it offers quality data that enable us to analyze peer effects on a specific community. Moreover, we did not find reasons to suggest that this community could be significantly different from the community that interacted around the hashtags in any other week.
Data gathering
We used the R package rtweet to communicate with the Twitter API and gather information about this sample and their friends. We retrieved information from three sources: (a) information about the users in our sample, with variables such as length of time in Twitter, the number of posts and favorites, and so on; (b) for each member of our sample, we retrieved the name and user information for a maximum of 5000 of the user's followed accounts. Only 427 (2% of the sample, using data from the first wave) had more than 5000 friends, so we obtained a very precise description of our subjects’ list of friends; and (c) we gathered the last 3200 posts (including tweets, retweets, mentions, etc.) of each member of our sample.
We repeated this data gathering process at three different moments so that a panel analysis could be conducted. Table 1 summarizes the data obtained in the three waves after the cleaning process.
Data obtained in the three waves.

Measurement variables
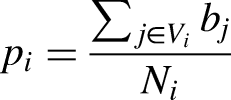
For every account in our sample, its set of links with other members of the sample offers an accurate sample of peers. 3 Thus, with these data we can build a social graph G(V,E), a directed network such that V is the set of accounts that comprise our sample and E is the set of directed edges (representing who follows whom) between those accounts.
For every account i ∈ V, there is a set of relevant attributes, among which the most relevant are:
Our focus behavior. A binary action (bi) consisting of showing (bi = 1) or not showing (bi = 0) a yellow ribbon in the name of the account. A level of commitment to the cause (ci), which is measured as the proportion of i's posts that refer to the political cause at hand. The process to measure ci was twofold. For each of our three waves, we consider the 300 most used hashtags that were related to the cause among a randomly chose set of 2 million posts selected from the last 3200 posts published by every subject of our sample. We obtained a total of 519 hashtags after deleting repetitions and also included some expressions such as “presos pol-” and “exile-.” We then compute, for every account, the proportion of posts that included our selected hashtags and expressions. In the first wave, we only considered the publications made since 16th October 2017, the date when the first activists were imprisoned. In the second and third wave we only considered the publications made in the period between one data gathering process and the next one.
4
The proportion of peers that display a ribbon in their name (pi). To compute this, we first define Gi(Vi,Ei) as a sub-graph of G where Vi includes i and all the nodes in his one-step neighborhood, so that Vi = {i, j1, j2 … jn}. That is, Gi is i's one-step ego-network of peers. The proportion of peers that display a ribbon in their name is calculated as follows: where Ni is the size of Vi minus 1. An Exposure Index to the yellow ribbon (EIi). Twitter users can switch between the “Home view” and the “Latest Tweets” view on their timelines. The second option shows a list of posts from followed topics and users in reverse-chronological order. Only those using the “Home view” are affected by Twitter's timeline construction algorithm. However, it should be noted that its unobserved operation could be affecting our assessment of the peer effect. The EIi was designed to empirically test this possibility. An “algorithm-free” users’ timeline is first reconstructed as the sum of the mean number of posts per day published by each one of their followed accounts. The EI
i
is then calculated as the proportion of posts showing the yellow ribbon in the “algorithm-free” reconstructed timeline. A difference in the effects of pi and EIi in bi could indicate an influence of Twitter's algorithm. The mean commitment to the cause of i's peers (fci). The proportion of friends that display a ribbon in their name (pf
i
).

Results and discussion
Complex contagion
Establishing the explanandum
If a complex contagion were taking place, we would expect to observe some statistical relation between an account's proportion of peers with a ribbon and its probability of also displaying the ribbon. To test this, we rounded pi to two decimals and calculated the proportion of accounts with bi = 1 among all the accounts that share the same pi. We interpret that proportion as the probability of displaying a yellow ribbon. Results are shown in Figure 1A. 5

Panel (A) shows the proportion of users displaying the yellow ribbon in their account name (
As can be seen in Figure 1A, there is a clear, linear relation that is close to the 45° line between an account's proportion of peers with a ribbon and its probability of also displaying the ribbon. For example, among those with a proportion of 0.1 peers with a ribbon, the observed probability of also displaying the ribbon is 0.1. This is a remarkable result. The apparent change in the pattern in cases with more than 50% of peers with a ribbon is negligible since, as we can see in the nested histogram, those values refer only to 97 cases (0.4% of the sample).
Figure 1B shows basically the same pattern, although the correlation of EIi with
Given that the users selected for our sample for retweeting a post are probably connected to the authors of the original tweet, our sample selection process captures a community of users that are embedded in a previous underlying structure of contacts. Therefore, we must consider the possibility that peer effects could be somewhat overstated. To test whether this is the case, we used the set of accounts selected for posting a tweet as a control group: the group was selected consistently over potential users of the ribbon, with no more (or less) contacts than any other random selection of potential users of the symbol. In Figure 2, we compare the relationship between pi and

This figure shows the proportion of users displaying the ribbon (
Simple or complex contagion?
Could the statistical pattern shown in Figure 1A be the result of a simple contagion process? To rule out this possibility, we built an agent-based simulation model (see the R code in the Appendix) and simulated the diffusion under three different scenarios. Our goal was to test whether simple contagion could have generated a pattern such as the empirical pattern shown in Figure 1A given the empirical traits of the observed phenomenon (therefore, it is not a theoretical but an empirically calibrated model). In a simulated mirror image of the observed directed network, the diffusion always starts with a seed of s infected agents. The parameter s is set at 20, 40, 60, or 80. The model is a repeated game played over discrete rounds. In each round, agents decide whether to adopt the behavior or not depending on the behavior of their neighbors, with a function that varies depending on the version of the simulation (see the three models below). Since there is no force stopping the contagion process, we decided to replicate the stopping point of the diffusion process and, therefore, the simulation ends when the proportion of “infected” simulated agents reaches or surpasses the observed proportion of “infected” agents (
These models suggest that the complex contagion hypothesis seems more plausible. The first reason is to be found in their generative sufficiency. The results shown in Figure 3 suggest that a simple contagion process (either in the Model 1 or Model 2 version) could not generate the statistical pattern shown in Figure 1, while the complex contagion simulated in Model 3 could.
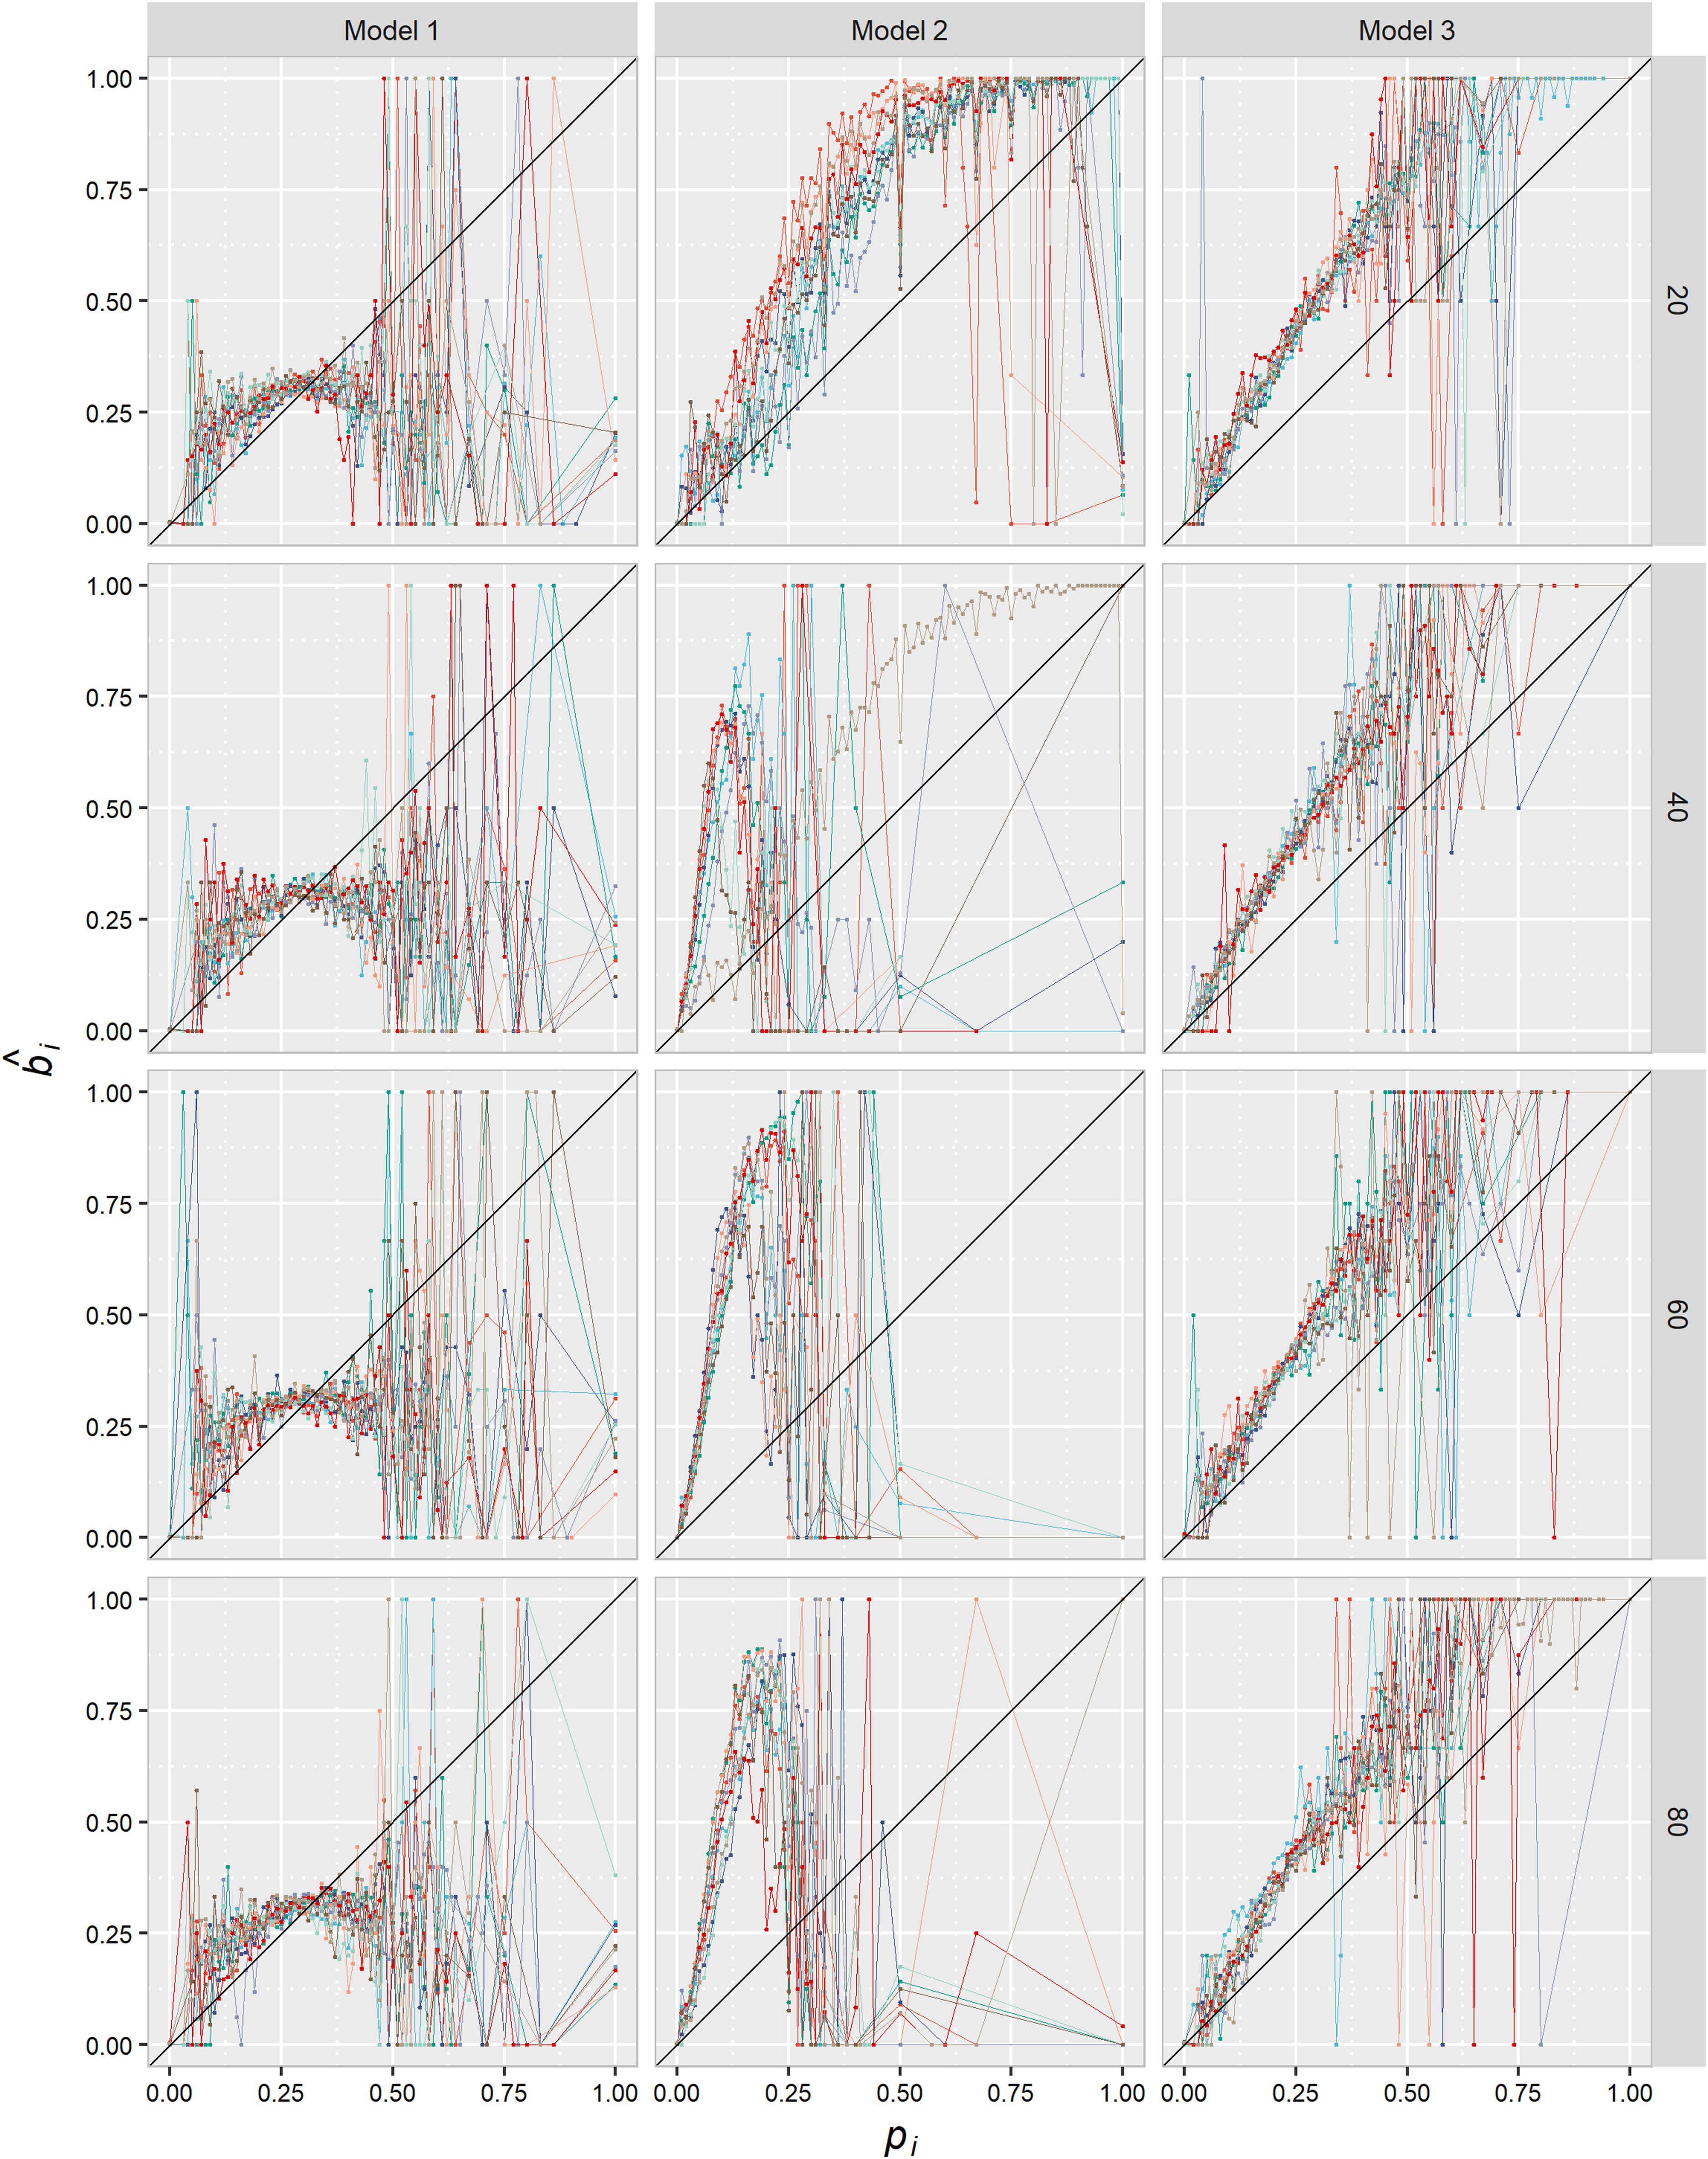
Proportion of accounts displaying a yellow ribbon depending on the proportion of peers displaying the ribbon. Comparison between three agent-based, empirically calibrated simulation models. Each plot shows the result of 10 different simulations. Lines show the proportion of agents that adopted the behavior for each group of users that share the same proportion of neighbors that have already adopted. Values of pi have been rounded to two decimals and the variable has been treated as an ordinary variable. The black line is a 45° reference line.
The second reason refers to some unrealistic traits of Model 2. As we will see in the panel data, neither escalation to full diffusion nor “recovery” among adopters was observed in the natural phenomenon. The diffusion reached 28% of the population in the first year and then stabilized in that proportion over the subsequent 2 years. Throughout those 2 years, there were almost no individual-level changes in the behavior (see Figure 6). That is why we had to add an exogenous stopping force to the simulation. The question here is whether we can think of some empirical trait of the phenomenon that could have acted as an equivalent of this force. In simple contagion models such as Model 2, each single exposition to a carrier would be adding to the agent's overall probability of adoption because there is a transmission probability in each interaction between a carrier and a susceptible agent. It is hard to imagine a reason why this transmission probability could cease to exist. The exogenous stopping force is a quite unrealistic trait of this model. However, complex contagion based on a social learning mechanism, which we will state as the more plausible explanans of our explanandum, includes the time dimension: people observe novel behaviors and their social acceptance and diffusion during a certain amount of time, but once they learn of the existence and acceptance of that behavior, they either adopt it or not, and eventually cease to check others’ behavior. We then consider that there is an empirical correlate to this exogenous stopping force only in Model 3.
Moreover, the empirical existence of a one-to-one transmission probability, as the one formalized in Model 2, can be objected. While each single exposition to a carrier increases the probability of infection in the case, for example, of a virus, it is hard to imagine which mechanism could explain how each single exposure to a yellow ribbon could have its own probability of transmission. Again, this is a very unrealistic trait of Model 2.
In sum, Model 3 is more empirically grounded and better performs the generative sufficiency test, so the hypothesis that users are affected by an observed proportion of peers adopting the behavior seems more plausible.
Ruling out homophily
Social influence and homophily could generate the same statistical pattern. Therefore, instead of people affecting each other, we might just be observing the result of people clustering depending on their level of commitment to the cause: more convinced people would be more likely to display a yellow ribbon and follow others that are as convinced as they are, and therefore as likely as they are to display the ribbon. To empirically discard homophily as one of the main mechanisms at work here, therefore accepting Hypothesis 1.3, testable implications of the homophily hypothesis must be obtained and empirically rejected.
We can test whether there is a correlation between an account's level of commitment to the cause (ci) and the mean level of commitment of its peers (fc i ). A correlation would imply a possible homophily-driven process of clusterization. To test this hypothesis, we used a new version of the variable level of commitment to the cause (ci) that excludes retweets and only consider tweets, since retweeting is obviously an activity that is dependent on what your peers post. This new variable is not correlated with fc i , r(19434) = -0.02, p = .005625. If we also consider only tweets for computing fc i , we find a very small and (contrary to expected) negative correlation, r(20316) = -0.13, p < 2.2e-16. Taken together, these two results allow us to rule out that people in our sample tend to follow those with whom they share a similar level of commitment to this cause.
Another theoretical possibility that must be empirically tested is whether some ribbon-displaying accounts could have been actively choosing to follow other accounts with ribbons because they display it. If that were the case, homophily could not be ruled out. We have tested this hypothesis in two different ways. First, we used data from the first wave to compare pi among those displaying and not displaying a ribbon. If a homophily-driven process for establishing new relations using the ribbon as a sign had taken place in the previous months before our first data gathering, we would find a significant difference in these proportions. However, we found that pi among accounts with a ribbon was 0.36, whereas the proportion among accounts without a ribbon was 0.33. A Welch two-sample t-test showed that the difference was statistically significant, but the effect size was small, t(13411) = -25.11, p < 2.2e-16, d = -0.35. A difference of 0.03 in the proportion of peers with a ribbon is a very small difference that cannot explain the statistical pattern we observe in Figure 1A.
A second way to test this hypothesis is to use panel data to compare the increase in pi between the first and the second wave among those displaying and not displaying the ribbon in the first wave. The mean increase in pi was −0.012 for those without a ribbon and −0.014 for those with ribbon. That is, the decrease is higher for those with a ribbon. Moreover, a Welch two-sample t-test showed that the difference was statistically significant, but the effect size (which, in addition, was acting in the opposite direction as expected if homophily had been present) was negligible, t(11993) = 3.1841, p = .001456, d = 0.05. In sum, we did not find evidence to support the hypothesis of a homophily-driven process of creating new links in the months before the first and second wave of data gathering. Taken together, all these tests allow us to rule out homophily as an alternative explanation of our explanandum, therefore supporting Hypothesis 1.3.
In sum, since we observe a statistical pattern compatible with complex contagion (Hypothesis 1.1) and the alternative explanations have been ruled out (Hypotheses 1.2 and 1.3), we consider Hypothesis 1 a well-supported hypothesis: complex contagion seems the most plausible explanation for the spread of this particular use of the yellow ribbon.
Social learning
A satisfactory explanation of our focus behavior requires answering why pi is a signal that affects individual behaviors. According to our Hypothesis 2, social learning from peers seems to be the most plausible micro-level mechanism explaining why exposure to multiple sources of activation can affect the individual decision to display this symbol. Observing peers who exhibit this behavior can be viewed simply as a suggestion of an original (or funny, or interesting, etc.) way to display your support for the common cause. How often you see that behavior signals how funny, interesting, etcetera, others think it is, and hence contributes to seeing the symbol and this particular behavior as being more familiar and socially liked.
Compliance or conformity?
In October and November 2017, the Catalan National Assembly (CNA) made several explicit calls to use the yellow ribbon as a way to publicly support the cause (some of them via their Twitter account), so the use of this icon could be interpreted as acquiescence to the CNA's requests. If this were the case, we would be facing a top-down compliance phenomenon and not a horizontal peer-to-peer conformity process. Top-down compliance and peer-to-peer influence are two analytically differentiable mechanisms whose presence can be empirically tested. While different people can be subject to either one or the other, we tried to analyze which one of them is responsible for the statistical patterns that we observed.
A top-down compliance process where an organization sends a request, and some people acquiesce could only explain the correlation between pi and

This figure shows no peer influence on other uses of the yellow ribbon. Panel (A) shows the proportion of users displaying a yellow ribbon in their Twitter account description for each group of users that share the same proportion of peers showing that behavior. Panel (B) shows the proportion of users displaying a yellow ribbon in their Twitter account description for each group of users that share the same proportion of peers with a ribbon in their account name (pi). Values of the independent variables (in the x-axis) have been rounded to two decimals. These variables have been treated as ordinary variables. The black line is a 45° reference line.
Social or peer conformity?
To test whether we are observing social or peer conformity, we can compare the average marginal effect (AME) of the percentage of peers, the percentage of non-peers and the percentage of friends (peers and non-peers) with ribbon on our focus behavior. As we can see in Table 2, peers have a higher effect than non-peers and the whole lists of friends. While a 1% increase in the percentage of peers with a ribbon increases the probability of displaying a ribbon 0.89%, for non-peers the increase is 0.66%, and for friends it is 0.64%. This means that, regarding our focus behavior, the subjects of our sample perceive, and are especially sensitive to, the behavior of a subset of their friends with whom they believe to share their support for the political cause. Our list of i's peers is obviously just a proxy of the real list of friends who i considers to be peers, so those whose are left out could partially explain why non-peers’ behavior also has an effect on the individual. Overall, the difference in AMEs is strong evidence that individuals are not equally affected by the behavior of all their friends. We therefore consider this evidence as confirming Hypothesis 2.2.
Average marginal effects of peers, non-peers and friends on bi (first wave data).

****p ≤ .0001, ***p ≤ .001, **p ≤ .01, *p ≤ .05.
Table 3 presents another piece of evidence supporting the idea that individuals are sensitive to what their peers do. The signal that seems to be affecting individuals’ behavior is the proportion of peers showing a yellow ribbon, regardless of the size of the group of peers among the whole list of friends. The regression coefficient of the proportion of peers in the lists of the subject's friends is non-significant in Model 1. An interaction effect between the size of the group of peers and the proportion of peers who display a yellow ribbon has been included in Model 2, but as we can see, despite being statistically significant, the size of the effect is negligible.
Logistic regression models and average marginal effects of the proportion of peers with a ribbon and the proportion of peers among the list of friends.

p ≤ .00001, ****p ≤ .0001, ***p ≤ .001, **p ≤ .01, *p ≤ .05.
In sum, the main signal shaping bi is not the proportion of friends displaying a yellow ribbon, but the proportion of their peers with a ribbon, with almost no effect of the relative size of that subset of friends. We therefore confirm Hypothesis 2.2.
Normative pressure or social learning?
To test the following hypotheses, we present a logistic regression model including pi, ci and fc i as independent variables (see Table 4). Since the initial exploratory analysis suggested that the variables fc i and ci are not linear on the logit, we applied a Box–Tidwell transformation (Box and Tidwell, 1962) to each of them. The coefficient for both transformed variables in their respective logistic models (not shown here) was statistically significant (p < 2e-16 for fc i and p = 2.54e-16 for ci), so a curvilinear effect for each variable was included in the logistic model.
Logistic regression and average marginal effects.

†p ≤ .00001, ****p ≤ .0001, ***p ≤ .001, **p ≤ .01, *p ≤ .05.
The logistic regression model renders highly statistically significant coefficients for all the predictors and their curvilinear effect (when present). However, given that we include polynomial specifications in our logistic regression model (and therefore some variables have two different coefficients), we shall focus our analysis on the marginal effects (Leeper, 2017; Mize, 2019).
Average mean effects confirm that pi is the variable with the highest impact on the probability of displaying a yellow ribbon. As we can see, controlling for the rest of variables, the mean value of the first derivative of the probability of displaying a ribbon in relation to the percentage of peers also displaying it, is 0.008. That is, the average effect of a 1% increase in the percentage of peers displaying a ribbon is an increase of 0.8% in the probability that the subject will also display a ribbon.
The coefficients and AMEs of pi and fc i can be interpreted as supporting Hypothesis 2.3. Peers’ commitment to the cause should have a high impact on our focus behavior if normative pressure is the operating mechanism here. 6 The impact of pi should be significantly reduced when controlling for fc i and we should observe a monotonic positive relation between fc i and bi. None of these is the case. First, even when we control for fc i , pi is associated with bi. Second, the marginal effect of pi is higher than the effect of fc i . This can be interpreted as evidence in support of the functioning of a social learning mechanism. The probability of the members of our sample displaying a yellow ribbon seems to be affected by seeing their peers also exhibiting that particular behavior more than by seeing their peers frequently posting tweets or retweets in support of the cause that the ribbon represents. Our focus behavior seems to be the result of learning from others how to express something more than the result of using this behavior to signal to your peers a similar commitment to the one they express in their publications. And third, the relation between the probability of an account displaying the yellow ribbon and fc i is clearly an inverted U-shaped relation (see Figure 5). A reduction in the impact of your peers’ commitment on the probability of using the symbol is exactly the opposite of what we would expect to find if normative pressure were acting here.

This figure shows the predicted and marginal effects of the proportion of peers who display the ribbon (pi), the level of commitment to the cause (ci) and the mean commitment to the cause of their peers (fci) on our focus behavior (bi). Blue lines refer to first wave data, green lines to second wave data and red lines to third wave data. Intervals are defined by ymin and ymax.
A second piece of evidence in favor of Hypothesis 2.3 can be found by analyzing our panel data. If social learning means acquiring a new behavior after observing it in others, as the behavior spreads through the network, we would basically observe only one behavior change: from not displaying to displaying the ribbon. That is, we would observe a pattern consisting of receiving a signal, changing behavior, and then ignoring the signal (at least while one does not observe a significant proportion of people withdrawing the symbol). As we can see in Table 5 and Figure 5, there is an obvious tendency to keep in w3 the decision made in the w1-to-w2 transition. In fact, we can say that the value of bi in w1 and w2 jointly determines the probabilities of transition between w2 and w3, or in other words, that this is a second-order Markov process, since the sum of the two partial Chi-squares of Table 5 yielded a significant result, X2(2, N = 18,904, p = 1.7e-19). The stability of decisions is the main trait of this process. We suggest that this could be considered evidence of an initial act of learning that generates a subsequently maintained behavior.
Transition probabilities (w1, w2 and w3).
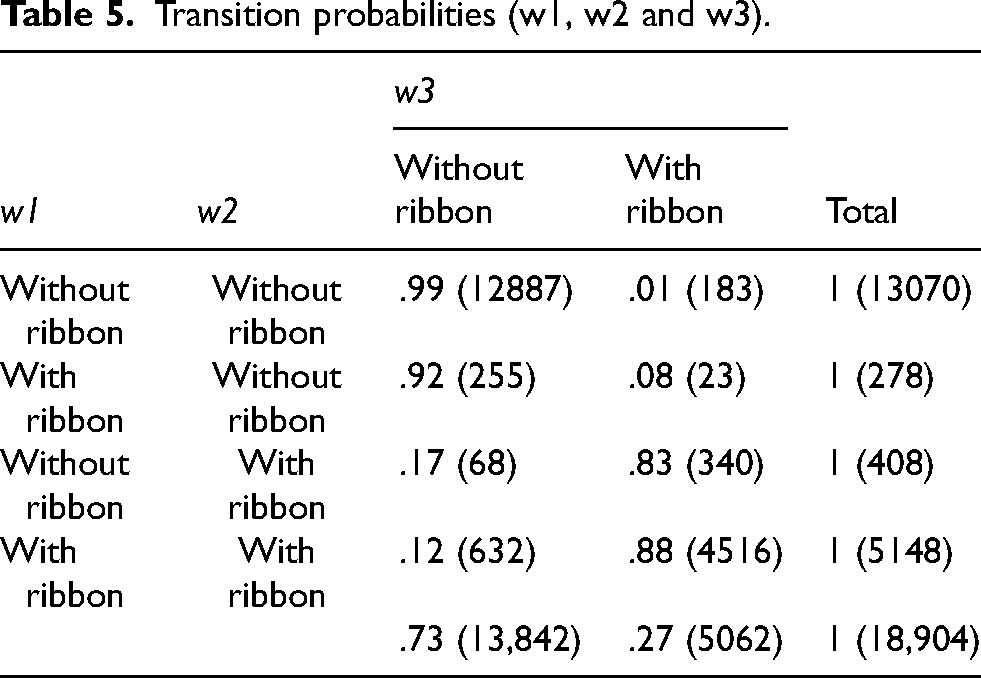
To further test this idea, we analyzed the transition probabilities from w1 to w2 for different strata of the sample, depending on their pi at w2 7 (see Table 6). Interestingly, the Chi-squared test for those with bi = 0 in w1 resulted in a statistically significant result, X2(4, N = 12,976, p < 2.2e-16) and the test for those with bi = 1 in w1 resulted in a non-significant result, X2(4, N = 5379, p = .6729). That is, on the one hand, pi in w2 had no effect on the transition probabilities between w1 and w2 for those who already decided to display a yellow ribbon in w1, suggesting again that peers send an initial and influential signal and then the agent ceases to consider peers’ behavior to reassess their own. On the other hand, those who were still immune to the initial signal had extra time to be affected by it, as shown by the fact that that the transition from bi = 0 to bi = 1 varies with the behavior of an agents’ peers (although differences between strata are low).
Transition rates from w1 to w2 for the focus behavior by proportion of peers displaying the yellow ribbon in w2.

The role of personal commitment to the cause
For reasons presented above, our focus behavior could be considered as the product of a high level of adhesion to the cause that the symbol represents, so it was plausible to expect ci as having an impact on bi, as we did in Hypothesis 2.4. Our data, however, does not confirm this hypothesis. There is a slightly convex and statistically significant relation between ci and bi, with ci having a very slow AME on bi (see Table 4 and Figure 6). In fact, these data can be interpreted as evidence of the success of the proposal of this symbol, since we can see the same predisposition to wear it across the entire spectrum of different levels of support for the cause. Moreover, this leaves social learning from peers as the stronger explanation of why some decide to display a ribbon in the account's name.

This alluvial plot shows the flow of our focus behavior (bi) across the three waves of the panel. The blue stratum refers to accounts displaying a yellow ribbon and the orange stratum refers to accounts that do not display a yellow ribbon. Flows indicate transitions in bi from one moment of time to another.
Conclusions
In this article, we have shown that the use of political symbols can spread through complex contagion. We have focused on a specific use of a particular symbol: the behavior consisting of editing the 50 characters (max) of a Twitter account name to include a yellow ribbon signaling support for the release of Catalan politicians and civil leaders in prison and the safe return of exiles.
Our results show that the level of exposure to the behavior is related to the probability of adopting the behavior. More specifically, we have shown that: (a) there is a clear statistical pattern in which the probability of displaying a ribbon is associated with the proportion of peers who are also displaying it; (b) our data and models suggest that the alternative hypotheses of simple contagion or a previous homophily clusterization process can be ruled out, therefore suggesting that the behavior spread through complex contagion; (c) this social influence process could not be explained by a top-down compliance mechanism, but as the result of peer conformity, in other words, adapting one's behavior to that of one's peers (those with whom one shares the same political cause); and (d) the data suggest that the most plausible micro-level generative mechanism leading to the complex contagion process is a peer learning process. The proportion of peers exhibiting the behavior would be acting as a signal that suggests a particular way of expressing shared support for the political cause. Individuals would be “reading” the proportion of their peers who display a yellow ribbon merely as an informational (not normative) signal (“you can support the cause like this,” “this is a nice way of signaling your support for the cause”).
There are two main theoretical contributions from this paper. First, our study shows that Twitter data, despite its limitations, can be usefully employed to test alternative explanations of social behavior. And more specifically, we have tried to show how Big Data, and especially Twitter data, can help us to construct mechanism-based, intentional explanations (Elster, 2015; Hedström, 2005; Manzo, 2014) when no direct data on the mental states of agents is available.
And second, our findings also contribute to the development of the theory of complex contagions. Researchers using Twitter data have primarily focused on the diffusion of hashtags. While some analyses have shown that multiple exposure explain hashtag adoption (Fink et al., 2016a; Romero et al., 2011; Mønsted et al., 2017), others found that some hashtags spread through complex contagion while others spread through simple contagion (Fink et al., 2016b). However, it does seem clear that political hashtags tend to behave like complex contagions (Barash and Kelly, 2012; Fink et al., 2016a; Romero et al., 2011). Focusing on a different type of behavior helped us to widen the set of conditions under which complex contagions might occur. We show how complex contagion can occur even when no resistance to adoption is present. In our case study, what was diffused was a suggestion on how to do something (how to signal support for a cause) among agents that are already committed to that something, therefore suggesting that social learning could be added to the list of reasons that could explain adoption in complex contagion processes. Stating that complex contagion can take place under a wider set of conditions reinforces the idea of its important role in the diffusion of political behaviors.
Supplemental Material
sj-docx-1-bds-10.1177_20539517231180569 - Supplemental material for Social learning and the complex contagion of political symbols in Twitter: The case of the yellow ribbon in Catalonia
Supplemental material, sj-docx-1-bds-10.1177_20539517231180569 for Social learning and the complex contagion of political symbols in Twitter: The case of the yellow ribbon in Catalonia by Francisco J León-Medina in Big Data & Society
Footnotes
Acknowledgements
This work has benefited from a project grant awarded by the Spanish Ministry of Science and Innovation [ref.: PID2019 107589GB-I00]. The author would like to thank the editors and three anonymous reviewers for their constructive comments. The author is also indebted to professor Francisco J. Miguel-Quesada for his helpful comments on the manuscript.
Declaration of conflicting interests
The author declared no potential conflicts of interest with respect to the research, authorship, and/or publication of this article.
Funding
The author disclosed receipt of the following financial support for the research, authorship, and/or publication of this article: This work was supported by the Ministerio de Ciencia e Innovación, (grant number PID2019 107589GB-I00).
Supplemental material
Supplemental material for this article is available online.
Notes
References
Supplementary Material
Please find the following supplemental material available below.
For Open Access articles published under a Creative Commons License, all supplemental material carries the same license as the article it is associated with.
For non-Open Access articles published, all supplemental material carries a non-exclusive license, and permission requests for re-use of supplemental material or any part of supplemental material shall be sent directly to the copyright owner as specified in the copyright notice associated with the article.