
Abstract
This paper asks whether geographically localised, or ‘hyperlocal’, uses of Twitter succeed in creating peer-to-peer neighbourhood networks or simply act as broadcast media at a reduced scale. Literature drawn from the smart cities discourse and from a UK research project into hyperlocal media, respectively, take on these two opposing interpretations. Evidence gathered in the case study presented here is consistent with the latter, and on this basis we criticise the notion that hyperlocal social media can be seen as a community in itself. We demonstrate this by creating a network map of Twitter followers of a popular hyperlocal blog in Brockley, southeast London. We describe various attributes of this network including its average degree and clustering coefficient to suggest that a small and highly connected cluster of visible local entities such as businesses form a clique at the centre of this network, with individual residents following these but not one another. We then plot the locations of these entities and demonstrate that sub-communities in the network are formed due to close geographical proximity between smaller sets of businesses. These observations are illustrated with qualitative evidence from interviews with users who suggest instead that rather than being connected to one another they benefit from what has been described as ‘neighbourhood storytelling’. Despite the limitations of working with Twitter data, we propose that this multi-modal approach offers a valuable way to investigate the experience of using social media as a communication tool in urban neighbourhoods.
Introduction of research
Defining hyperlocal media
‘Hyperlocal media’ has been defined in the UK as ‘online news or content services pertaining to a town, village, single postcode or other small, geographically defined community’. Its arrival has prompted hopes in scholarly observation of a revival of civic life in cities (Metzgar et al., 2011), suggesting belief in a causal link between new networked communication technologies and socio-political organisation. A UK-wide survey this year identified 500 of these sites actively operating in the UK. Unsurprisingly, social media plays a crucial role; 91% of the 200 questioned in the survey use Twitter to communicate with their audiences, citing ‘active participation in local communities’ and ‘enabling interaction between people at a local level’ as two of the main reasons given for doing so (Williams et al., 2014). This paper asks whether the hyperlocal use of social media can indeed be thought of in these ways and in doing so discusses its relevance as a platform for neighbourhood civic life.
Case study
This paper is based on evidence available at the midpoint of a three-year study focusing on Brockley Central (http://brockleycentral.blogspot.co.uk/), a hyperlocal blog for the neighbourhood of Brockley in southeast London. This evidence however is not framed here as representative of the workings of all hyperlocal media sites. As Barnett and Townend (2014) have found, hyperlocal media are heterogeneous forms utilising a range of communication technologies including blogging sites, Facebook, Twitter and forums; they are individual rather than corporate or institutional undertakings; and finally they address a range of spatial scales from individual streets to whole cities. Empirical comparison therefore is extremely difficult and possibly irrelevant at this stage. The aim instead is a heuristic exploration of techniques for understanding individual hyperlocal networks and a basis for critical discussion of their implications for urban neighbourhood life. Nonetheless, we would argue, Brockley Central presents a valuable case for study and a good basis for open rather than conclusive discussion on the way social media intersects with urban locality. It is one of the longest-running hyperlocal blogs, operating since 2007, and has been held up as a key case study in both research on the subject (Flouch and Harris, 2010) and in the press (Hill, 2010). More importantly, as will be described below, it has been phenomenally popular in its neighbourhood. The part of the study presented here employs a multi-disciplinary methodology – including the analysis of network and geographical relationships between Brockley Central's Twitter followers along with interviews with its users – to build a more in-depth picture than has previously been attempted of the characteristics of Brockley Central's social media ‘community’.
Context
Brockley is a largely residential neighbourhood in inner London, around 8 km southeast of the urban core at Charing Cross. A clear centre is at Brockley train station where a cluster of businesses is gathered at the northern end of a high street, Brockley Road, which runs south for around 1.5 km through the neighbouring sub-centre of Crofton Park. However, its delineation as an area, like most London neighbourhoods, is contested. For example, Brockley's postcode area SE4 (refer to London's gang ‘postcode wars’ for an understanding of their importance) marks out a different territory to the electoral ward named Brockley.
The blog describes itself as the ‘online home for all things Brockley (SE4), St John's, Ladywell, Nunhead and Telegraph Hill’ (Figure 1), meaning its self-defined spatial reach actually extends further. The map in Figure 2 shows a sharply delineated spatial territory given by the outlines of all electoral wards and the postcode area mentioned as place names in its description. A less rigid definition is given by asking its users (see ‘Qualitative interviewing’ section for a description of the interviews undertaken) to trace their perceived outline of Brockley Central's neighbourhood on a map. Figure 2(a) shows these 20 outlines overlaid on top of one another, hinting at the perceived intensity of Brockley's ‘placeness’.
Homepage of Brockley Central stating its ‘territory’. Contains Royal Mail data © Royal Mail copyright and database right 2012. Brockley Central's territory according to administrative boundaries, with Brockley High Street. Contains Ordnance Survey data © Crown copyright and database right 2012. Brockley Central's territory according to interviewees, with locations mentioned in blog posts from May 2013 to May 2014. Contains Ordnance Survey data © Crown copyright and database right 2012. Contains Royal Mail data © Royal Mail copyright and database right 2012.


Brockley Central posts news stories about events and issues that almost always pertain to specific locations – development projects, new businesses, and so on. Figure 2(a) also shows the locations mentioned in 12 months of new stories from June 2013 to June 2014 (plotted manually). These are not always located within the territory defined by administrative boundaries but relate more closely to a definition of place emerging from its readers’ experiences, suggesting the possibility of a wider area of influence than that suggested by locating the blog according to electoral and postcode boundaries. If the ‘centre’ of Brockley in this definition is the area showing as ‘hottest’ on the map then it is also focused around the train station, with the greatest concentration of news stories, and is bound somewhat by physical barriers such as the train line to the west and the river to the east. 1
At the time of writing, Brockley Central's Twitter profile (for clarity this will be referred to subsequently as @BrockleyCentral to distinguish it from Brockley Central the blog) had 7240 followers, over 1000 more than the 5952 it had when the research was conducted. Its Twitter network is changing constantly as it grows its audience, meaning this analysis represents a snapshot in time. Whilst it may not be entirely true, as one Twitter follower remarked, that ‘there's no-one in Brockley who doesn't follow’ it (Figure 3), this represents a very significant figure in relation to the population of 17,000 potential audience members in its stated catchment area (calculated by aggregating population data for Lower Super Output Areas intersecting with Brockley Central's territory. Source: Office for National Statistics) though of course not all these followers are necessarily resident within this area. Tweets from @BrockleyCentral consist of several main forms of communication: links to blog posts; replies and comments from @BrockleyCentral to other Twitter users in discussion of Brockley-related news; and retweets of posts from others including news items, promotion of events, requests for help and pictures of Brockley. These latter are either tagged with @BrockleyCentral by other users as a conscious means of requesting a retweet so as to access @BrockleyCentral's many local followers with news or requests for information, or they are tagged with the hashtag #Brockley and found by @BrockleyCentral as part of its general communication of locally relevant material. So ideally we might imagine that @BrockleyCentral will act as a social hub via which local residents can make contact with one another and initiate mutual Twitter following relationships, allowing them to establish supportive social ties, with access to one another's social and informational resources. In this scenario it is easy to imagine that this localised use of social media transforms those who simply ‘happen’ to live proximally into members of a place-based community through the act of communication.
Brockley Central Twitter profile with tweet from user.
Brockley Central's followers can accurately be described as a network – a notion that has become highly ideological. Whilst it has rightly been stated that networks are ‘the new social operating system’ (Rainie and Wellman, 2012) and are ‘shaping the modern metropolis’ (Neal, 2013), it has become all too easy to conflate terms and make logical jumps, as explained later in this section, from the existence of a social media network to the existence of a community. It is this jump that we aim to unpack here, by exploring the structure and spatialisation of @BrockleyCentral's egonetwork more closely and relating it to ideological notions of the nature of hyperlocal networks.
Ideologies of hyperlocal media
There is a huge diversity of literature that could be drawn upon to explain hyperlocal networks. It is an issue of geography, of media, of technology and of the formation of communities. In this section, we draw from just a small range within this possible spectrum to outline two contrasting conceptualisations.
Smart and connected citizens
The first of the two conceptualisations is that the existence of neighbourhood communication networks means people are ‘connected’ and that connection is valuable in and of itself. Even before the advent of social media, Castells predicted that communities would counter the de-localising ‘space of flows’ by creating place-based networks of information sharing and decision-making (Castells, 1989: 353). This notion emerges in contemporary urban discourse under the rubric (both critical and favourable) of ‘smart cities’, which is of particular relevance as it is on the basis of this set of ideas, products and practices that most city administrations are forming their strategies for incorporating communication technologies into urban governance. Dan Hill has argued for the term ‘smart citizens – that is, citizens using social media and related technologies to organise and act’ (Hill, 2013). He deduces that by enabling direct one-to-one negotiation, social media can create civic-minded ‘engaged citizens’ taking hold of decisions that affect them collectively. Given their supposed ability to support these attitude changes and networks of self-organisation, Hill argues that ‘we need to bind the energy and dynamics of social media – those active citizens – to active government’ (Hill, 2013).
Adam Greenfield argues that technology is ‘something that ought to amplify the abilities of citizens and their communities to determine the conditions of their own existence’ (Greenfield, 2013: 88). Similarly in the Future Cities Catapult report on behalf of the UK Government Office for Science it is suggested that ‘citizens, organised online, bypass official channels to bring about a change in their city’ (Moir et al., 2014). The clear suggestion is that access to information through networked communications both can and will allow residents of cities to have a direct effect over the creation of the built environment.
Notably these interpretations are not based on observational studies of hyperlocal media but, like Castells before them, employ a futurological and somewhat ideological stance to assert what can and should happen when urban citizens have access to networked communication technologies. It is here that lays the logical jump: networked technologies equal networked citizens.
Citizen journalists
A contrasting approach emerges from less ideologically driven observational approach from within media studies. The first comprehensive survey of hyperlocal media producers in the UK frames hyperlocal media as a response to the decline of local newspapers, filling an informational gap left by the closure of 242 local publications in the UK between 2007 and 2011 (Williams et al., 2014) – coinciding with unprecedented access to free online publishing formats. It is defined in related research as a ‘cottage industry’ approach to news distribution, ‘offering mass communication without mass production’ (Radcliffe, 2012: 42) as opposed to the network of civic self-organisation proposed by Hill and Greenfield, echoing Castells.
Where Hill defines individuals engaging with communication networks as ‘smart citizens’, Williams et al. (2014: 13) settle for the more prosaic term ‘community journalists’ of which 30% were found to be generating over £500 per month from their activities (Williams et al., 2014: 30). Indeed they propose that the term ‘hyperlocal’ may even be misleading as a way to categorise the geographical reach of these media and instead see it as a metonym ‘describing an emergent generation of a primarily digital community of local news producers’ (Williams et al., 2014: 13) who define the main use of their site as distribution of ‘local news of both civic and cultural value, including news about local community groups and events, and local government issues’ (Williams et al., 2014: 4). Social media was found to be an almost universal feature of the activities of these news producers but was commonly used by respondents to the survey as a means of distributing online content rather than as a communication space in which readers were equal participants.
Research questions
So we have two contrasting definitions of geographically localised social media networks. A network of active citizens cooperating as a community to produce and govern their built environment; or a news distribution tool adapted from traditional media models broadcasting information of specific geographical relevance to a localised consumer market. The central questions of this research, then, are: RQ1. Which of these given definitions is a more accurate description of Brockley Central's social media network? RQ2. How could this definition be expanded upon based on the observations carried out on its social network? RQ3. How successful are data drawn from Brockley's social network in describing the lived experience of community in Brockley?
Methodology
Approach
In this study, we are defining the hyperlocal Twitter network as all those profiles following @BrockleyCentral (@BC), the Twitter handle of the hyperlocal blog Brockley Central (BC) and the following relationships between those followers. To characterise this network we present values derived from network analysis, for the total network as well as various subsections. We identify and categorise the 5% of Twitter profiles with the most connections within this network to show what types of social actors hold the most privileged communication positions. Where Twitter profiles can be assigned to a specific geographical location (businesses for example) we plot these profiles on a map of the area so as to explore the link between network and spatial relationships. Finally, recognising both the limitations of a data-first approach to social phenomena, and the aforementioned issues in treating a technological network as equal to a social network, we illustrate our conclusions with qualitative evidence from 30 min in-depth interviews with a number of the blog's users. In what follows, we outline briefly the steps taken for each of these methodologies.
Data gathering
In a social network graph, vertices represent individual Twitter profiles with specific usernames, and edges represent a following relationship in either direction between vertices. The network of Twitter followers centred on @BC (its egonetwork) is a graph that comprises a set of interconnected vertices linked by one edge to @BC and all the edges between them.
Data was retrieved by querying Twitter's API at a specific point in time, offering a snapshot of following relationships at that moment. Initially all @BC's follower profiles, and the followers of @BC followers, were contained in an undirected graph constructed of all the connections between those profiles. To construct its egonetwork all the users that were not directly connected to @BC were removed, as shown in Figure 4.
Network building.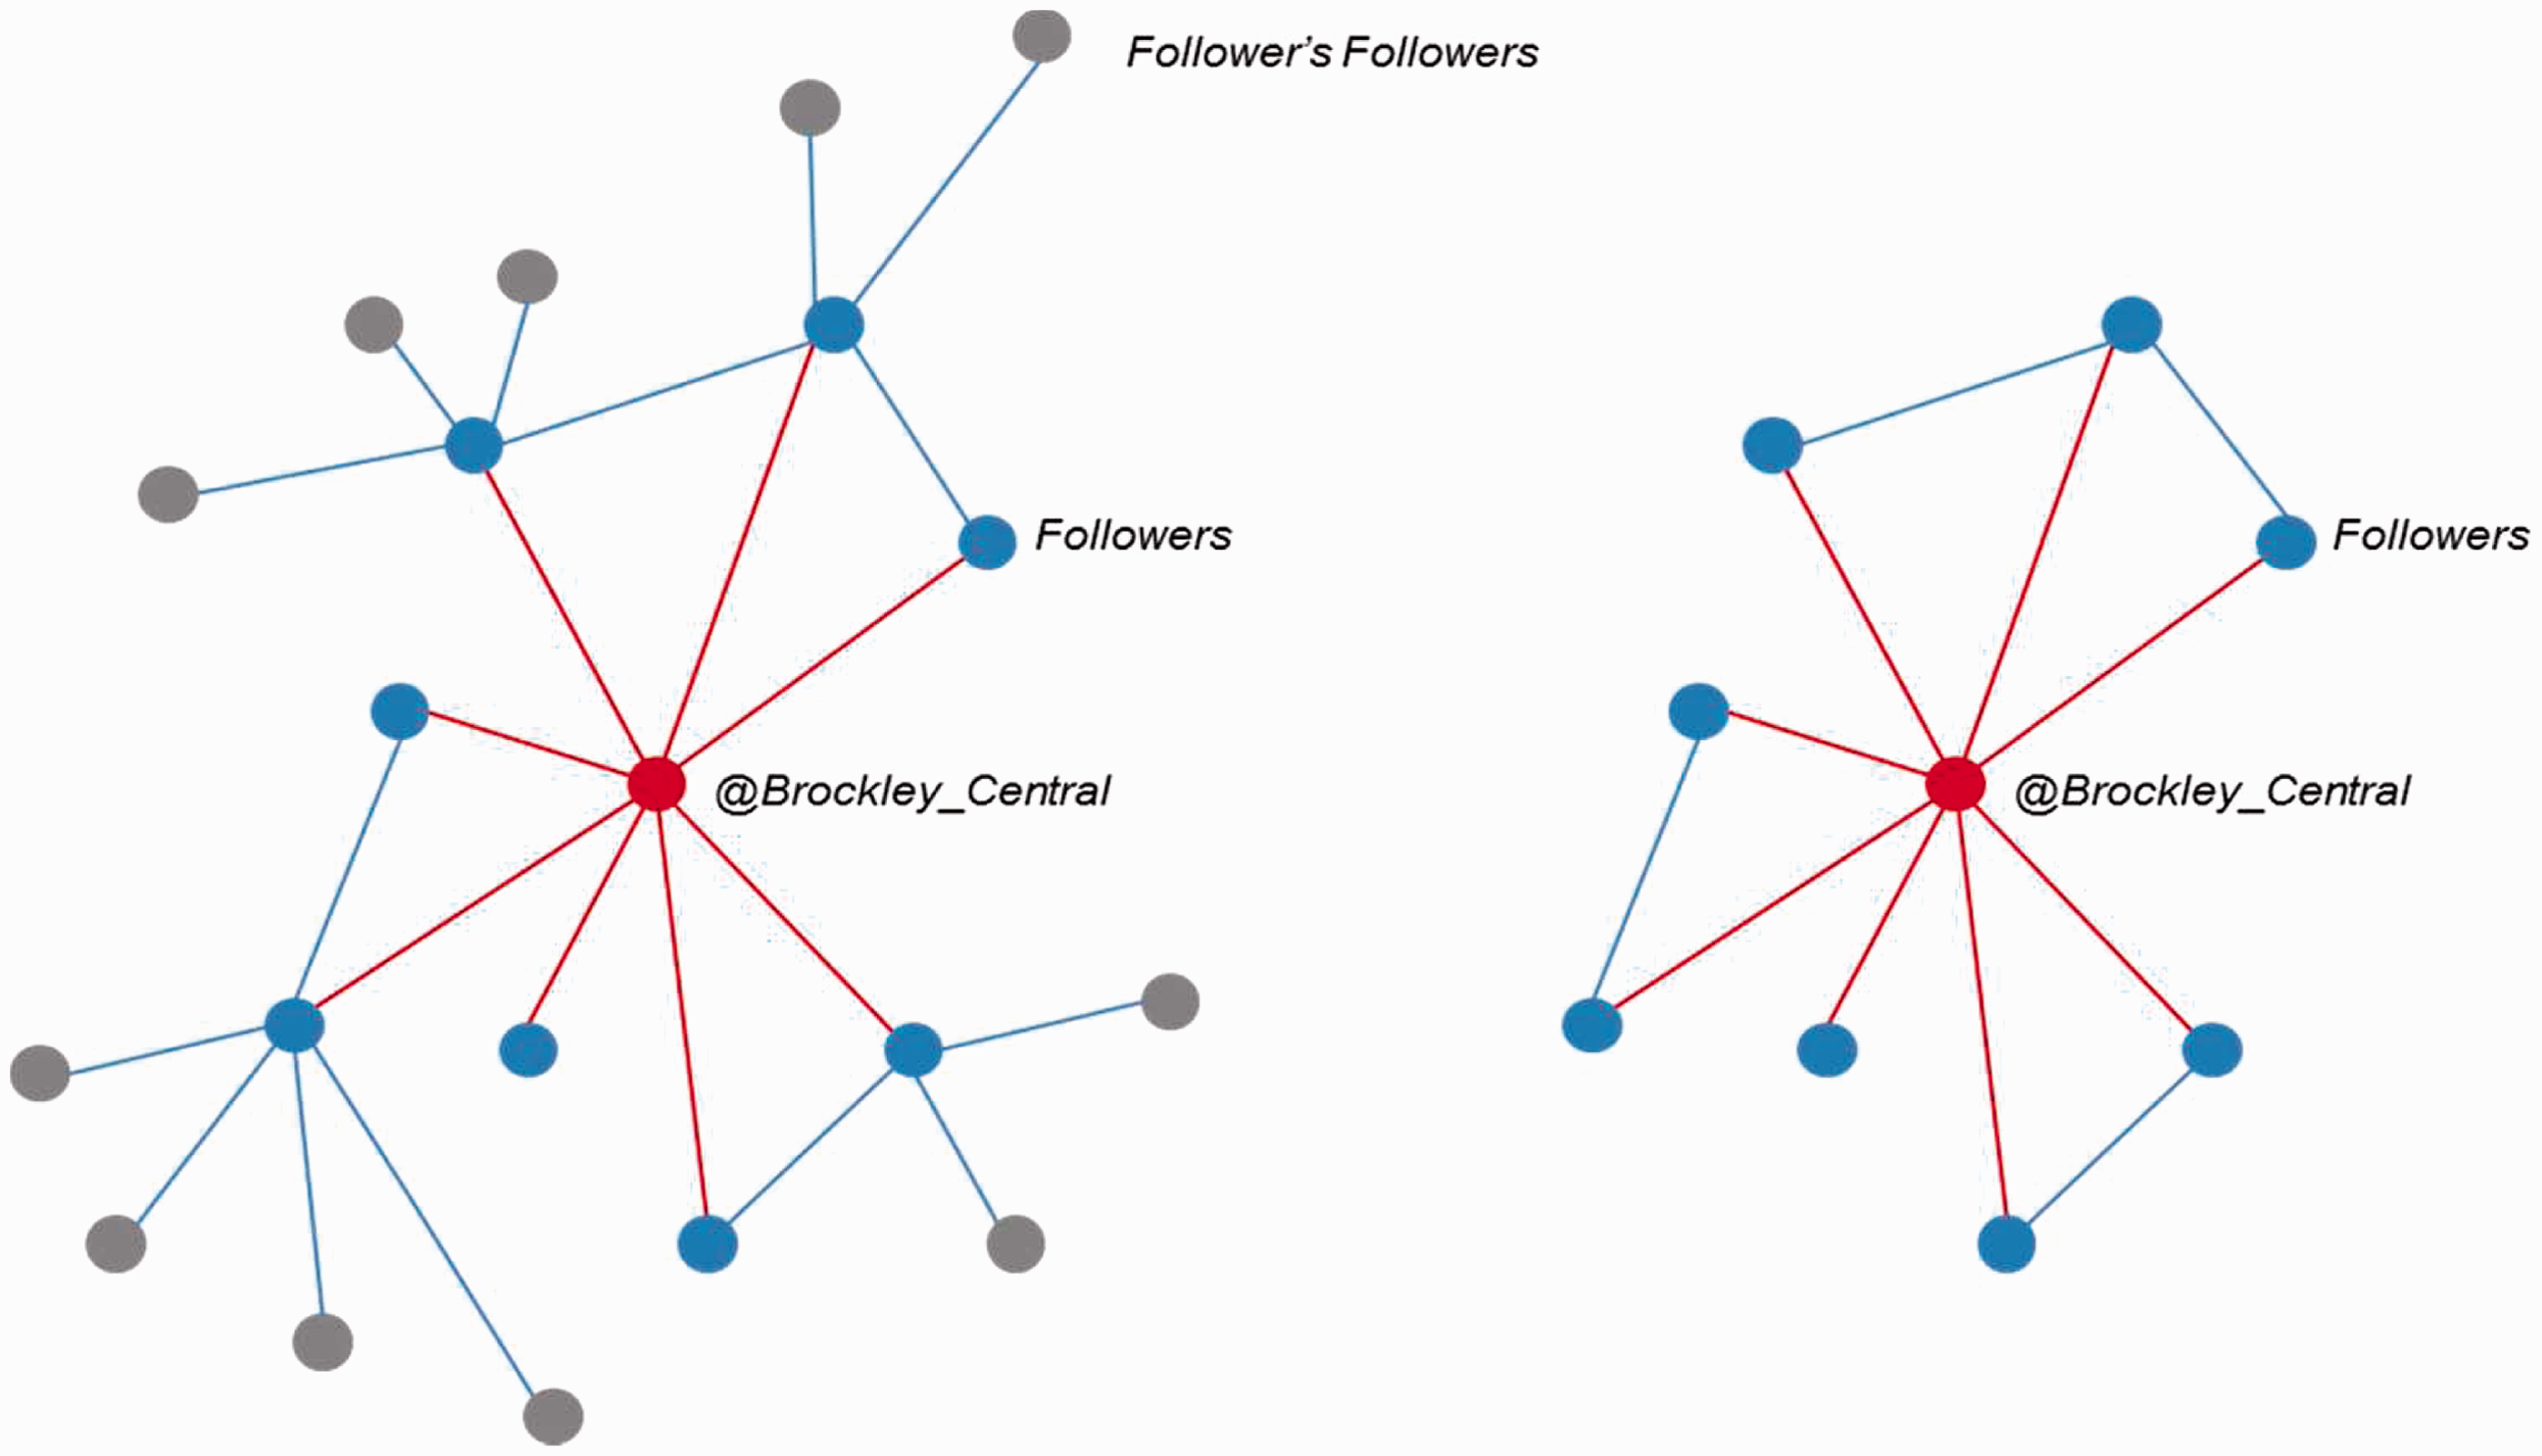
Network analysis
Analyses were conducted on the entire egonetwork, the egonetwork minus the 5% 2 of users with the greatest number of connections within the egonetwork, and on eight sub-graphs comprising closely linked vertices partitioned by community detection techniques using the open source network analysis software Gephi (Bastian et al., 2009). For every vertex a degree value is generated showing the number of edges it shares with other vertices in the graph. In other words, for each profile the degree value represents the total number of that profile's Twitter friends and followers that are also followers of @BC. Furthermore, values were calculated showing global characteristics for each graph and these are explained below.
Community detection looks for ‘the appearance of densely connected groups of vertices, with only sparser connections between groups’ (Newman, 2006) that, depending on the entities comprising the network, may then be described as social groupings or communities of interest. The community detection method used here partitions the graph into groups by detecting vertices with similar connections using a quality function called modularity. Modularity (Q) is a standard network analysis defined by a formula where A is the adjacency matrix, m is the total number of edges in the graph, ki and kj are the degree for i and j. Modularity is 1 if i and j are in the same community and zero otherwise. Applied to the @BC-centric graph this partitioning resulted in eight modularity classes each representing a sub-graph of more densely connected vertices within @BC's egonetwork

The clustering coefficient (C) measures for each vertex in a graph the average probability that the neighbours of a vertex are themselves neighbours (Watts and Strogatz, 1998). This metric ranges from 0 to 1 where 0 represents no connection among its neighbours and 1 represents all the neighbours are themselves neighbours of one another. We will use the average local clustering coefficient in this study as a global metric for the graph, where a result of 1 would represent every vertex in the graph being connected to every other and a result of 0 would represent a single hub vertex connected individually to many vertices with no direct connection to one another


Identification of profiles
The top 5% segmentation of degree values was used to define a sample of the most connected profiles within @BC's egonetwork, meaning all users were selected with degree equal to or greater than 272, totalling 290 profiles. These were categorised and where possible assigned a geographical location. Twitter profiles do not include machine-readable data defining the type of entity they represent (i.e., individual, business, organisation, media outlet, and so on) or that entity's location in real space. Therefore, these characteristics were defined and attributed manually by the researchers, based on public information displayed on Twitter profiles, supplemented by comprehensive knowledge of the study area gained through long-term involvement through this research and use of internet-based research to find business websites for example. Clearly this process will be imperfect: user types were created based on the judgement of the researchers simply for the purpose of characterising @BC's followers and included businesses, media, hyperlocal sites, culture, services, community organisations and individual people. Location information was recorded to the greatest degree of accuracy possible. For some this meant the level of a neighbourhood or borough, but wherever a specific location could be determined (for a business or public amenity with a specific address for example) its postcode was recorded from Google Maps. Unlike zip codes in the USA, full UK postcodes provide a satisfactory level of accuracy for this undertaking and are commonly used to pinpoint location data. Commonly London postcodes contain just a few buildings, or even one with several addresses (Office for National Statistics, 2010). So whereas the postcode area SE4 is a marker of spatial identity for the whole of Brockley, a full postcode (i.e., SE4 2RW) pinpoints a single location (in this example the train station).
Twitter profile mapping
Out of the 290 categorised for which a postcode was available, latitude and longitude coordinates were generated using the online service GPS Visualiser (http://www.gpsvisualizer.com/geocoder/) which assigns a pinpoint location at the centre of the small area designated by a full postcode. This coordinate data was then imported into a Geographical Information System and linked back with the tables containing data such as categories, modularity classes and degree for each vertex. This allowed the vertices to be represented as points on a map and visualised according to their data attributes.
Qualitative interviewing
The interviews from which anecdotal evidence is drawn for this paper are a sample of 20 forming the initial part of an ongoing study into media use and communication networks in the neighbourhood of Brockley. Respondents were self-selecting, responding to an advertisement on BC's site and are not a stratified sample of the population of BC's users. Each took part in a 30 min semi-structured interview, with prompting questions about their means of access to information about the area and communication with other residents, but an open-ended approach allowing the respondent to guide the discussion. Their evidence was treated with a grounded approach, using the coding method of qualitative content analysis in which ‘incidents’ in the data (statements with bearing on the research question) are assigned a category by the researcher, enabling cross-reference between interviews (Glaser and Strauss, 2009: 1). Given the limited nature of the analysis of this data at this stage of the research it is treated as anecdotal, but offers a valuable way to relate phenomena suggested by network analysis and theoretical interpretations to the lived realities of hyperlocal media users.
Analysis results
A total of 5952 registered Twitter users were identified as followers of @BrockleyCentral in a Twitter API query carried out on 26 March 2014. This section lays out the results of the network analysis and mapping of these profiles.
Network analysis – @BC-centric graph
@BC egonetwork values.

Quantiles and descriptive statistics for full @BC network.


@BC-centric egonetwork with separate modularity classes (‘communities’) shown by colour.
The clustering coefficient (Table 1) however – which has been analogised as the degree to which members of a social network know one another and are a ‘clique’ (Watts and Strogatz, 1998) – is surprisingly high at 0.48 (on a scale measured from 0 and 1). This network has a comparable clustering value to other network examples that have been defined by Watts and Strogatz (1998: 441) as showing characteristics of the ‘small world phenomenon’. This might be surprising considering a network in which the median degree value is only 0.35% of the maximum value in the distribution. This suggests perhaps that whilst the majority of profiles below the median degree have few connections, those they do have are to the same set of highly connected profiles which themselves are connected in a tight clique. The next section will examine who these highly connected users are by looking at the profiles within the top 5% of the degree distribution, giving a sample of 290 individual Twitter profiles.
Identification and location of most connected profiles
Top 20 @BC followers in terms of degree with example categorisation and location.

Amongst this sample nearly half of profiles are either individuals or businesses with varying degrees of spatial proximity to Brockley itself. Figure 6 breaks down these types into sub-types, showing that amongst those profiles assigned to individual people the majority is accounted for by bloggers, journalists, local councillors and council candidates (the sample was taken in the run-up to local elections). Like local businesses, these individuals all have significant public profiles or means of communication outside of Twitter. This network amplifies their existing positions by providing access to a local audience rather than distributing communication between individual citizens.
Pie chart breakdowns of @BC follower categories and subcategories.
The map in Figure 7 plots profiles within the top 5% most connected vertices in @BC's egonetwork that represent bricks-and-mortar entities. These are mainly independent businesses with single locations that can be specified with certainty by their postcodes (as explained in ‘Identification of profiles’ section, postcode centre points in this instance give a satisfactory level of locational accuracy with a maximum of around 100 m error in a map covering an area around 8 km×6 km). For each profile, the size of its icon represents its number of connections within the network and its colour represents the modularity class detected in the network analysis. So those sharing a colour have been determined – purely on the basis of analysis of their network connections and before any plotting of geographical location – as being within the same ‘community’ or network sub-section of Brockley Central's Twitter followers. The distribution of these network communities shows a strikingly clear geographical pattern. One community (shown in red) is formed of businesses clustered mainly along the main road (shown in pink) that forms the linear centre of Brockley, with two outliers to the east in the main road's residential hinterland, including Brockley's weekly food market. As we will see from the anecdotal evidence, many of these businesses are key physical landmarks for users of Brockley Central with visible presences along Brockley Road (see Figure 8) but also key communicators that help distribute the news stories posted on the blog. Businesses that are geographically central to Brockley and linked by its high street also appear to be ‘central’ to @BC's egonetwork, with the greatest number of connections, and also densely connected to one another. These businesses are not just geographical neighbours but interest groups too, with identities as Brockley traders and a common goal of increasing local trade. They form a ‘converging community’ of place and interest that has been described as the strongest basis for network formation on Twitter (Loureiro-Koechlin and Butcher, 2013). In the ‘Interviews’ section it will become clear how valuable this combination of network and geographical connection is for the owners of these businesses.
Modularity classes of located profiles shown (size increases with total number of network connections in @BC-centric network). Contains Ordnance Survey data © Crown copyright and database right 2012. Located profiles, modularity classes and images showing presence on Brockley Rd. (Images © author). Contains Ordnance Survey data © Crown copyright and database right 2012.

To the east and west of Brockley Road are ‘communities’ that appear geographically sparser and whose members have fewer connections than those on Brockley Road. It is important to remember that only businesses that are in the top 5% most connected within Brockley Central's network are shown here. Peckham to the west of Brockley and separated from it by a deep train cutting that creates a gap in the urban fabric clearly visible on the map in Figure 7 is a significant town centre with many local businesses and its own hyperlocal site and newspaper, the Peckham Peculiar. Undoubtedly if an analysis were centred on its feed Brockley would appear linked but peripheral and more fine grain network modularity would show up between the centre of Peckham and nearby high street of Nunhead, also severed from Brockley by the train line. From Brockley Central's perspective, businesses in Peckham and Nunhead are more linked to one another that they are to those on the other side of the tracks on Brockley Road even where ‘as the crow flies’ they may be closer to the latter (as for example is the case with two businesses shown on the map: DishSE15 and ArloMoe). The case is similar to the east, where a small number of businesses spread across Lewisham and Blackheath form one geographically widespread network community separated from Brockley by a small river running north into the Thames. Conversely New Cross and Deptford lie to the north of Brockley and are closely linked with it by direct rail and street routes without the interruption of significant physical barriers. There many local businesses feature strongly within Brockley Central's Twitter network as well as being closely connected to one another in both network terms and spatially, being located on the conjoined high streets of the two areas. So what seems to be the case in the example of Brockley Central is that its Twitter network overlaps and interlinks with those in surrounding areas, but is to varying degrees shaped in part by spatial conditions. Physical breaks in the built environment such as rivers and wide rail cuttings seem to be played out as delineations in the structure of Brockley Central's Twitter network. 4
BC centric graph less top 5% – Network analysis results
Comparative network values.

Even without the most connected users the degree distribution remains highly skewed with the most connections held by the fewest. The clustering that does show within this sub-section of the graph can be accounted for by a small number of profiles shown at the centre of the network in Figure 9. This structure has been described as a broadcast network: ‘a hub surrounded by many spokes, who retweet the hub's material but do not connect to one another’ (Smith et al., 2014). The hubs in this instance are business, individuals and media outlets from surrounding areas, with lower levels of connectivity than those central to Brockley but still the cohering elements in a network otherwise formed of disconnected individual residents.
@BC-centric network minus top 5%, with degree distribution graph.
Interviews
Initially we asked how to characterise the social media network formed around a hyperlocal Twitter feed in Brockley: as a community of smart citizens brought together in a network of collective action or as a news distribution tool adapted to bring information to a localised audience. The network analysis given so far has certainly given credence to the latter interpretation. With the very recent availability of vast amounts of data on Twitter following relationships it has become tempting to diagnose the structures of ‘community’ through these machine-readable social ‘ties’. However, we recognise the limitations of a data-only approach that limits rich social experiences that can be had through social media to edges in a graph. Certainly much contemporary research is attempting to enrich this data-first approach by developing tools that can detect the sentimental content of internet-mediated communications (Quercia et al., 2012). The aim here though is not to categorise the content of communications within this network but to attempt to reconstruct the lived experience of using it based on evidence given by Brockley Central's readers, systematically analysed to determine recurring themes. Therefore, in what follows, we present a small amount of this evidence and then relate the common experiences that emerge to discussion of both the network results presented here and existing theorisations of local media that reinforce the concepts suggested.
The in-depth interviews carried out with self-selecting respondents to an advertisement on Brockley Central's blog and Twitter feed were framed as a general discussion about Brockley and the way its community life works. When asked about their use of Twitter, those interviewees active on the platform spoke about their experience of following the kinds of accounts that have been shown previously to form the tightly connected centre of Brockley Central's network. All mentioned by name businesses that they follow on Twitter and some recounted how they actively tailor their Twitter feed to provide information about the area. One asked ‘otherwise how would I know what's going on?’ Businesses have a vested interest in promoting events that draw people to the area, increasing trade, and individual residents benefit from being informed about opportunities to gather physically with a community they can otherwise find hard to access, as we will see. For example Croftfest in the Crofton Park sub-area is a festival initiated by a group of business owners who, according to one that was interviewed, retweet one another to promote the event to a combined audience of thousands. This same business owner was referred to by another respondent as ‘big on Twitter’ and a ‘key figure in our community’ who galvanises action. Individual people can develop privileged communication positions on Twitter thanks to the visibility of their businesses and become local opinion formers. Businesses are the most obvious local entities – they are already visible within Brockley's public space and do not have to state their location – whereas other local residents’ geographical identity can be harder to ascertain.
The businesses along Brockley Road have been shown to form a clique or ‘small world network’. The business owner interviewed reported first-hand experience of the value of this small world: ‘I'll tweet things like “I really need to borrow a hammer”, and then someone from another shop will walk down the road with a hammer. Things like that happen all the time’. This interconnection was evident to many interviewees. One respondent explained with pride how businesses promote one another, encouraging people to shop locally. This was reflected in the experience of several others who had found their way from the profile of one business to other local accounts via their public discussions with one another on Twitter. This also goes some way to explaining the even stronger connections between businesses in small local clusters than in the wider geographic area covered by Brockley Central's social network. These truly hyperlocal networks covering micro-centres in the area appear to provide highly localised news in exchange for patronage by local residents.
However as the network analysis showed, the majority of users in @BrockleyCentral's egonetwork are not included within these cliques. Very few unaffiliated residents featured within the most connected vertices and all interviewees showed awareness of this in one way or another. ‘I don't think I’m following the right sort of people to get that type of information. And it's a little bit tricky trying to find them’ reported one. One felt she did not have enough local followers to be able to use Twitter to ask for advice or help from neighbours. Another found that despite attempts to access what appeared as a strong local community online the interactions were all non-reciprocal, and it was difficult to make mutual connections with other residents. Several others though expressed an active choice to avoid seeking local social contacts and highlighted the value of Twitter as a purely informational resource. More than half the respondents mentioned ways in which they made use of Twitter as a broadcast network for information. It is valuable as ‘one central point’: a convenient aggregator of links to news posts from a variety of local sources.
However, one interviewee described an interesting mechanism in which local residents can sometimes share the visibility of local businesses. If a business does retweet or respond to an individual on Twitter and these communications show publicly, that individual is authenticated as ‘local’ by engagement with a recognised place. For a brief moment, they become highlighted to other followers as a member of place-based community by being present in the communication space created by that business on Twitter. It is a process analogous to the unmediated way in which local businesses can create recognition between neighbours through habitual use of that physical space, something that several respondents reported as their main way of developing acquaintances in the local area.
So why this discussion of businesses in an analysis of hyperlocal media? As Brockley Central is ostensibly a news source, it relies on events and change to create stories for reporting and on the existence of public or semi-public spaces and places used by the local population and therefore of shared concern. Businesses are the main locus for this shared awareness – new openings, closures, reviews, events, and so on, all create news to be reported and indeed this type of content forms a significant part of the reporting on Brockley Central. One interviewee described the sense of ‘fervour of waiting for this new place to open’ created by residents’ comments on blog posts and their Twitter comments retweeted by @BrockleyCentral. According to this interviewee, the level of excitement usually exceeds the value of the new business itself. It seems to be a way of affirming a shared sense of belonging through common awareness of place and its changes. So businesses act as both referents – topics of discussion that affirm shared place identity – and communication assets – key nodes in a mediated news distribution network. To describe this phenomenon further we draw from ‘communication infrastructure theory’, a framework for understanding multi-modal informational networks developed by Sandra Ball-Rokeach et al. (2001) through research in LA's neighbourhoods. They describe local informational exchange as ‘neighbourhood storytelling’. As opposed to the ideology of smart citizens, in which communication is politically instrumental, the neighbourhood storytelling interpretation characterises local communications as non-instrumental: the sharing of opinions, gossip, news, and so on. In other words, the value of this informational exchange is not in the behavioural or political outcome it produces but in the ‘ability to “imagine” an area as a community’ through ‘stories about “us” in this geographical space’ (Kim and Ball-Rokeach, 2006). Brockley Central produces stories about places in Brockley and broadcasts them via Twitter; places in Brockley help distribute those stories through Twitter to a localised network of followers; those followers then perceive the existence of a local community via their participation in this network, despite a lack of direct communication with other local people. One respondent summed this up as follows: not necessarily knowing who all your neighbours are, not being in a village, but then you have a kind of layer on top of that that performs some of the functions of it so I think it's kind of like the best of both worlds. Because there is this perception of it and it does sort of exist, but at the same time it doesn't.
Conclusions, limitations and further work
Discussion and conclusions
So this hyperlocal news broadcast network on Twitter may not often bring individual residents of Brockley directly into contact with one another as a community but does, through the creation of informational commons, help create a more intangible ‘sense’ of community and shared concern. To know the value of this is beyond the scope of this paper. Perhaps it can engender a feeling of responsibility to and involvement with a local area that could lead to greater civic activity. Perhaps engagement with non-instrumental neighbourhood storytelling on Twitter though is in danger of standing in for meaningful collective organisation. These are questions for further research.
For now though we return to our original questions. In response to RQ1, we have argued for the interpretation of Brockley Central as a news distribution network. In response to RQ2, we have expanded upon the simple notion of news broadcast. We have suggested that @BrockleyCentral does not stand alone as the centre of a broadcast network but is supported by tight cliques of local businesses that help distribute neighbourhood stories. Though mainly non-reciprocal and top-heavy this social media network can, we have suggested, still engender a sense of place and community.
Our final question RQ3 feeds into wider methodological debates about the value of Twitter data in social research, and its success in representing the lived experience of place-based mediated sociality. In a sense we asked: to what degree can a social media network be thought of as a representation of community practices? This question requires a little further discussion. The discovery that Brockley Central's Twitter network consists in part of geographically localised network concentrations consisting of following relationships between locally high-profile entities including businesses, political figures and hyperlocal media outlets, suggests evidence of ‘communities’ created in place and through social media. Network graphs offer a tempting solidity as a representation of a local community but there is a danger of imagining them as such. As Latour has argued, communication pathways, such as Twitter following relationships, should not be seen as stable entities, but as potentialities that are activated and used as controversies stimulate the need for information flow through these networks (Latour, 2007), and temporary publics are formed around the issues these controversies raise (Law et al., 2014). We must also remain very aware of who forms networks and the unequal ways they can be accessed by different actors. It is not the provision of networks alone that automatically allows people to have greater involvement in the production of their environments. The means to connect does not guarantee the means, the willingness or the ability to act. By placing too much focus on social media as a civic tool we risk allowing an ideology where the network becomes the end in itself rather than one tool in service of neighbourhood civic life.
Limitations and further work
Our conclusions here cannot account for all the many diverse attempts at producing hyperlocal social media using Facebook, Twitter or other platforms and across extremely different cultural, socio-economic and spatial settings in the UK and beyond. They are also limited to one aspect of Twitter – its network of following relationships. The new field of social media research throws up many technical challenges for researchers outside of computer science fields. Ideally our analysis would account for the strength of following relationships by taking mutual following into account, and could be enriched by combining it with data from Twitter reply networks and content analysis. Our investigation of geographical distribution has also been limited to entities such as businesses that by their nature have a publicly available location. To pinpoint individual Twitter users’ home locations from their publicly available data in a way that would be meaningful at this local a scale and in great enough numbers remains, as far as we know, impossible, given the extremely limited number of geo-tagged Twitter data. However, we have hopefully demonstrated a valuable multi-modal way to investigate the relationship between mediated social networks, people and place through both ‘online’ and ‘offline’ research, supporting the argument for an interpretation of hyperlocal media as a news distribution network and suggesting ways that this kind of network can still be thought of as having civic value for geographically defined urban communities. Whilst the case study is singular and the datasets here could hardly be referred to as ‘big’, we do believe this work has some salient points for researchers, community entrepreneurs, local governments and others wishing to access Twitter data as a way to investigate place-based urban communities. Firstly, that underlying and aggregated aspects of the data such as the shape of the graph of social connections could be important in understanding the way Twitter facilitates communication in this neighbourhood, as well as some of the more ‘real-time’ data on opinions and live geo-locations that are more often drawn out. Secondly, that it is important to further illustrate the picture offered by data through qualitative research. For example, in this work the Twitter network appeared to be poor in actual connections between individual residents, but it still offered a rich sense of connection reported by users that could not be captured through any means of automated data collection known to the researchers. Finally, we would go so far as to suggest that the instrumental value of Twitter as a tool for political and social engagement, whilst valuable when it works, should not totally eclipse its symbolic value as a performative representation of local public life, fuelled not only by individuals but particularly by local businesses. In further work, we intend to substantiate the position advocated here through more detailed mapping of Brockley's communication ecology, by following the communication pathways activated around local controversies, such as changes and redevelopments to the built environment.
Footnotes
Acknowledgements
This work has been made possible by the cooperation of Brockley Central's users and its creator Nick Barron, who has given permission for his name to be used in relation to this research. Thanks also go to Ava Fatah and Dr Laura Vaughan at the Bartlett School of Architecture for their valued ongoing supervision of this research.
Declaration of conflicting interest
The author declared no potential conflicts of interest with respect to the research, authorship, and/or publication of this article.
Funding
The author disclosed receipt of the following financial support for the research, authorship, and/or publication of this article: This research has been undertaken as part of a UCL Built Environment PhD studentship funded in full by the UK Engineering & Physical Sciences Research Council.