
Abstract
We present a new event dataset on xenophobic violence in Sweden, covering all police-reported, hate-crime-flagged incidents involving physical violence between 2009 and 2022 (n = 2,522). The dataset provides a nationally complete and georeferenced record of violent xenophobic offences, combining programmatic extraction of structured police records with manual coding of free-text narratives under transparent inclusion criteria. It includes detailed information on offence types, bias motivations, temporal and spatial context, and characteristics of victims and perpetrators. By maintaining a uniform sampling frame across the full period, the dataset enables consistent longitudinal analysis of xenophobic violence beyond media-based or survey-driven sources. We present descriptive patterns to illustrate its analytical value, highlighting the coexistence of routine, dispersed assaults and episodic surges linked to external events. The dataset offers a transparent empirical foundation for research on hate crime, political violence, and the dynamics of intergroup conflict.
Introduction
Xenophobic violence poses a persistent challenge to democratic inclusion and social cohesion. Yet, systematic evidence on its development and causes remains limited, partly due to fragmented and inconsistent data sources. This article addresses this gap by introducing a new, nationally complete dataset on reported xenophobic violence in Sweden.
The dataset includes all police reports flagged as hate crimes involving actual or attempted physical violence with detectable xenophobic motives, registered between 1 January 2009 and 31 December 2022 (n = 2,522). It contains structured information on time, location, offence classification, and involved victims and suspects. While other data sources, such as victimisation surveys, provide insight into the consequences of violence and the characteristics of those targeted, this dataset enables analysis of perpetrator motivations, violent methods, and contextual conditions. By focusing narrowly on physically violent xenophobic offences – such as assault, arson, attempted murder, and property-directed violence – we maximise construct validity and analytical precision. Unlike existing Swedish hate-crime series, our dataset maintains a uniform sampling frame across the entire period.
The coding universe and variable definitions are fully transparent, allowing researchers to scrutinise, replicate, and adapt the dataset for different analytical purposes. As the first Swedish dataset enabling systematic analysis of hate-crime flagged violent reports over an extended period, it expands the analytical possibilities of register-based data and offers a reliable foundation for triangulation with both qualitative evidence and other data families.
The article proceeds in four parts. We first situate the dataset within the broader data landscape on hate crime and xenophobic violence. Second, we outline our conceptualisation, inclusion criteria, limitations, and coding strategy. Third, we introduce the dataset’s variables and present descriptive trends for 2009–2022, before concluding by discussing implications for future research.
Situating the dataset: Related data sources
Xenophobic violence is documented through four principal data families, each reflecting distinct epistemic strengths and limitations. Contrasting these approaches clarifies both the constraints of existing datasets and the contribution of a transparent, longitudinal administrative dataset.
First, civil-society or third-party reporting systems offer rich qualitative detail and visibility into hostility that may fall outside narrow legal definitions (Schweppe et al., 2020). Many focus on specific victim groups, such as Muslims, Jews, or asylum seekers. While these data sources detail many incidents not recorded by the police, they are less equipped to produce measures that are consistent across time and place, due to their reliance on community engagement, media attention, trust in reporting organisations, and their focus on specific victim groups (Vergani et al., 2021). They function best as complements rather than substitutes for administrative data.
Second, media-based open-source event datasets such as Right-Wing Terrorism and Violence Dataset (by C-REX), The Global Terrorism Database, and Armed Conflict Location & Event Data facilitate cross-national comparisons by relying on structured news reports. Yet, their dependence on media visibility creates well-known biases: routine and low-level incidents are underreported, while ‘spectacular’ or high-profile attacks are disproportionately captured. For phenomena like xenophobic violence – where most harm occurs in everyday settings – media-based data therefore risk elevating the importance of extreme cases while missing routine patterns.
Third, victimisation surveys provide ways of assessing the ‘dark figure’ of unreported violence. EU-MIDIS II and similar surveys, fielded across EU member states, document pervasive underreporting among minority groups and provide harmonised indicators of victimisation and reporting behaviour. At the same time, they typically lack detailed event-level information, rely on respondent’s interpretations of perpetrators’ motives, and offer limited spatial and temporal precision. Survey data are thus better suited for understanding exposure and prevalence than for analysing incident dynamics.
Finally, administrative or police-recorded datasets – the category which this dataset belongs to – offer broad coverage and reflect the state’s formal categorisation of hate crime. By drawing on administrative intake rather than news visibility, these sources mitigate the attention bias of open-source event datasets. In Sweden, such registries are unusually comprehensive by international standards (FRA, 2018). Yet, the published hate-crime statistics often remain difficult to use analytically: restricted access to raw records, shifting definitions and sampling strategies, and variation in flagging practices complicate longitudinal analysis and limit transparency. Moreover, variation in police reporting practices and victim willingness to report introduces measurement uncertainty.
By applying a transparent coding strategy to the full population of hate-crime-flagged violent reports and maintaining a transparent and uniform sampling frame across 2009–2022, our database provides a systematic foundation for longitudinal and spatial analysis of patterns and characteristics of xenophobic violence in Sweden. In doing so, it complements existing civil-society, media-based, and survey data and enables more robust triangulation across data families.
Creating the dataset
In Sweden, incidents enter police statistics through the registration of a police report (brottsanmälan), created whenever authorities receive information suggesting that a criminal offence may have occurred. Reports are typically initiated by victims or witnesses but can also be filed by officers who encounter suspected offences in the course of their duties. At the reporting stage, police may flag cases as potential hate crimes based on available information.
The starting point for our dataset was the full population of police reports regarding suspected violent crime that were flagged as hate crimes during the time period (n = 9 960). Aside from xenophobic motives, the full population of sources also included hate crimes based on other motivations, most prominently homophobia and transphobia. It also included cases that were mislabelled (e.g. given the wrong criminal code), and where the report’s free-text description did not provide sufficient information to determine why the event was flagged as a suspected hate crime. From this universe, we extracted the 2 522 cases that involved legible xenophobic motives and actual or attempted physical violence. We define the inclusion criteria below.
We use xenophobia as an umbrella term covering motivations often treated separately in the literature, such as racism, nativism, nationalism, or hostility toward specific religions (cf. Lundgren and Lejonstad, 2023). This framing highlights their overlap while allowing subgroup disaggregation. Violence is coded as xenophobic when perpetrators target individuals perceived as threats to the dominant ethnic majority’s (in this case ‘Swedes’) cultural values, economic resources, or social relations. What matters analytically here is ascribed foreignness from the perpetrator’s perspective: how the victim is framed by the perpetrator in the police report narratives – through slurs, symbols, stated motives, or contextual cues – rather than legal nationality or the ethnicity of the victim.
We define political violence as acts committed in a political context or for political purposes, distinguishing them from interpersonal violence driven primarily by opportunism or private disputes. Political violence may be instrumental, aiming to achieve or resist political change, or expressive, enacting political hostility without a clear strategic goal. Even in expressive formats, xenophobic violence carries broader political consequences by shaping public debate, generating fear among targeted groups, and reinforcing symbolic boundaries of national belonging.
The dataset includes three categories of violent offences: (1) homicide and attempted homicide (including preparation and conspiracy); (2) assault, including aggravated assault and assault leading to death; and (3) property offences such as vandalism and arson involving public danger. We exclude verbal and symbolic violence (e.g. threats, harassment, and defamation) which dominate both victimisation surveys and official hate-crime statistics (Lundgren and Lejonstad 2023). While substantially important, such offences differ analytically from physical violence as regards reporting threshold, situational dynamics, and causal mechanisms. Including them would introduce additional measurement heterogeneity that obscures the escalation dynamics the dataset is designed to capture. The significantly higher reporting threshold of verbal abuse and threats compared to physical violence (Vergani and Navarro 2023) also makes figures more vulnerable to variations in propensity to report.
Further exclusion criteria
The primary goal of the selection process was to minimise false positives – cases that do not meet our definition of xenophobic violence. While this strategy risks exacerbating the already known underreporting of xenophobic violence, it strengthens construct validity and reliability by removing ambiguous or misclassified cases. Full criteria are provided in Table A1; here, we highlight the most consequential exclusions.
Insufficient evidence of motive
We only retained cases where xenophobic motivation was explicitly stated or clearly inferred from report narratives. Incidents involving racialised victims without any articulated motive were excluded. We also distinguished between genuine motivational intent and racial and other slurs uttered arbitrarily after an assault. For property offences, contextual indicators were required: for example, arson targeting refugee accommodation was included, whereas vandalism without a clear target was excluded. In borderline cases, we triangulated with media reports, social media, and prior research (e.g. Lundstedt, 2024).
Violence within professional duty
Roughly 200 cases involving police officers or security guards acting in an official capacity were excluded. While serious, such incidents follow distinct institutional dynamics and often involve conflicting accounts, making them analytically difficult to compare with violence perpetrated by private individuals.
Other intergroup conflicts
We excluded violence occurring primarily within or between minority groups (e.g. intra-diasporic or transnational conflicts). While in some respects similar to violence directed at individuals perceived as threats to the imagined Swedish national community, violence committed across other ethnic, national, religious or factional lines is conceptualised as different phenomena. Examples of excluded cases are instances of violence between Turkish and Kurdish groups, between Shia and Sunni Muslims, and between different groups in the Eritrean diaspora. A small minority of cases involve transnational far-right activists as perpetrators. While these actors are not motivated by a perceived threat toward the specifically Swedish national community, we have decided to keep them in the dataset. We regard their defence of an imagined White, European, Christian, or similar community to be analogous – albeit at a higher scale – with the xenophobic imaginary expressed by ‘Swedish’ perpetrators.
Coding
A total of 2,522 police reports remained for detailed coding. Each case was reviewed by two to three coders and classified according to a set of predefined variables, drawing on three main data sources: (1) (2) (3)
We employed a mixed strategy: automatic coding (via Python scripts) for structured data and manual coding for unstructured text. Coding procedures are outlined in the Appendix. The codebook is available in the supplemental materials.
Reliability and limitations
Hate-crime-flagged police reports offer a valuable lens on xenophobic violence but also pose challenges related to reporting, classification, and interpretation.
First, the dataset captures only incidents reported to the police. Reporting propensities vary across social groups and contexts, shaped by factors such as trust in authorities, legal status, and perceived risks of engagement with law enforcement. As a result, the data likely underrepresent groups with lower reporting rates.
Second, hate-crime flagging is subject to institutional variation. The precision of police flagging has fluctuated over time, influenced by training, administrative routines, and technical systems (Hagerlid and Granström, 2025). This may generate both false positives and false negatives: some incidents are flagged too broadly, while more subtle forms of bias may remain unmarked (Atak, 2020). Our manual review and conservative inclusion criteria reduce false positives and improve internal consistency but cannot fully eliminate institutional bias.
Third, administrative data depend on relatively stable reporting and recording practices. These practices are shaped by external factors such as media attention, political mobilisation, and public awareness, which influence both victims’ willingness to report and police readiness to flag hate crimes (McVeigh et al., 2003; Scheuerman et al., 2020). Apparent fluctuations in recorded incidents may therefore partly reflect shifts in awareness or reporting behaviour. That said, the dominance of stranger assaults in the dataset suggest more stable reporting dynamics than for many other crime types (Vergani and Navarro 2023).
Fourth, the dataset reflects incidents as recorded at the time of initial reporting. Additional information may emerge during later stages of the justice process. Hate-crime motives are rarely pursued systematically beyond the reporting stage and are difficult to prove in court (Atak, 2020). Focusing on initial reports therefore captures bias indicators that might otherwise disappear in prosecution or conviction data, while maintaining a consistent observational window.
Taken together, the dataset offers a uniquely detailed and transparent view of reported xenophobic violence, but it should not be interpreted as a direct measure of total prevalence. The data are best suited for analysing patterns, situations, and temporal dynamics within a consistently defined reporting universe. Estimating broader societal trends requires triangulation with complementary sources such as victimisation surveys, civil-society monitoring, and media-based datasets.
Ethical considerations
Although the original database contains more extensive material, we have excluded several variables to prevent the deduction of personal information. This applies primarily to free-text narratives, personal identification numbers, and detailed information about victims and perpetrators. For the same reason, we do not report the exact addresses where the incidents occur; instead, geographical information is aggregated to 1 × 1 km grid cells.
These measures follow the principle of data minimisation and aim to reduce risks of re-identification while preserving analytical usefulness. The project has received approval from the Swedish Ethical Review Authority [2024-00955-02].
Empirical patterns
The dataset contains 26 variables grouped into five categories: metadata, offence category and types of violence, context, victim(s), and perpetrator(s). Summarised here, Table A2 in the Appendix provides a full overview of variables, data sources, and coding strategies.
Offence categories
Number of hate-crime-flagged police reports by principal offence category.

All categories spiked in 2015–2016, with a particularly pronounced rise in arson and arson-related vandalism (Figure 1). Many attacks targeted asylum centres, consistent with broader evidence of an anti-refugee wave during this period (Lundstedt 2024). After 2016, assaults declined sharply while property-related offences remained elevated. Cases by offence category and year, most serious offence counted.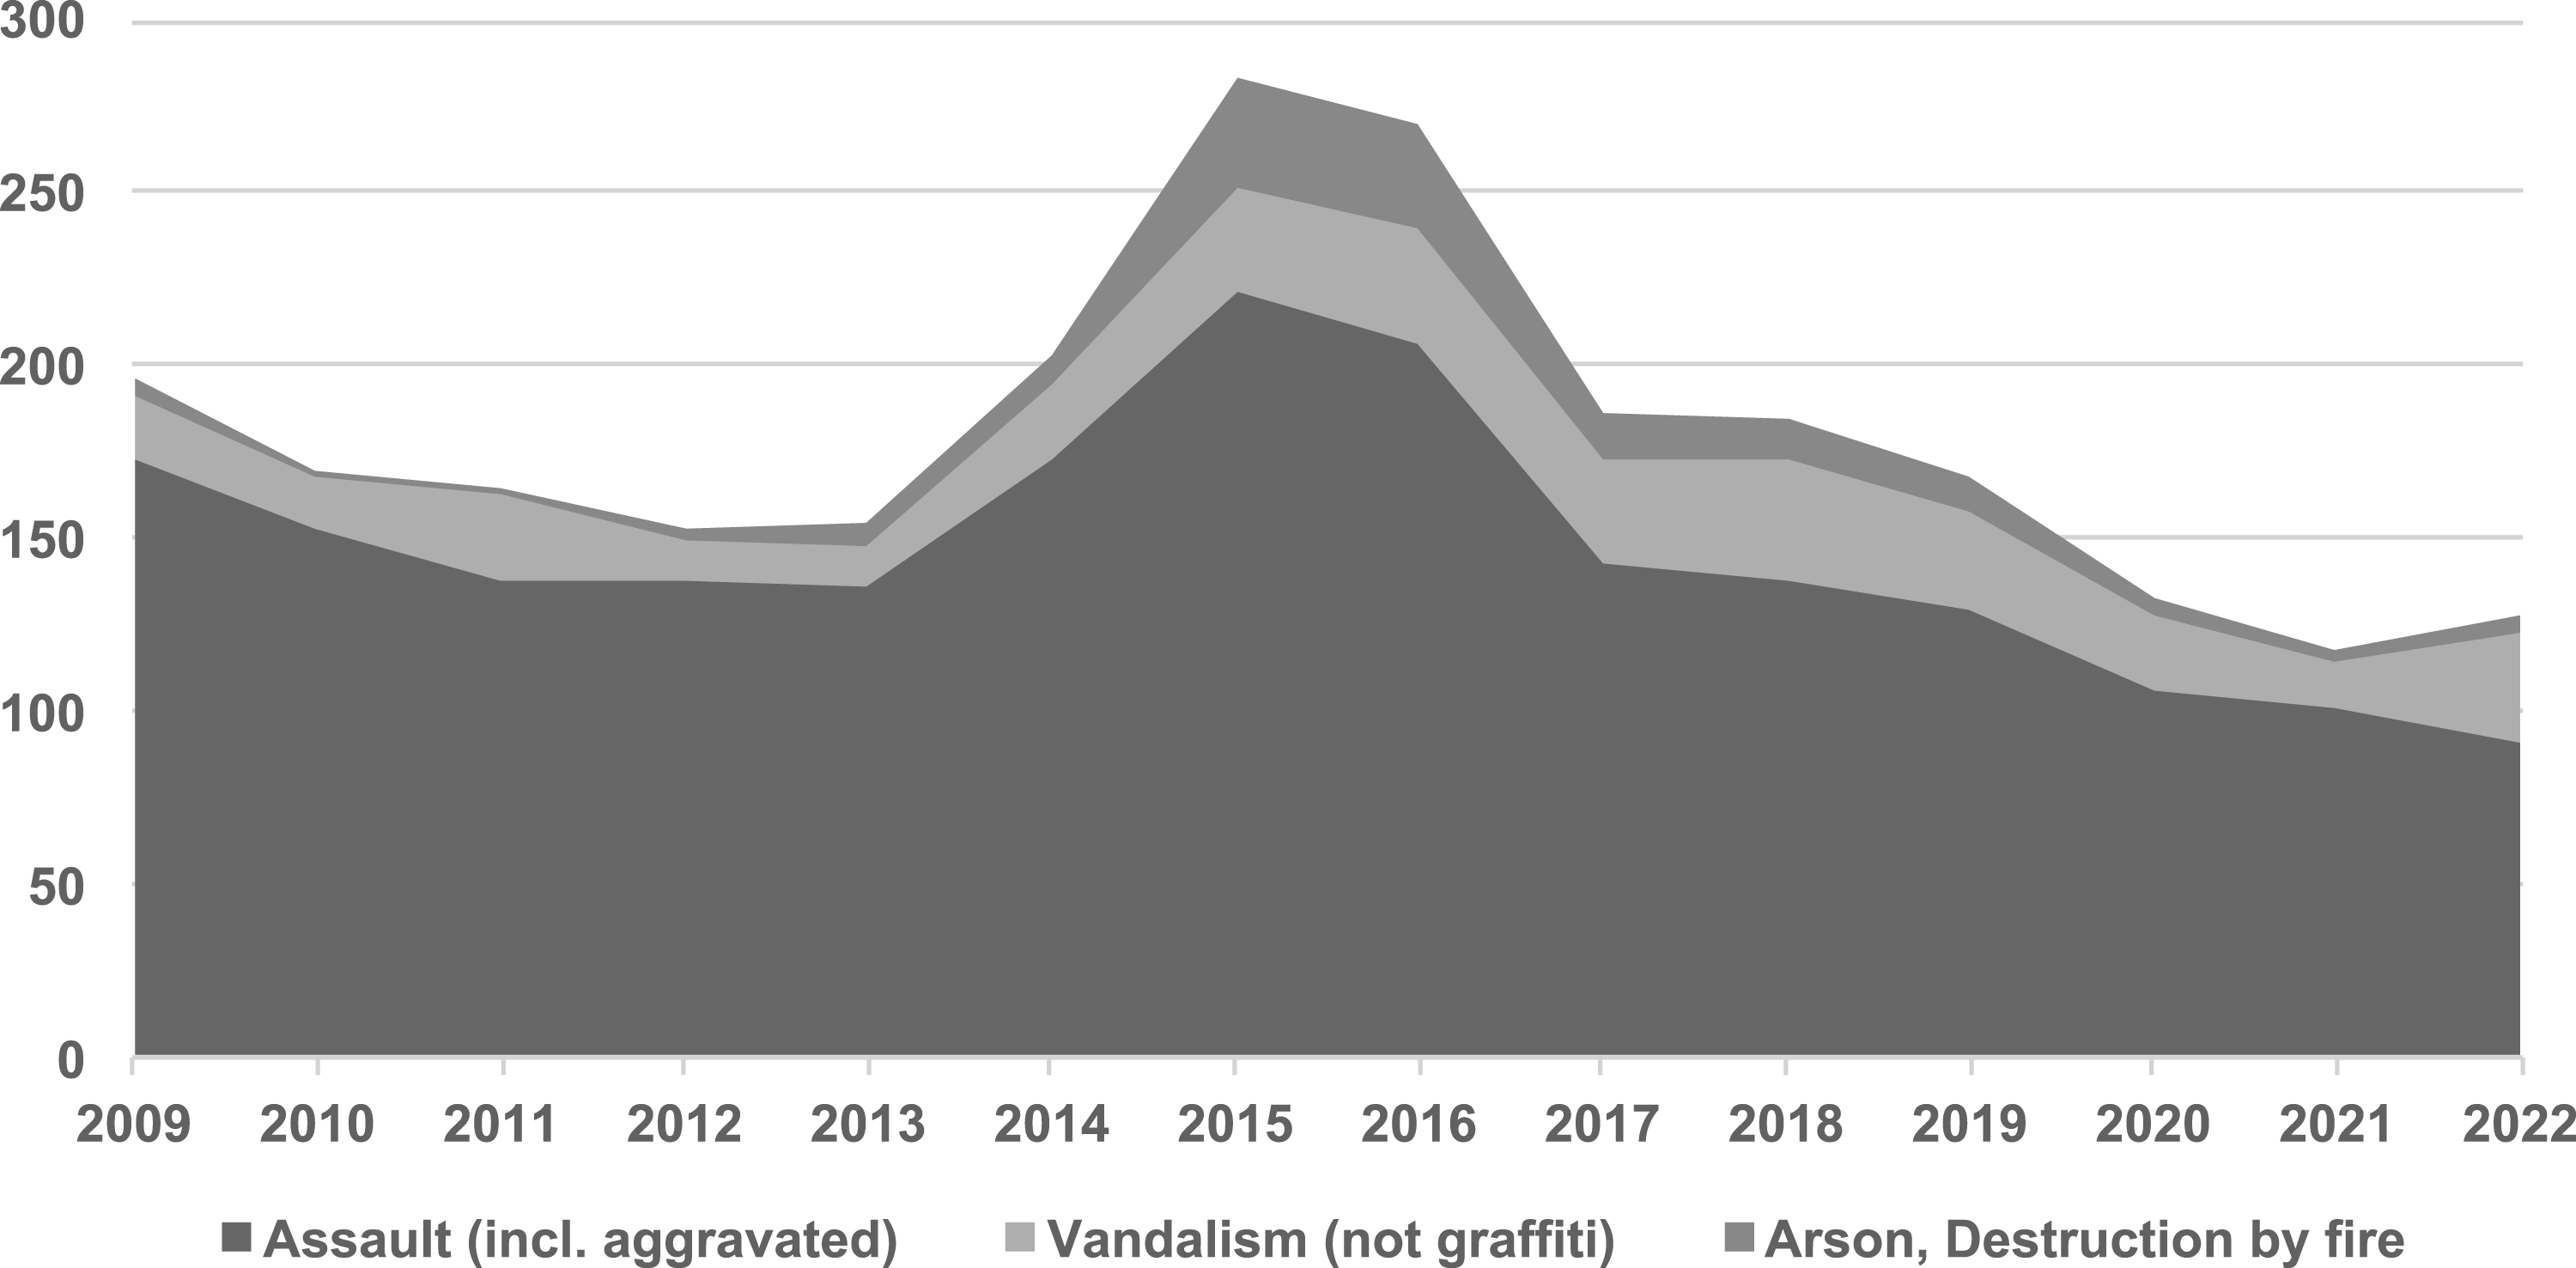
Motives
The most prevalent xenophobic motivations were to target the (perceived) categories of: (a) immigrants/refugees/foreigners (36%), (b) Black people/Afro-Swedes (22%), (c) Muslims/Arabs (9%), (d) Roma/Travellers/EU migrants (6%), (e) Jews (3%), and a residual (f) general xenophobia, for example, racial slurs not linked to a specific minority group (17%). The latter category also captures cases where perpetrators identify the victim as belonging to multiple minority groups (e.g. ‘foreigner’, Muslim, and Black).
These categories follow distinct temporal patterns (Figure 2). Anti-refugee violence peaked in 2015–2016. It did not increase during the 2022 migration wave following Russia’s full-scale invasion of Ukraine. Afrophobic incidents were slightly more common in the early period. Islamophobic cases rose modestly toward the end of the period, peaking in 2019. Antiziganist violence was highly concentrated in 2015, paralleling public debates on EU migrants from Romania and Bulgaria. The pattern for antisemitic violence is erratic, reflecting the low number of incidents. Yearly relative distribution of xenophobic motive types.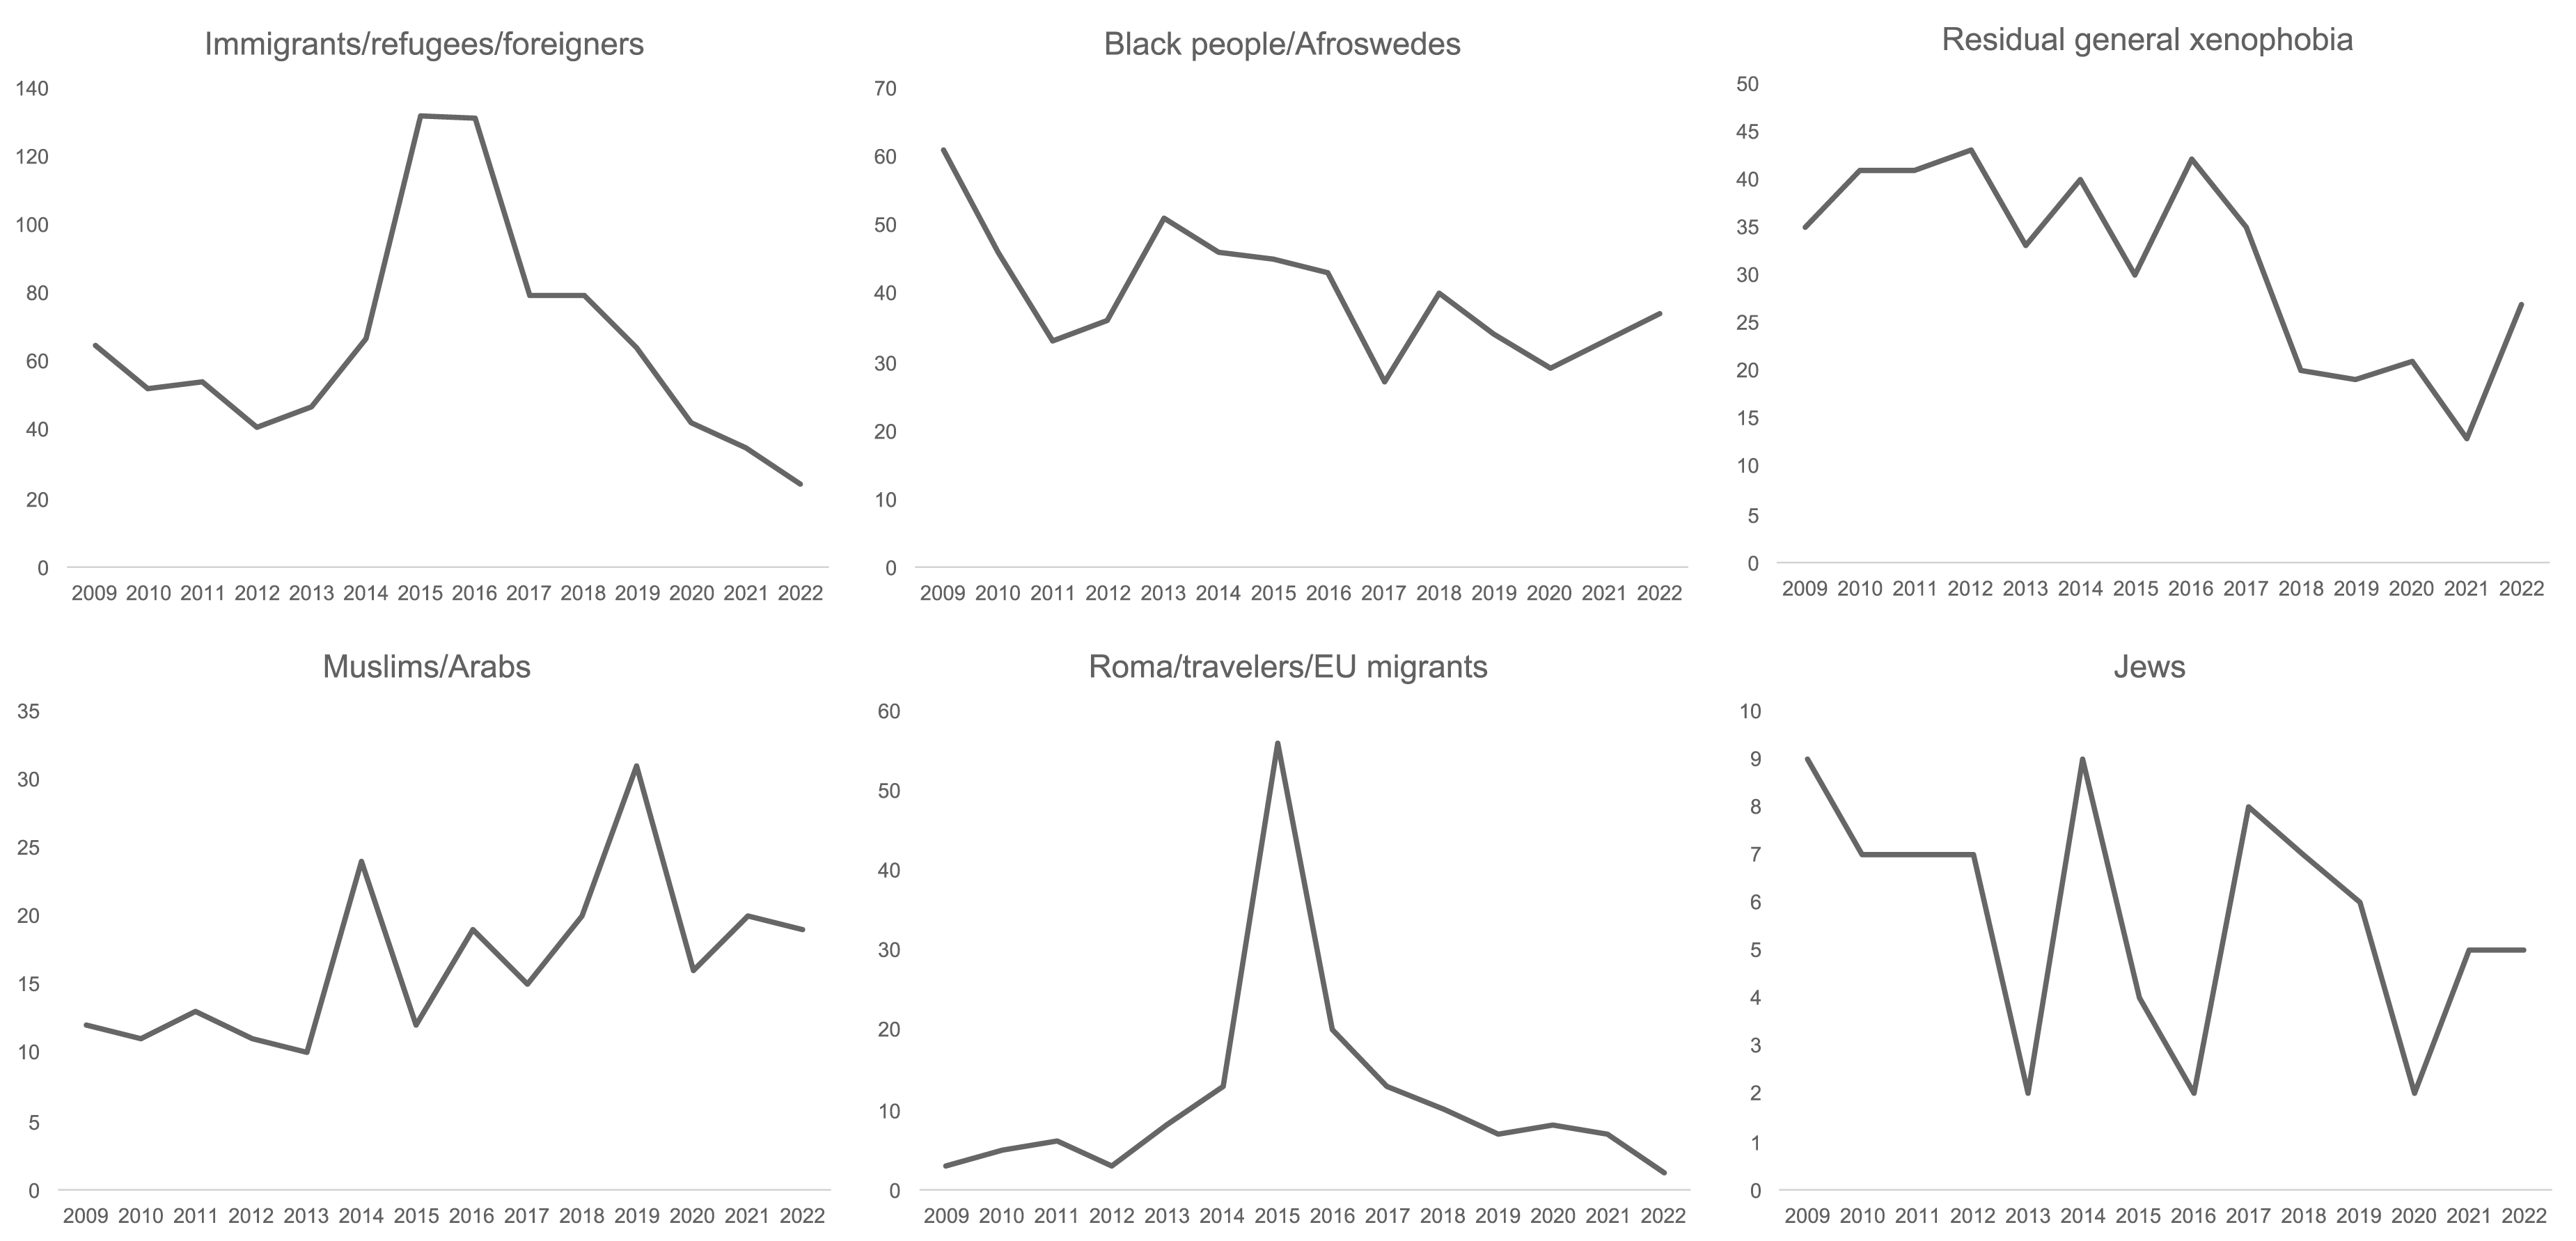
Context: Time and location
Contextual variables capture location (municipality, region, coordinates, site, indoor/outdoor) and time (year, month, day, start/end hour).
Violence is relatively evenly distributed across the country, with the highest per capita rates in Stockholm and Dalarna counties (Figure 3). The absolute distribution largely mirrors population density, with most cases in the metropolitan areas of Stockholm, Gothenburg, and Malmö. Heatmap of (a) absolute case counts, (b) cases per 100,000 inhabitants, regions, and (c) cases per 100,000 inhabitants, municipalities.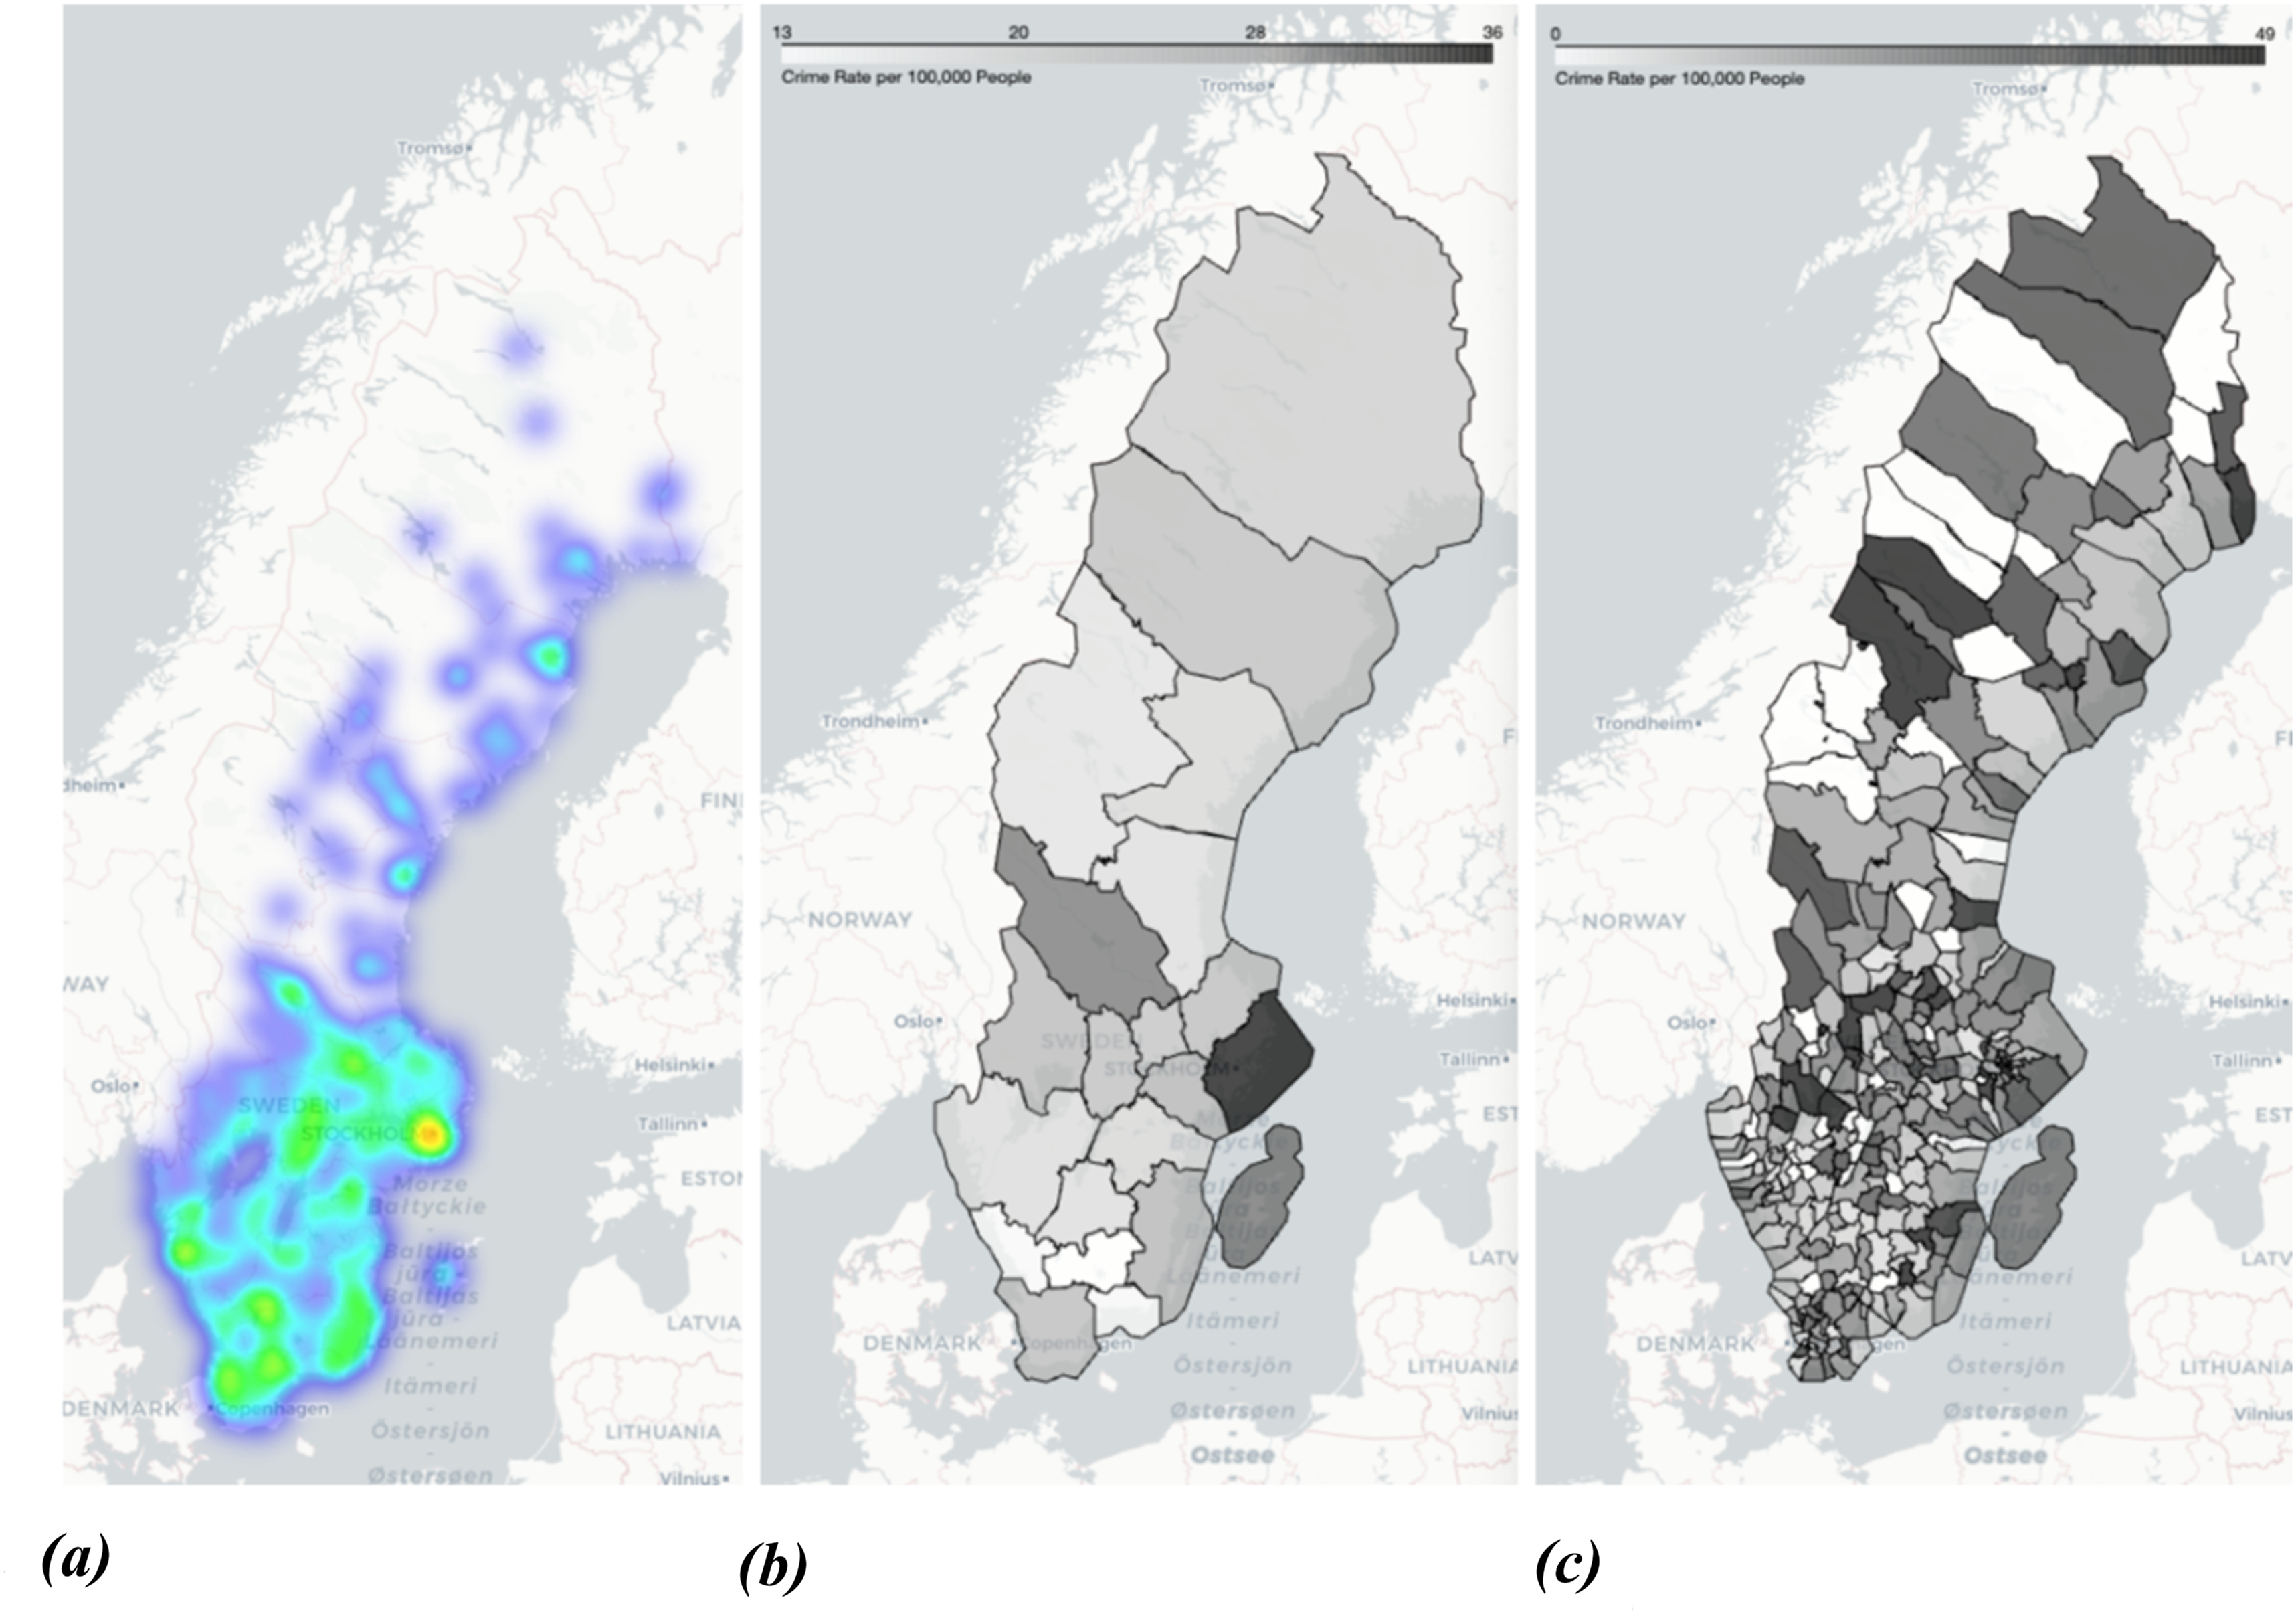
At the city-level, violence clusters in specific environments: public spaces (24.4%), residential areas (18.6%), public transport (16.4%), stores (11.1%), asylum and migrant accommodation (7.8%), religious and ethnic associations (4.7%), and schools (2.8%). Site patterns shifted somewhat over time (Figure 4). During the 2015–2016 refugee reception crisis, incidents near asylum and migrant accommodation facilities increased sharply. There was also a temporary increase in violence around stores, mostly consisting of assaults on begging EU migrants. Over time, violence in restaurants, bars, and public transport declined while attacks in public spaces and residential areas remained stable. Locations of incidents over time (n = 2435).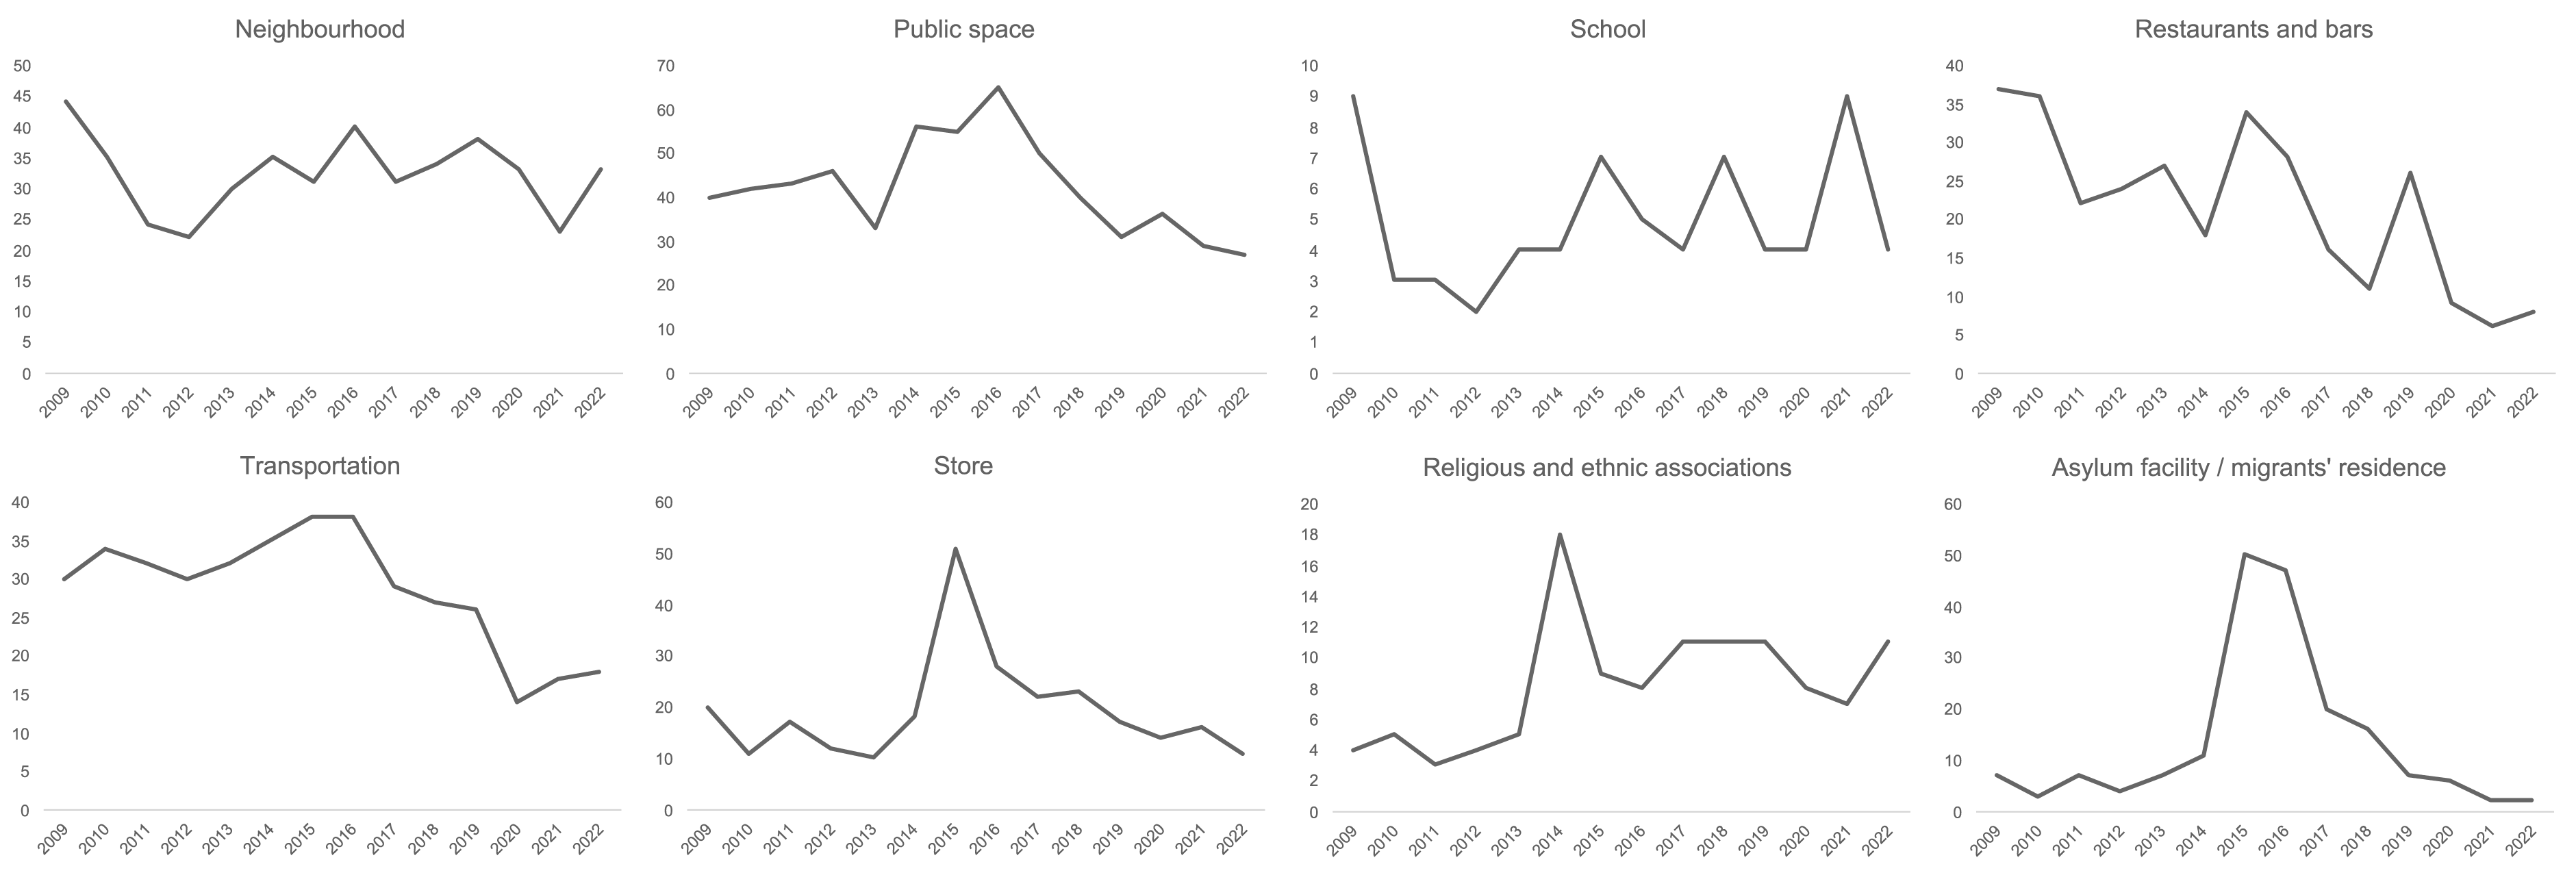
Temporal patterns
Combining timing with location type reveals distinct rhythms: mornings see incidents near homes and transport, midday in shops and public areas, evenings around residential zones and nightlife settings, and nights split between bar altercations and attacks on asylum and migrant accommodation. Just as violence moved out of restaurants, bars, and public transport, we observe an over-time decline of violence occurring at night (Figure 5) and on weekends (not shown). In relative terms, xenophobic violence appears to have become more closely tied to everyday routines. Crime time Day versus Night (Internal Proportion).
Short-term fluctuations
Weekly-level analysis (Figure 6) offers a finer view of short-term spikes. The late-2015 wave peaked in the two weeks following the Paris terrorist attacks (November 13, 2015), while the most violent week of 2017 occurred immediately after the Stockholm truck attack (April 7). While the data cannot establish causality, these temporal clusters suggest that external political or media shocks may trigger surges in xenophobic violence. Number of xenophobic hate-crime-flagged police reports per week.
Victims and perpetrators
Victims and perpetrators were coded at both collective and individual levels. Victim variables include gender and age group; perpetrator variables capture gender, age group, and group size. Detailed age data were available only for 2009–2012 and 2020–2022 due to changes in police reporting practices.
Victims
69% of victims are men, 28% are women, and 3% are mixed-gender groups. Women’s share has increased slightly as men’s has declined (Figure 7). Men are disproportionately targets of the most severe offences (aggravated assault, arson, and homicide). Women are more often victimised near homes or shops while male victims are concentrated in nightlife settings. Gender of victim(s), percent.
Perpetrators
The perpetrator acted alone in 70 % of the cases. Groups of 2–3 accounted for 20%, and larger groups for less than 10%. Overall, collective violence has become less common over time. Within collective incidents, there has been a shift toward smaller groups (2–3 perpetrators) (Figure 8). Notably, the proportion between individual/collective incidents has remained mostly unchanged since 2017. Proportion of perpetrator group sizes, percent.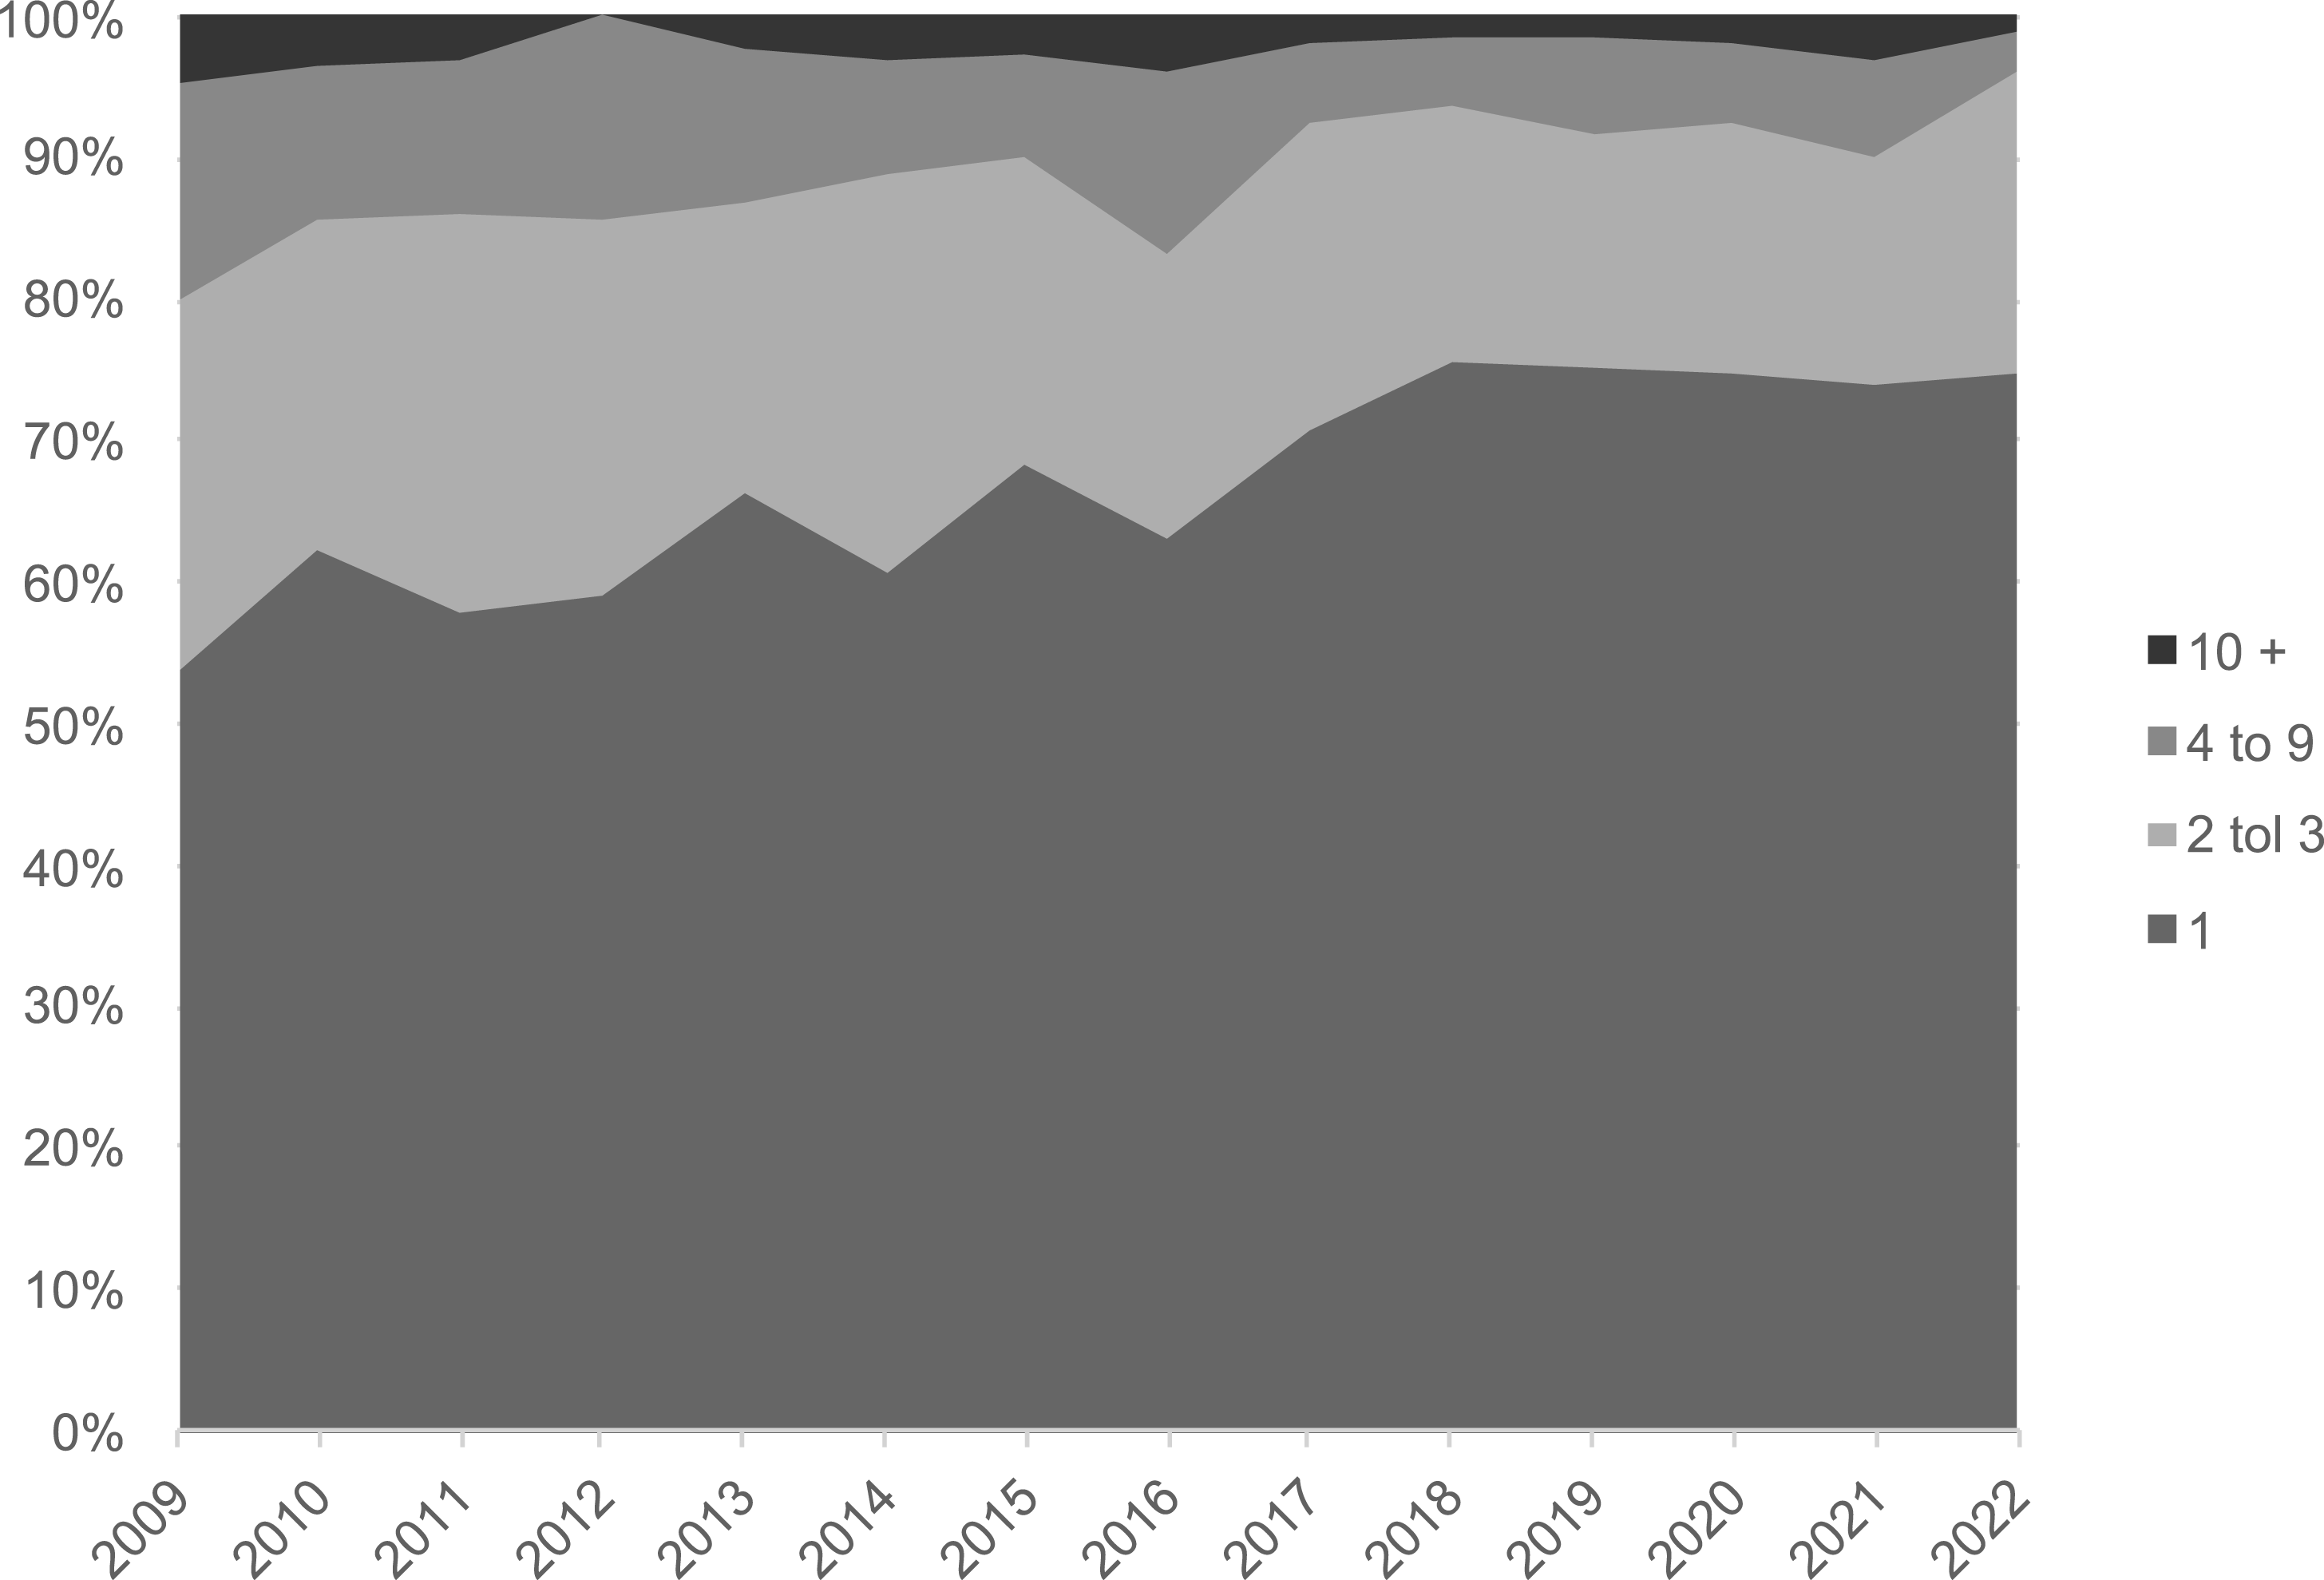
In 84% of cases with available data, perpetrators were male (22 % female), 1 a stable pattern over time. No female perpetrators appeared in homicide or attempted homicide cases, and very few in aggravated assaults or armed attacks. Women more often assaulted other women, typically in public transport or residential settings. Women’s violence peaked in the afternoon, whereas men’s incidents clustered in the evening and night.
Among the 360 perpetrators with recorded ages, the mean age was 36 years, rising from 32 (2009–2012) to 42 (2020–2022). While younger perpetrators (under 35) still constitute the majority, the age distribution is flatter than in violent crime generally. Older individuals (55+) represent 8–19% of perpetrators – an unusually high proportion compared to general assault statistics.
Research applications and future use
The database offers a unique empirical foundation for future research on xenophobic violence in Sweden and beyond. By systematically capturing police-reported, hate-flagged violent incidents over more than a decade, it enables analyses that move beyond anecdotal cases or media-driven samples toward long-term, systematic patterns.
The analyses of offence categories, motivations, contexts, victims, perpetrators, and types of violence indicate a pattern that is both ordinary and exceptional. Most incidents are spontaneous, low-intensity assaults in everyday settings, typically enacted by individual male perpetrators. Yet, the data also capture episodic surges of violence, coinciding with political tensions or heightened media attention. Over time, however, xenophobic violence has become more dispersed, less group-based, and increasingly integrated into everyday routines. These are, however, tentative patterns that warrant further exploration.
Several research applications stand out. First, the dataset allows analysis of temporal dynamics, including how violence responds to political events, media framing, or broader societal shocks. The observed surges during the 2015–2016 refugee reception crisis and following major terrorist attacks invite causal investigation: to what extent do xenophobic discourse, media coverage, or political mobilisations translate into increased everyday violence?
Second, the database enables detailed studies of offender and victim profiles, challenging stereotypes of xenophobic violence as primarily youth- or subculture-driven. The observed ageing of perpetrators, the decline in group assaults, and the rise of lone perpetrators open avenues for comparative research on the evolving social bases of hate-motivated violence.
Third, the coding of offence types, weapons, and contexts supports investigations into the micro-dynamics of violence, for example, how improvisation and planning interact in hate-motivated attacks, or how spatial patterns relate to residential segregation.
Fourth, the dataset can be linked to external sources. Owing to the enhanced transparency of the data, researchers can more easily compare and triangulate results with general crime statistics, victim survey data, and media- or third-party sources.
Finally, the dataset can inform preventive strategies – from local policing and community interventions to national monitoring frameworks. It also enables evaluation of whether changes in policing practices, reporting procedures, or political climates influence the visibility of such violence in official statistics.
In sum, the dataset is not merely a descriptive resource but a platform for theory-driven inquiry into the drivers, dynamics, and consequences of xenophobic violence. Future studies could examine how the studied cases connect to broader processes of radicalisation, polarisation, and democratic resilience – bridging micro-level incidents with macro-level transformations in contemporary societies.
Supplemental Material
Supplemental Material - Xenophobic violence in Sweden 2009–2022: Introducing the dataset
Supplemental Material for Xenophobic violence in Sweden 2009–2022: Introducing the dataset by Anton Törnberg, Måns Lundstedt, Victoria Vallström, and Mattias Wahlström in Research & Politics
Footnotes
Funding
The authors disclosed receipt of the following financial support for the research, authorship, and/or publication of this article: This work was supported by The Swedish Research Council; 2022-05487.
Declaration of conflicting interests
The authors declared no potential conflicts of interest with respect to the research, authorship, and/or publication of this article.
Carnegie corporation of New York grant
This publication was made possible (in part) by a grant from the Carnegie Corporation of New York. The statements made and views expressed are solely the responsibility of the authors.
Supplemental material
Note
Appendix
Summary of exclusion criteria. Overview of variables in the xenophobic violence dataset. Detailed descriptions of each of the variables are available in the codebook.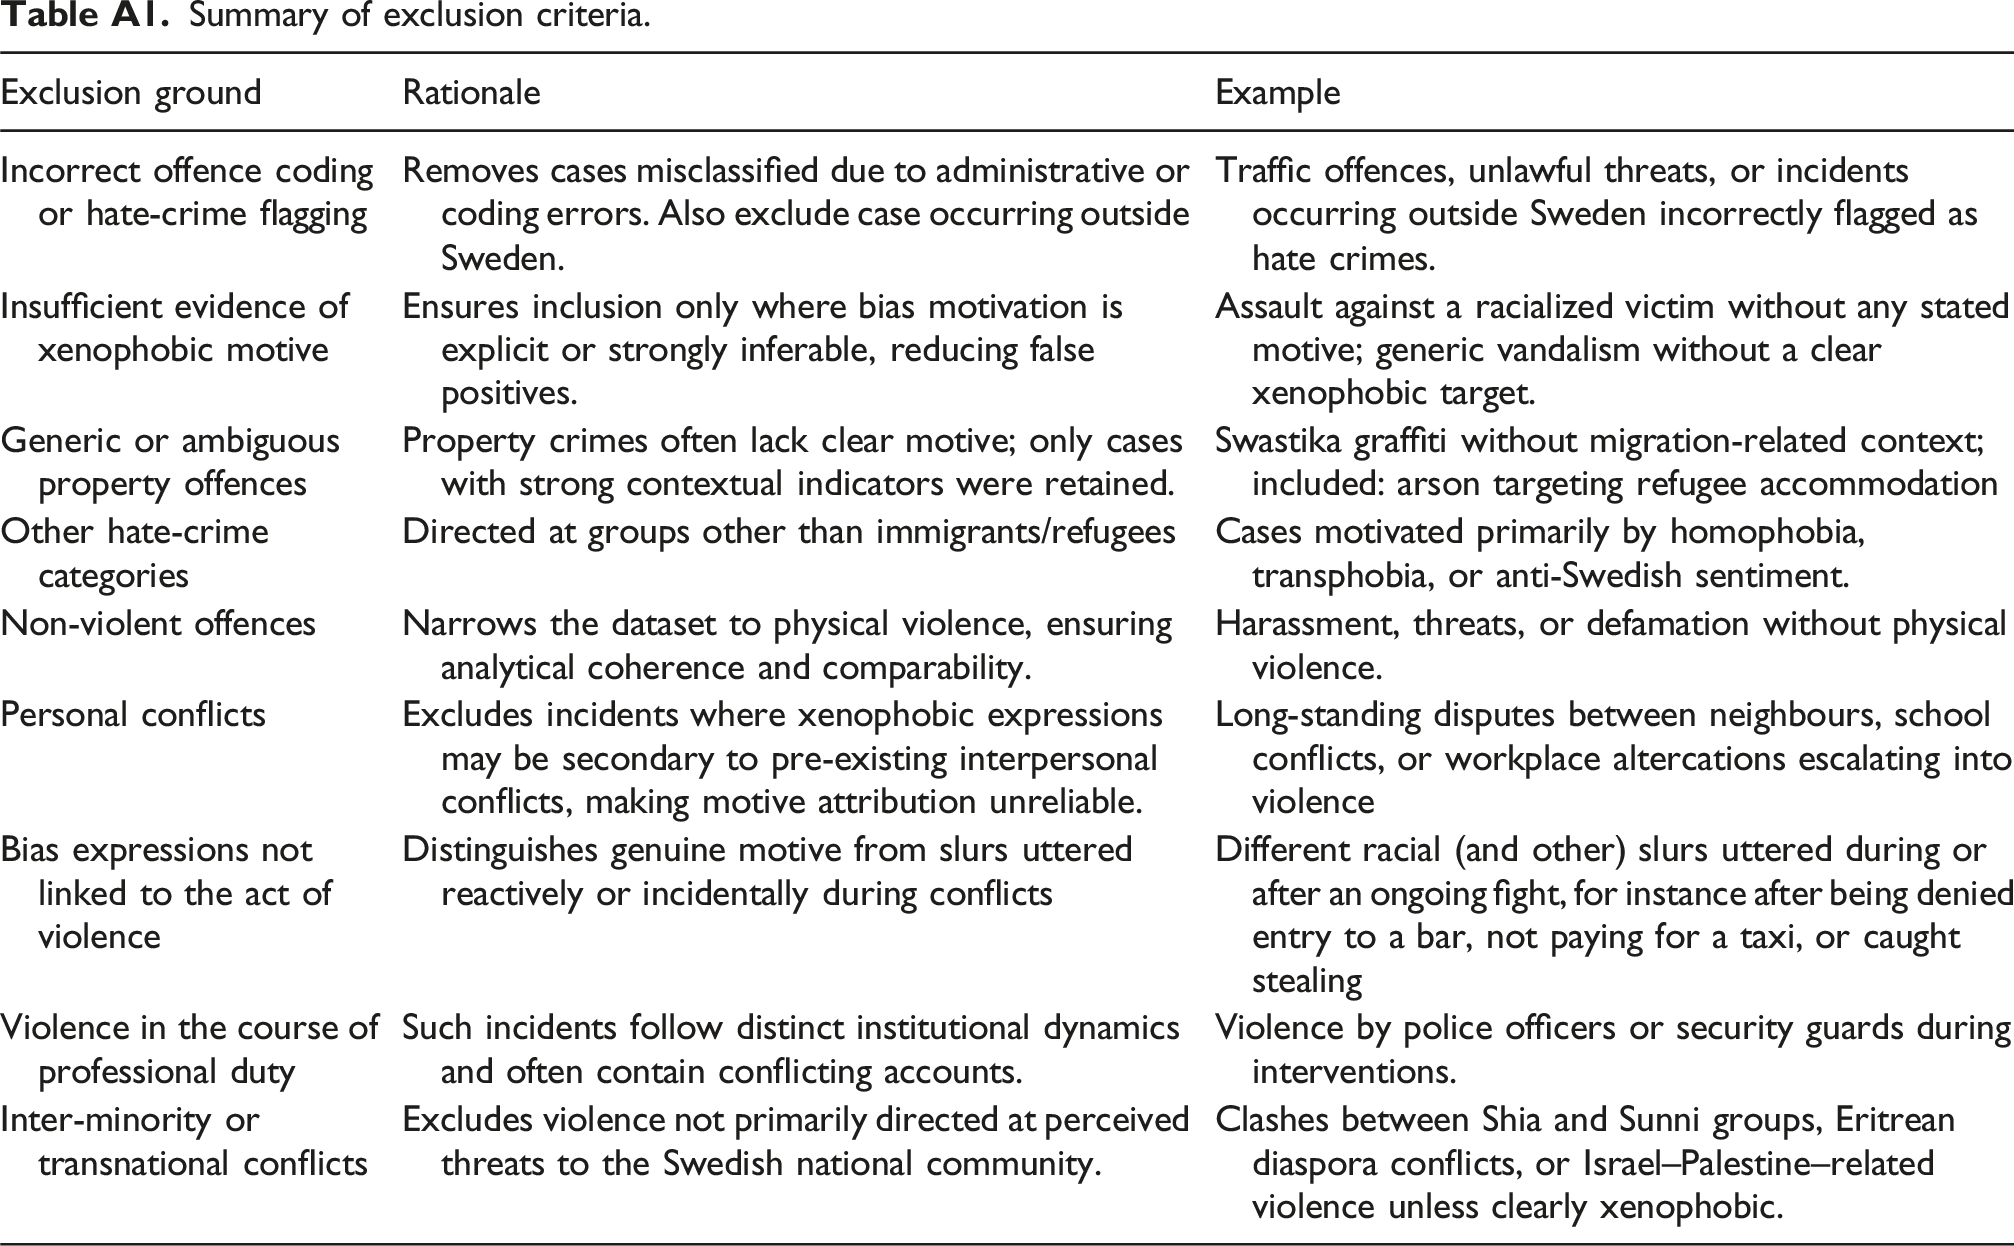
Exclusion ground
Rationale
Example
Incorrect offence coding or hate-crime flagging
Removes cases misclassified due to administrative or coding errors. Also exclude case occurring outside Sweden.
Traffic offences, unlawful threats, or incidents occurring outside Sweden incorrectly flagged as hate crimes.
Insufficient evidence of xenophobic motive
Ensures inclusion only where bias motivation is explicit or strongly inferable, reducing false positives.
Assault against a racialized victim without any stated motive; generic vandalism without a clear xenophobic target.
Generic or ambiguous property offences
Property crimes often lack clear motive; only cases with strong contextual indicators were retained.
Swastika graffiti without migration-related context; included: arson targeting refugee accommodation
Other hate-crime categories
Directed at groups other than immigrants/refugees
Cases motivated primarily by homophobia, transphobia, or anti-Swedish sentiment.
Non-violent offences
Narrows the dataset to physical violence, ensuring analytical coherence and comparability.
Harassment, threats, or defamation without physical violence.
Personal conflicts
Excludes incidents where xenophobic expressions may be secondary to pre-existing interpersonal conflicts, making motive attribution unreliable.
Long-standing disputes between neighbours, school conflicts, or workplace altercations escalating into violence
Bias expressions not linked to the act of violence
Distinguishes genuine motive from slurs uttered reactively or incidentally during conflicts
Different racial (and other) slurs uttered during or after an ongoing fight, for instance after being denied entry to a bar, not paying for a taxi, or caught stealing
Violence in the course of professional duty
Such incidents follow distinct institutional dynamics and often contain conflicting accounts.
Violence by police officers or security guards during interventions.
Inter-minority or transnational conflicts
Excludes violence not primarily directed at perceived threats to the Swedish national community.
Clashes between Shia and Sunni groups, Eritrean diaspora conflicts, or Israel–Palestine–related violence unless clearly xenophobic.
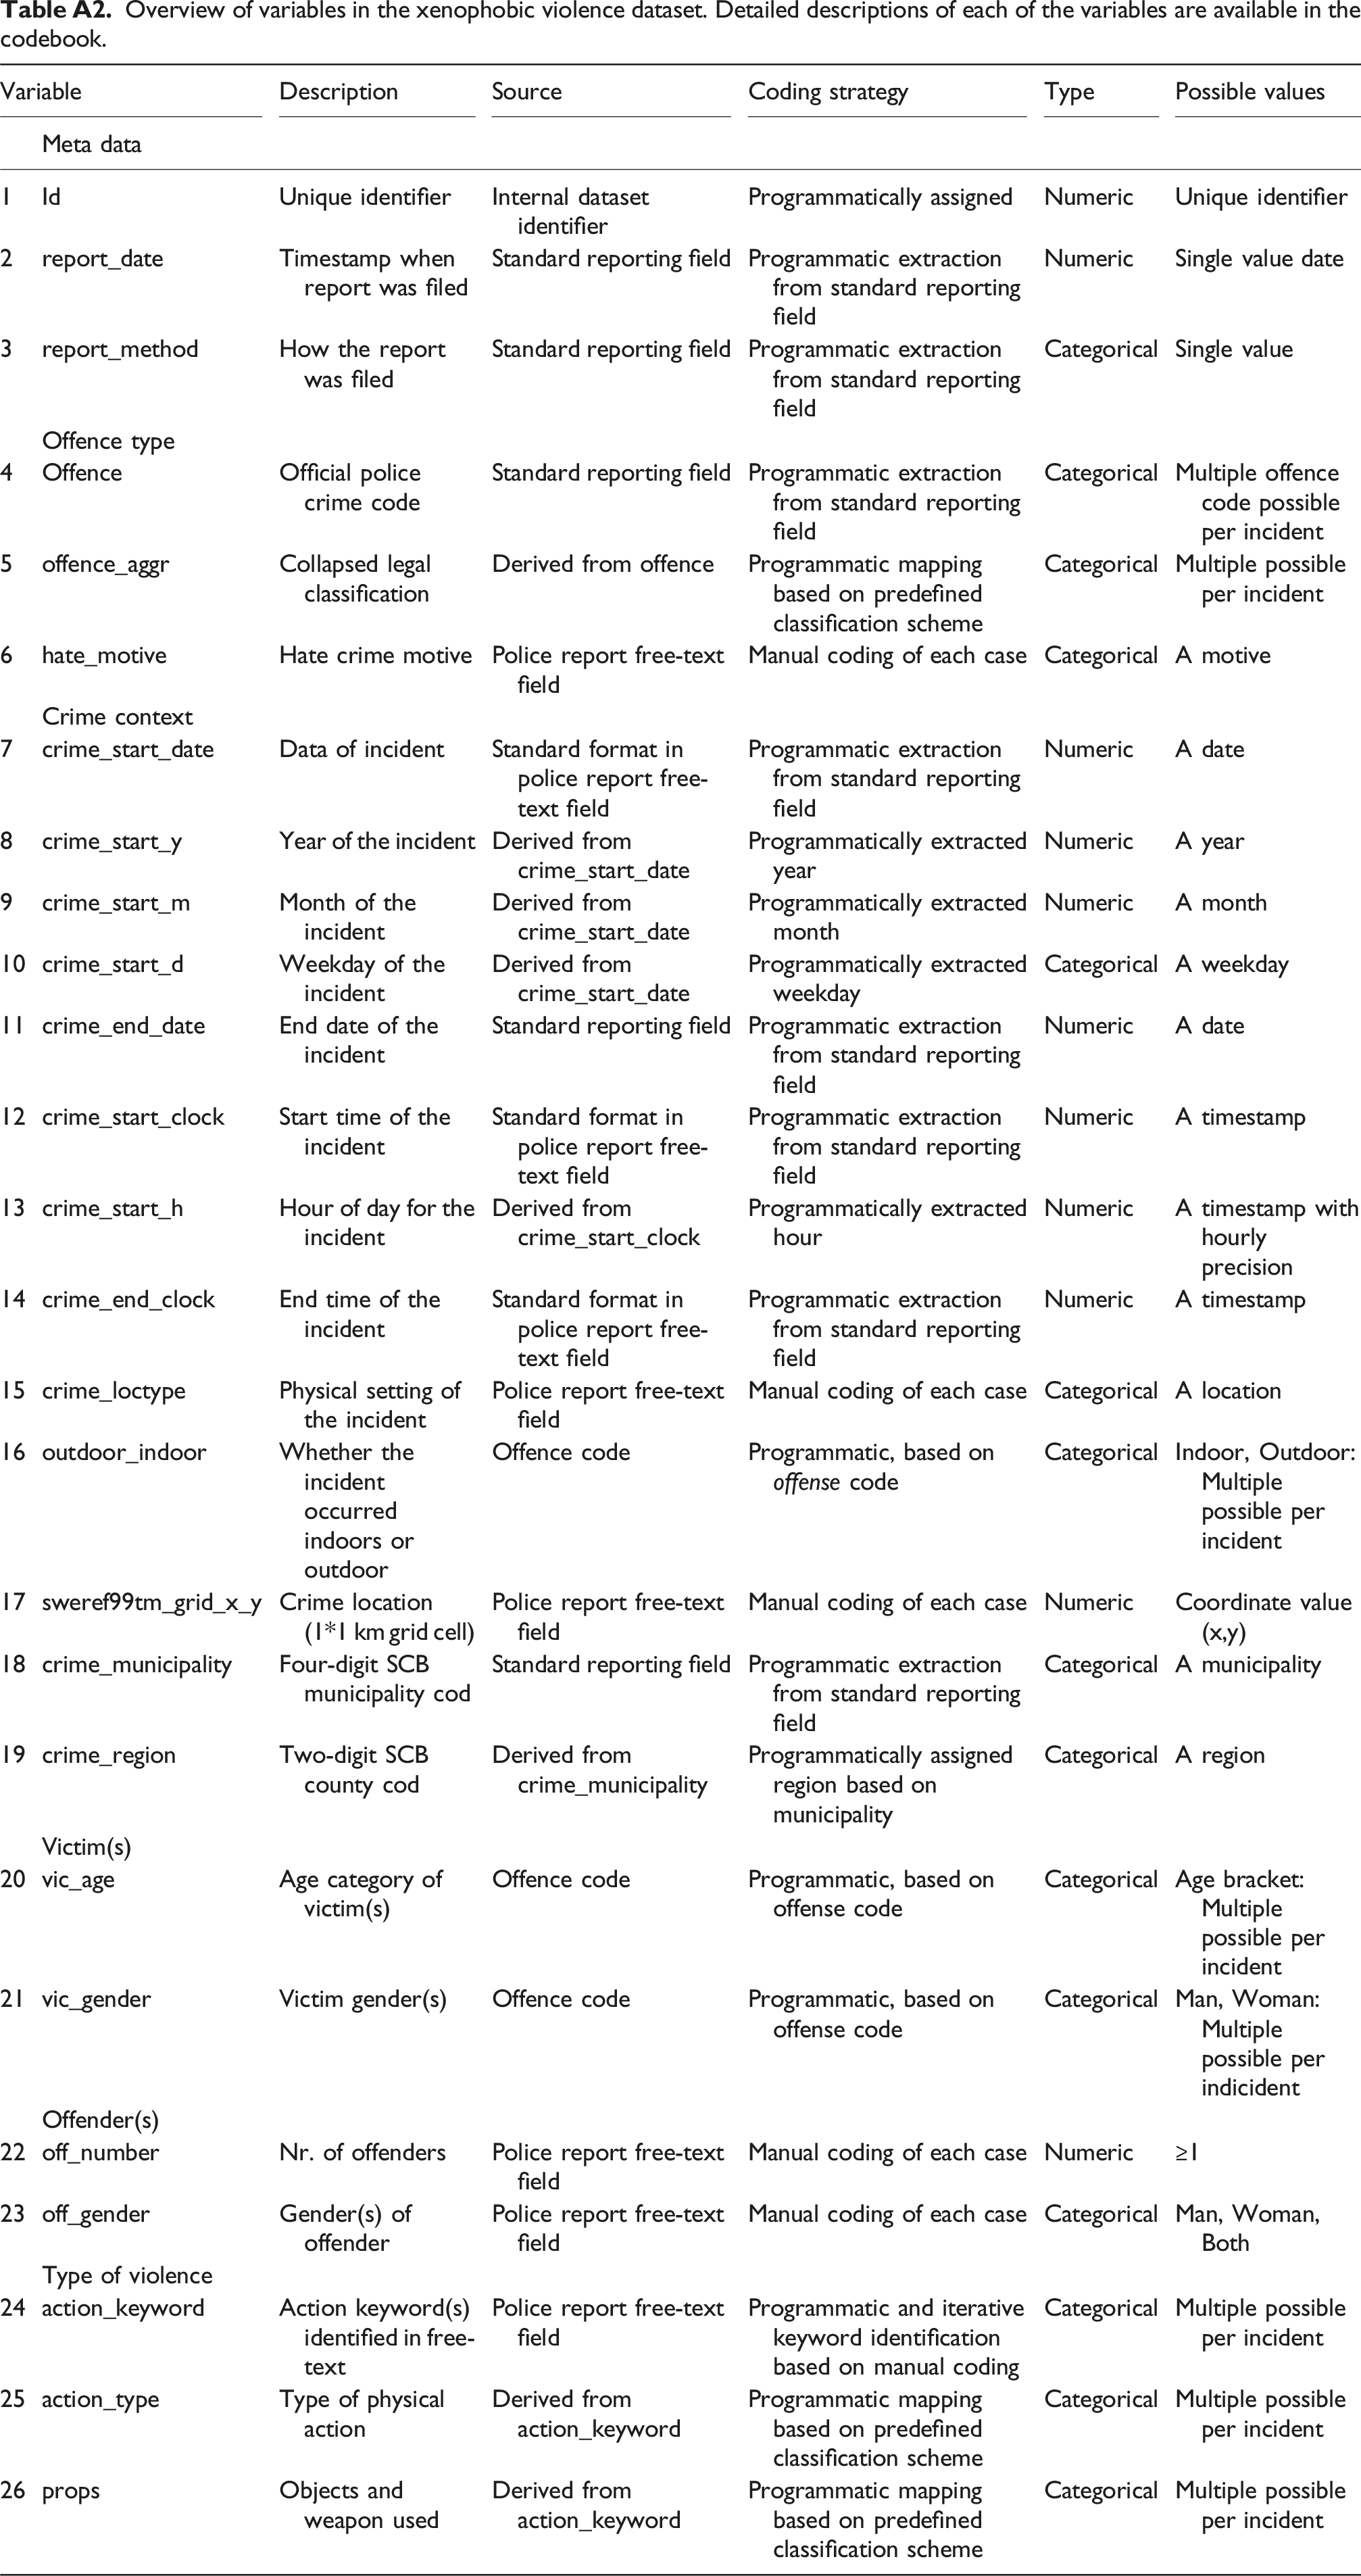
Variable
Description
Source
Coding strategy
Type
Possible values
Meta data
1
Id
Unique identifier
Internal dataset identifier
Programmatically assigned
Numeric
Unique identifier
2
report_date
Timestamp when report was filed
Standard reporting field
Programmatic extraction from standard reporting field
Numeric
Single value date
3
report_method
How the report was filed
Standard reporting field
Programmatic extraction from standard reporting field
Categorical
Single value
Offence type
4
Offence
Official police crime code
Standard reporting field
Programmatic extraction from standard reporting field
Categorical
Multiple offence code possible per incident
5
offence_aggr
Collapsed legal classification
Derived from offence
Programmatic mapping based on predefined classification scheme
Categorical
Multiple possible per incident
6
hate_motive
Hate crime motive
Police report free-text field
Manual coding of each case
Categorical
A motive
Crime context
7
crime_start_date
Data of incident
Standard format in police report free-text field
Programmatic extraction from standard reporting field
Numeric
A date
8
crime_start_y
Year of the incident
Derived from crime_start_date
Programmatically extracted year
Numeric
A year
9
crime_start_m
Month of the incident
Derived from crime_start_date
Programmatically extracted month
Numeric
A month
10
crime_start_d
Weekday of the incident
Derived from crime_start_date
Programmatically extracted weekday
Categorical
A weekday
11
crime_end_date
End date of the incident
Standard reporting field
Programmatic extraction from standard reporting field
Numeric
A date
12
crime_start_clock
Start time of the incident
Standard format in police report free-text field
Programmatic extraction from standard reporting field
Numeric
A timestamp
13
crime_start_h
Hour of day for the incident
Derived from crime_start_clock
Programmatically extracted hour
Numeric
A timestamp with hourly precision
14
crime_end_clock
End time of the incident
Standard format in police report free-text field
Programmatic extraction from standard reporting field
Numeric
A timestamp
15
crime_loctype
Physical setting of the incident
Police report free-text field
Manual coding of each case
Categorical
A location
16
outdoor_indoor
Whether the incident occurred indoors or outdoor
Offence code
Programmatic, based on offense code
Categorical
Indoor, Outdoor: Multiple possible per incident
17
sweref99tm_grid_x_y
Crime location (1*1 km grid cell)
Police report free-text field
Manual coding of each case
Numeric
Coordinate value (x,y)
18
crime_municipality
Four-digit SCB municipality cod
Standard reporting field
Programmatic extraction from standard reporting field
Categorical
A municipality
19
crime_region
Two-digit SCB county cod
Derived from crime_municipality
Programmatically assigned region based on municipality
Categorical
A region
Victim(s)
20
vic_age
Age category of victim(s)
Offence code
Programmatic, based on offense code
Categorical
Age bracket: Multiple possible per incident
21
vic_gender
Victim gender(s)
Offence code
Programmatic, based on offense code
Categorical
Man, Woman: Multiple possible per indicident
Offender(s)
22
off_number
Nr. of offenders
Police report free-text field
Manual coding of each case
Numeric
≥1
23
off_gender
Gender(s) of offender
Police report free-text field
Manual coding of each case
Categorical
Man, Woman, Both
Type of violence
24
action_keyword
Action keyword(s) identified in free-text
Police report free-text field
Programmatic and iterative keyword identification based on manual coding
Categorical
Multiple possible per incident
25
action_type
Type of physical action
Derived from action_keyword
Programmatic mapping based on predefined classification scheme
Categorical
Multiple possible per incident
26
props
Objects and weapon used
Derived from action_keyword
Programmatic mapping based on predefined classification scheme
Categorical
Multiple possible per incident
References
Supplementary Material
Please find the following supplemental material available below.
For Open Access articles published under a Creative Commons License, all supplemental material carries the same license as the article it is associated with.
For non-Open Access articles published, all supplemental material carries a non-exclusive license, and permission requests for re-use of supplemental material or any part of supplemental material shall be sent directly to the copyright owner as specified in the copyright notice associated with the article.