
Abstract
A recurring obstacle to scholarly inquiry into conflict is the lack of access to reliable data. The advent of innovative technologies and methods for remote data collection may alleviate this issue. This article introduces open-source satellite-gathered fire data as a tool for detecting unreported conflict events, and for improving the reliability of pre-existing conflict event data. To demonstrate this potential, I compare the distribution of fire data to conflict events in five oblasts in southeastern Ukraine and find that fire data can be a spatiotemporally accurate proxy for conventional warfare involving heavy use of artillery and aerial bombing. Examining the 2020–2022 Tigray War, I also demonstrate that fire data can be a powerful tool for uncovering unreported targeted violence involving arson in low information environments. Finally, I argue that fire data opens the door for new research by allowing conflict scholars to address data gaps and data reliability issues.
The collection of reliable conflict data is often a difficult, if not an impossible task due to constraints of time, resources, and safety. The most widely used conflict event datasets tackle these challenges by using news reports as their source material. This has been essential to progress in peace and conflict studies, having allowed scholars to study conflict trends globally and locally (Gleditsch et al., 2014). Yet, an inherent risk to this is that data quality may be affected by reporting bias, impreciseness, or omissions by news bureaus whose priorities differ from that of conflict scholars (Dietrich and Eck, 2020; Donnay et al., 2019; Price and Ball, 2014). Data quality issues may be addressed by diversifying the source material, for example, through field work, but this is not always possible due to costs or safety, and can be unfeasible when dealing with more than a few cases (Croicu and Eck, 2022: 1045; Dawkins, 2021). Remote sensing technology offers a solution to this by enabling scholars to collect near-real time data on a large number of cases from a safe distance.
This article introduces satellite-gathered fire data as a promising resource for the study of conflict. Fire is a common byproduct of acts of organised violence such as artillery shelling, aerial bombing, or arson, and creates emissions which satellite sensors can capture as datapoints. These datapoints can serve as highly reliable estimates for the time and location of conflict events, and their validity can be determined through circumstantial evidence and remote sensing technologies. First, to demonstrate fire data’s potential to verify and improve conflict data reliability, I investigate the relationship between fire detections and ACLED-events in five Ukrainian Oblasts during the initial months of Russia’s invasion on 24 February 2022. I find that fire data can be an accurate proxy for conflict events and can significantly improve upon the geospatial accuracy of centroid-based data to facilitate research at both the micro- and meso-levels. Second, to illustrate fire data’s utility in uncovering unreported conflict events in low information contexts, I survey fire detections during the first three months of the Tigray War (2020–2022) using open source satellite images. Multiple unreported instances of structural destruction caused by arson and aerial bombing are found using method, demonstrating its utility for addressing data gaps. I conclude that fire data has value as a low-cost means for cross-verification, geolocation, detection, and documentation which should supplement, not replace, news-based data.
Assumptions and hypotheses
Fire data refers, for the purposes of this article, to thermal anomalies detected by satellite sensors such as the Visible Infrared Imaging Radiometer Suite (VIIRS) aboard the joint NASA/NOAA Suomi National Polar-orbiting satellites Suomi NPP, and NOAA-20 (Schroeder et al., 2014). Fire has been a used as a tool of war since time immemorial to instill fear, as a form of collective punishment, and to displace target communities by destroying homes, crops, and supplies. It is also a recurring feature of modern warfare involving the use of artillery, aerial bombing, thermobaric weapons, and armoured fighting vehicles. When buildings and vegetation are set on fire, ammunition depots cook off, or gas tanks ignite, the resulting heat, smoke, and light may be captured by sensors such as VIIRS. 1 For example, during the Tigray War, reports emerged that Shimelba refugee camp in Tigray had been torched by Eritrean troops (Zelalem, 2021). These fires were captured by VIIRS, and the destruction was documented through satellite images. 2 VIIRS has also been used outside of academia to geolocate conflict events through machine learning (The Economist, 2024). Fire data, therefore, has the potential to both uncover meso-level patterns of war, as well as micro-level incidents of violence.
To investigate its utility in uncovering patterns of violence in conventional wars, I hypothesise that fire data can be an effective resource for monitoring frontlines which see the widespread use of artillery and aerial bombing, such as the Ukraine war. Conversely, its utility in monitoring frontlines will be lower when conflict actors do not use such weapons.
Conflict event data is prone to spatiotemporal “fuzziness” due to impreciseness in the source material or as an artefact of the coding process such as the geolocation of events by centroids (Dietrich and Eck, 2020). Approximations can be adequate for some research purposes, but others require high levels of geospatial accuracy, for example, to assess whether hospitals, schools, or specific communities have been targeted. Fire data can enable such research by providing more precise spatiotemporal information on conflict events.
Another use case for fire data is that it may be used to uncover violence in low information contexts. Reporting bias such as media outlets’ tendency to fixate on certain countries, urban areas and big events may, therefore, skew scholarly inferences about conflict patterns through non-random missingness in conflict data (Eck, 2012; Price and Ball, 2014). Fire data, in combination with satellite images, provides a low-cost means to investigate whether news-based data accurately represents the local landscape of violence by investigating whether incidents of collective violence have gone unreported. I, therefore, hypothesise that:
Research design
VIIRS is a whisk broom radiometer which since its first launch in 2011 has collected observations which span visible and infrared wavelengths across 22 wavelengths with spatial resolutions of 375 to 750 m, achieving global coverage twice a day (Justice et al., 2013). 3 It gathers information across a range of indicators, including light, heat, and aerosol products which are assessed through a contextual algorithm, the technicalities of which are elaborated by Schroeder et al. (2014). The resulting datapoints are accessible through NASA’s Fire Information for Resource Management System (FIRMS) as 375 m rasters or coordinate points. 4 VIIRS data is near-real time, spatially precise, and free for academic use. While it is typically used in climate and environmental research, it can also be used to monitor human activity associated with some forms of violence. 5
The utility of fire data for the study of conflict must, as with any empirical material, be assessed on a case-by-case basis. This involves, first, determining whether conflict actors are using methods such as arson or artillery which would be captured by VIIRS. This can be established through news reports, footage from social media, local contacts etc. 6 Second, it depends on how conspicuous the fire patterns are. Fires can start for any range of non-conflict-related reasons, and addressing false positives is essential. This can involve controlling for the seasonal and spatial distribution of fires to exclude, for example, areas prone to wildfires, or factories whose heat signature is captured by VIIRS as a thermal anomaly. 7 Conversely, fire detections which occur in or near civilian neighbourhoods, hospitals, schools, or other sensitive infrastructure in an active conflict zone would be of high interest. Such circumstantial evidence can be strengthened, for example, by correlating fire detections to conflict data such as ACLED by date and location. 8 Studies involving large numbers of fire detections must, therefore, involve a probabilistic assessment to distinguish true and false positives. When dealing with few cases, it is possible to further investigate each detection through field work or gathering footage of events, including satellite images.
The war in Ukraine was selected to investigate hypothesis 1 because it has seen heavy use of artillery and aerial bombing and has received extensive news coverage. This to ensure that the measuring pole which fire data is compared to is of high quality. I rely on ACLED for this purpose, focussing on ‘Battles’, ‘Explosions/Remote Violence’, and ‘Violence Against Civilians’ (ACLED, 2023; Raleigh et al., 2023). 9 I limit the study’s spatiotemporal scope to 3 months and to five oblasts in Ukraine’s southeast to simplify the demonstration of fire data’s relationship to warfare by limiting noise. To determine the relationship between ACLED-events and fires, I compare their spatial distribution through density plots, K, L, and cross-K functions, and the pairwise correlation function. I conduct a nearest neighbour analysis to assess hypothesis 2 by matching fire detections to the closest ACLED-events which occurred on the same day and estimate the average distance between them to demonstrate fire data’s relationship to centroid-based data. To investigate hypothesis 3, I manually examine more than two thousand fire detections during the first 3 months of the Tigray war. Fire detections which occurred less than VIIRS’ error margin of 375 m from structures of any kind were then examined through Sentinel-2 satellite images to assess whether fire was associated with structural damage. 10 Sentinel-2 provides new images every 5 days, and fire damage was assessed by comparing the temporally closest image before and after a VIIRS-detection. 11 Instances where satellite images showed evidence of structural damage in conjunction with other circumstantial evidence were assessed as having a ‘high’ probability of being the product of acts of violence. 12 Thus, by investigating fire detections and assessing their impact through satellite images, it is possible to map out conflict events and hotspots even in low-information contexts.
Empirics
The Russian invasion of Ukraine reshaped conflict dynamics from stalemated trench warfare in the Donbas region to a war with moving frontlines (Figure 1). Figure 2 shows through density plots how this shift was captured by VIIRS and ACLED in the 3 months prior and after the invasion. The top right density plot shows that ACLED captures the frontline prior to the invasion as having an inverse U-shape. The pre-invasion fire pattern depicted by the plot to the top left, also displays an inverse U-shape which coincides spatially with the frontline.
13
The top left plot also illustrates fire data’s sensitivity to noise, as the cluster of fires in the west are likely unrelated to warfare, likely representing wildfire or agricultural fire. The covariance between fires and conflict events seems even stronger after the invasion. As shown in the bottom right plot, the frontline folded inwards, and this spatial shift in ACLED-events is matched by a similar spatial shift in VIIRS-events depicted by the bottom left plot which overlaps strongly with the ACLED pattern. ACLED (2023) events in Southeastern Ukraine. Density plots for ACLED (2023) events and VIIRS fire detections.

To further compare the spatial distribution of fire and conflict events, I perform a series of K-function and L-function tests on data after the invasion (Baddeley et al., 2015: 203). The positive and similar slopes of the resulting plots suggest that the clustering behaviour of ACLED-events and VIIRS-detections is comparable.
14
Figure 3 illustrates the pairwise correlation function and cross-K function. The pairwise correlation shows that the relative density of points, gI, is much higher than under complete randomness, suggesting clustering across the datasets especially at low distances. The cross-K plot also indicates that clustering across the two-point patterns is higher than would be the case under spatial randomness. The results support hypothesis 1 of a relationship between the spatial distribution of ACLED-events and VIIRS-detections. Pairwise correlation function and cross-K function.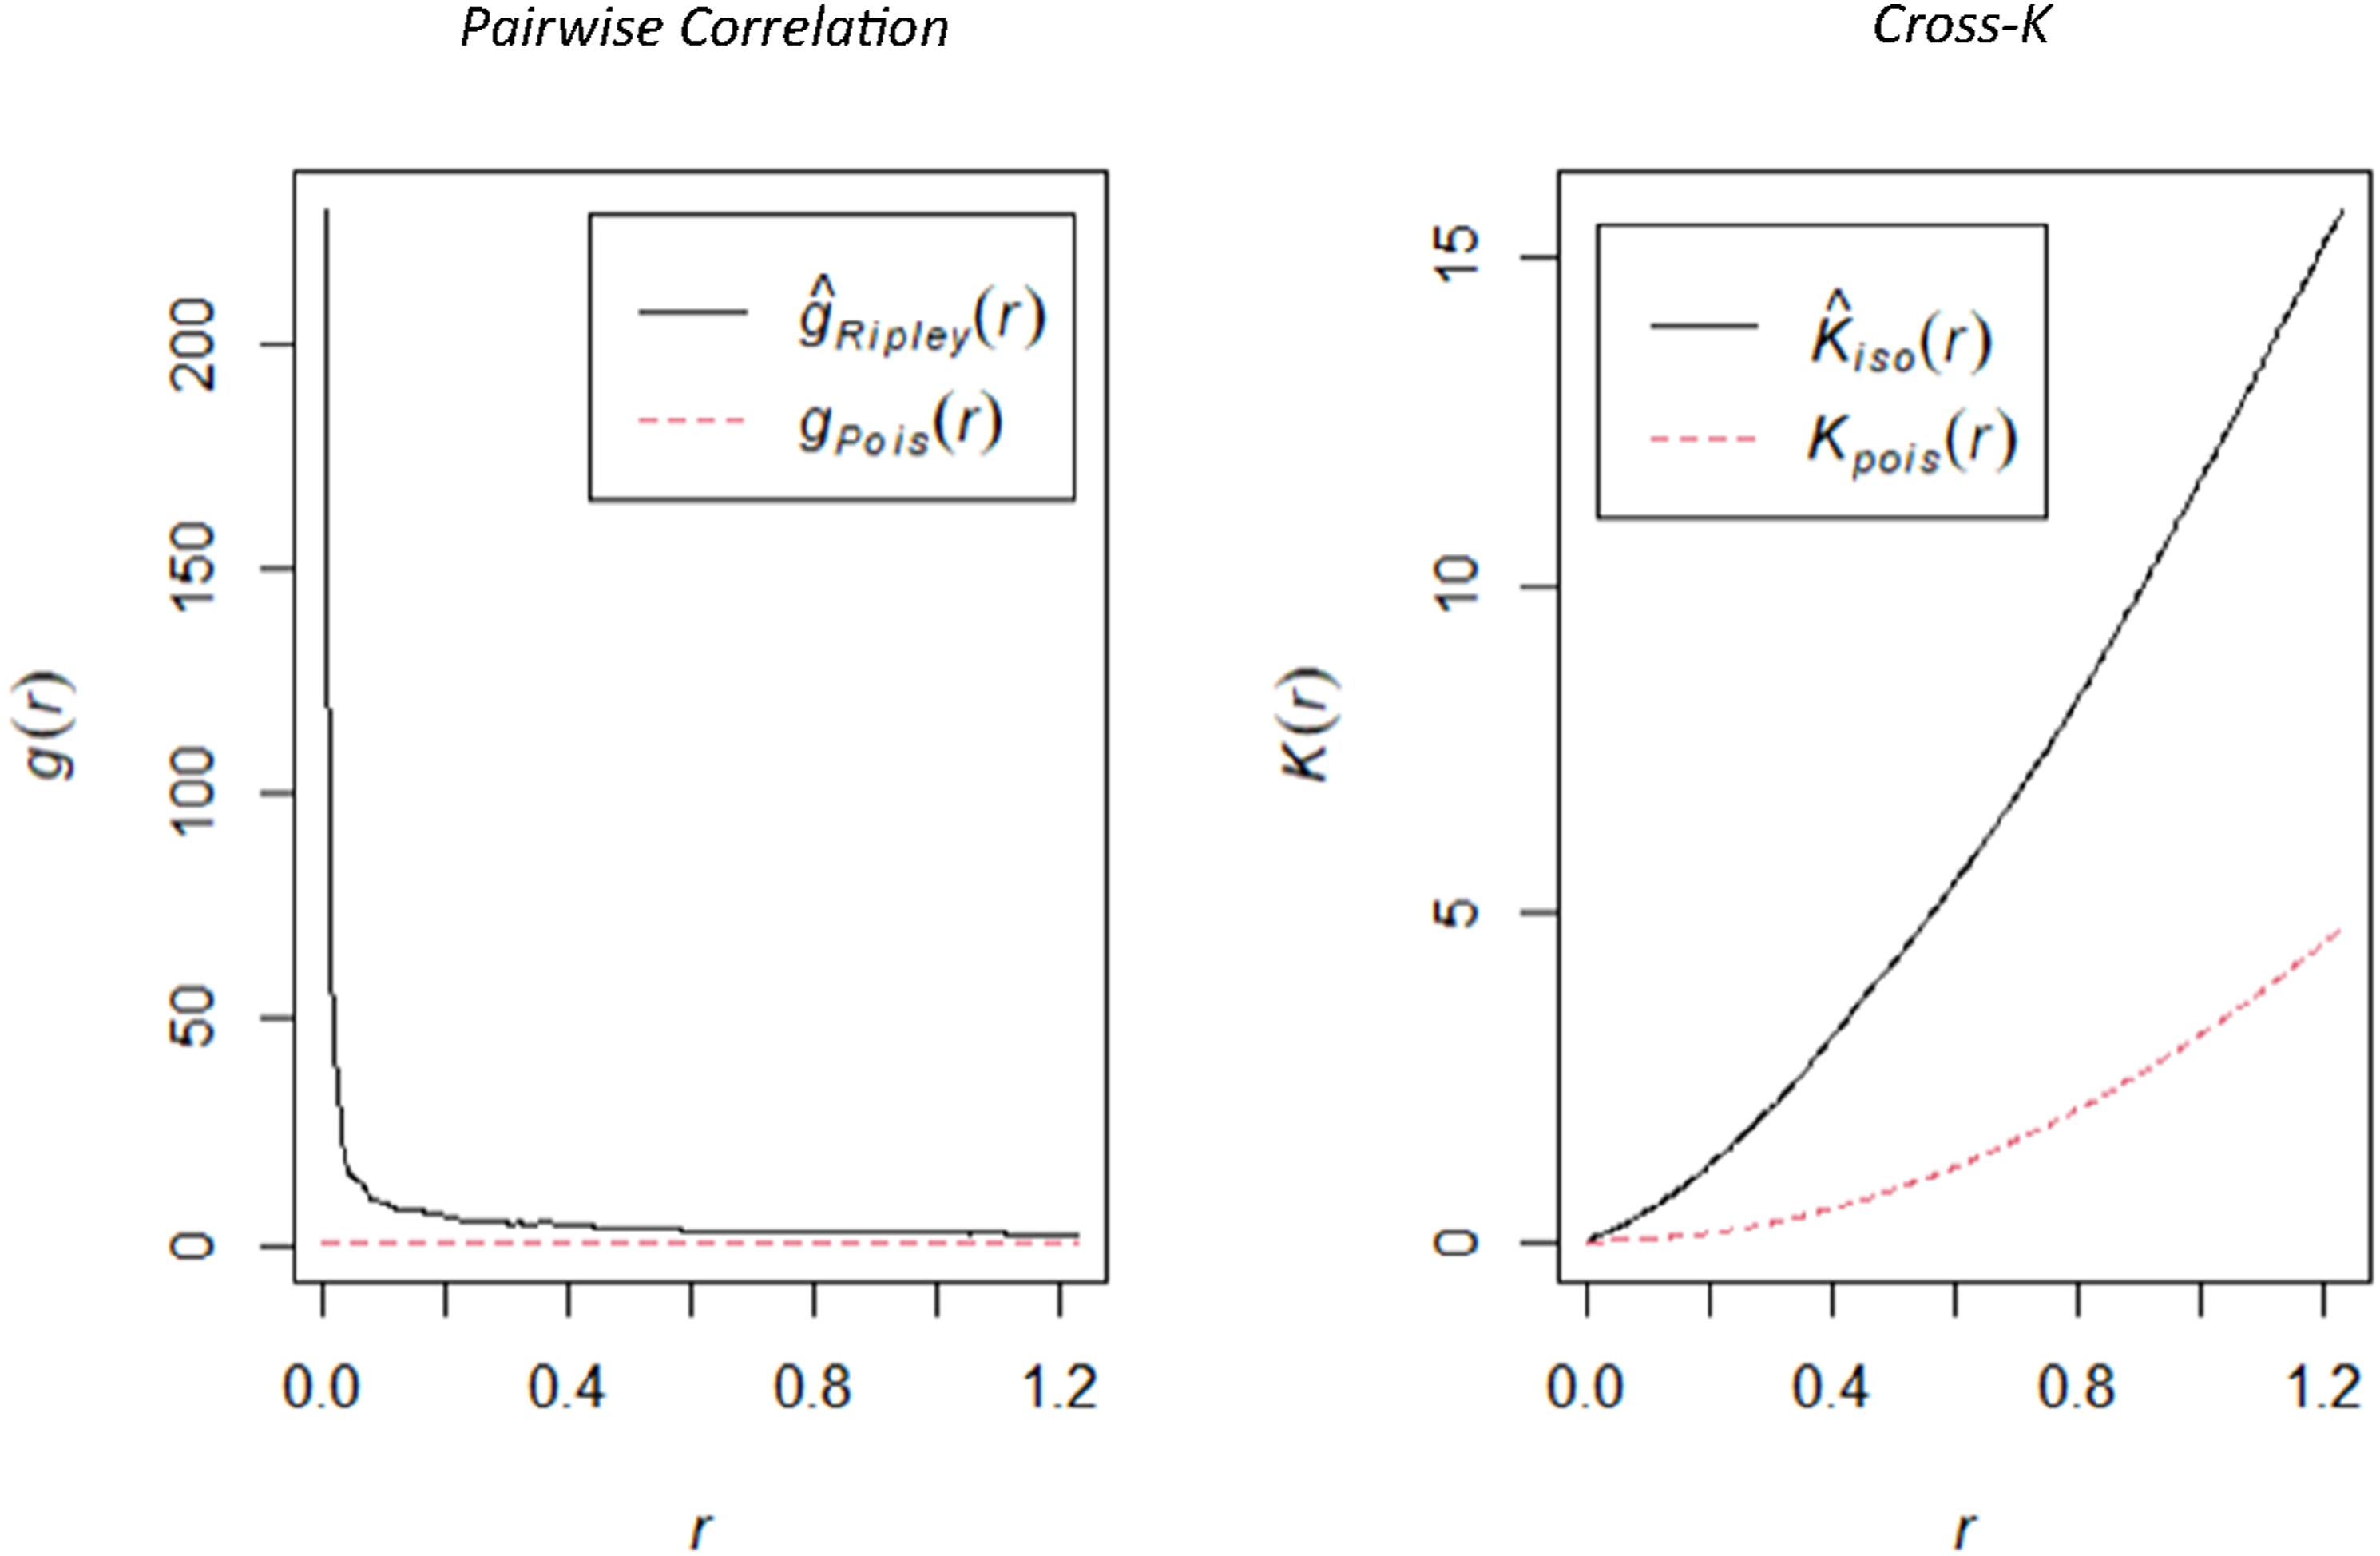
Conflict event data often geolocate events as centroids at the city or regional level (Donnay et al., 2019), and hypothesis 2 suggests that fire data can be matched to centroids to improve data reliability. To investigate this, I matched fire detections to ACLED-events which occurred on the same day and examined the distances between them.
15
Figure 4 shows that around 60% of fire detections occurred within a 5 km radius of a conflict event, while 92% occurred within 20 km. These distances and their significance for research will vary across different contexts but are highly promising when considering Figure 5 and the case of Kharkiv. The blue dot at the centre of Figure 6 represents 151 ACLED-observations which are stacked in the same exact location as an artefact of ACLED’s reliance on centroids to geolocate events. The red dots represent fire detections which are matched to ACLED-events by date, and their temporal co-occurrence makes the fire detection locations plausible candidates for where violence may have occurred. Importantly, even fire detections within 10 km and 20 km distances from ACLED centroids, which according to Figure 4 covers include 92% of fire detections, still occurred within the city of Kharkiv and were plausibly conflict related. The fact that detections as far away as 20 km remain relevant to conflict events in Kharkiv demonstrates that fire data may be used in conjunction with news-based data to provide highly accurate locations for conflict events. Distance between co-occurring (by date) VIIRS and ACLED (2023) events. Kharkiv ACLED (blue) and fires (red). Tigray 3. Nov 2020–1 Feb. 2021.


This level of geospatial accuracy can be of immense practical value, for example, to humanitarian organisations which seek to distribute aid efficiently or investigate targeted acts of violence, but also opens doors for new types of research. For example, there is a striking lack of studies on artillery and aerial bombing patterns against civilians despite the frequent use of terror bombing in modern warfare (Balcells, 2010). This research gap is likely explained by the difficulty of collecting data on impact locations. Fire data may, therefore, make it possible to investigate whether conflict actors systematically targeted specific neighbourhoods, or critical infrastructure such as universities, power plants and the electrical grid, and water silos. Fire data also makes it possible to move from conflict data using region-level centroids to determine whether some communities or settlements were targeted with violence, whereas others were not. This means that fire data also opens new avenues for micro-level research on the determinants of targeted violence in war. Fire data enables scholars to ask questions and investigate the logic of violence at the micro-level which would otherwise be difficult due to data constraints, and it also allows scholars to monitor meso-level patterns such as shifting frontlines.
Another use case for fire data is the detection of unreported conflicts events, of which there are many, even in high information environments such as Ukraine. 16 The Tigray war was far less extensively covered by news outlets than Ukraine, but it still is a hard case for fire data’s utility in detecting unreported events. First, because the war was most extensively covered during the initial months investigated here, and second because it was monitored by dedicated research teams (Every Casualty Counts, 2013). Nevertheless, I detected multiple instances where there is evidence of systematic torching of structures which went unreported. 17 This was done by manually examining fire detections which occurred within 375 m of structures through Sentinel-2 images and ranking them according to their probability of being conflict-related. Fire detections which led to structural damage which was clearly visible in satellite images were ranked as ‘high’ while detections where scorching affected structures but where image quality made assessment of the extent structural damage difficult were ranked as ‘mid’. 114 detections received the former classification, and 36 the latter, while the rest were excluded from the final analysis.
Figure 6 displays the results. It shows that fire data was not useful for monitoring the frontlines in Tigray, unlike Ukraine due to there being few confirmed positives in the southeast. This is, in line with hypothesis 1, likely due to the relatively sparse use of artillery, arson, and aerial bombing compared to Ukraine. However, Figure 7 supports hypothesis 3 on fire data’s added value because there are multiple previously unreported clusters of violent events in central and western Tigray, which are the areas in which Eritrean troops and Amharan militias operated (HRW, 2023). Furthermore, 82% of the ACLED-observations were geo-located as centroids at the regional-level, and only 17% at the town-level. This is not precise enough when investigating questions of ethnic cleansing and the collective punishment of civilian communities. Micro-level conflict research requires precise information on exactly which communities were targeted to uncover the logic of violence (Kalyvas, 2006). Fire data solves this problem by providing the date and location of possible conflict events with only a 375 m error margin. These locations can then be investigated through satellite images to determine the extent of damage in true positives, and to weed out false positives. While this does not reveal who the perpetrators or victims are, it provides an empirical basis of when and where violence occurred which can support further research on attribution and victimisation. Sentinel-2 images of structures at 14.08239, 39.55719.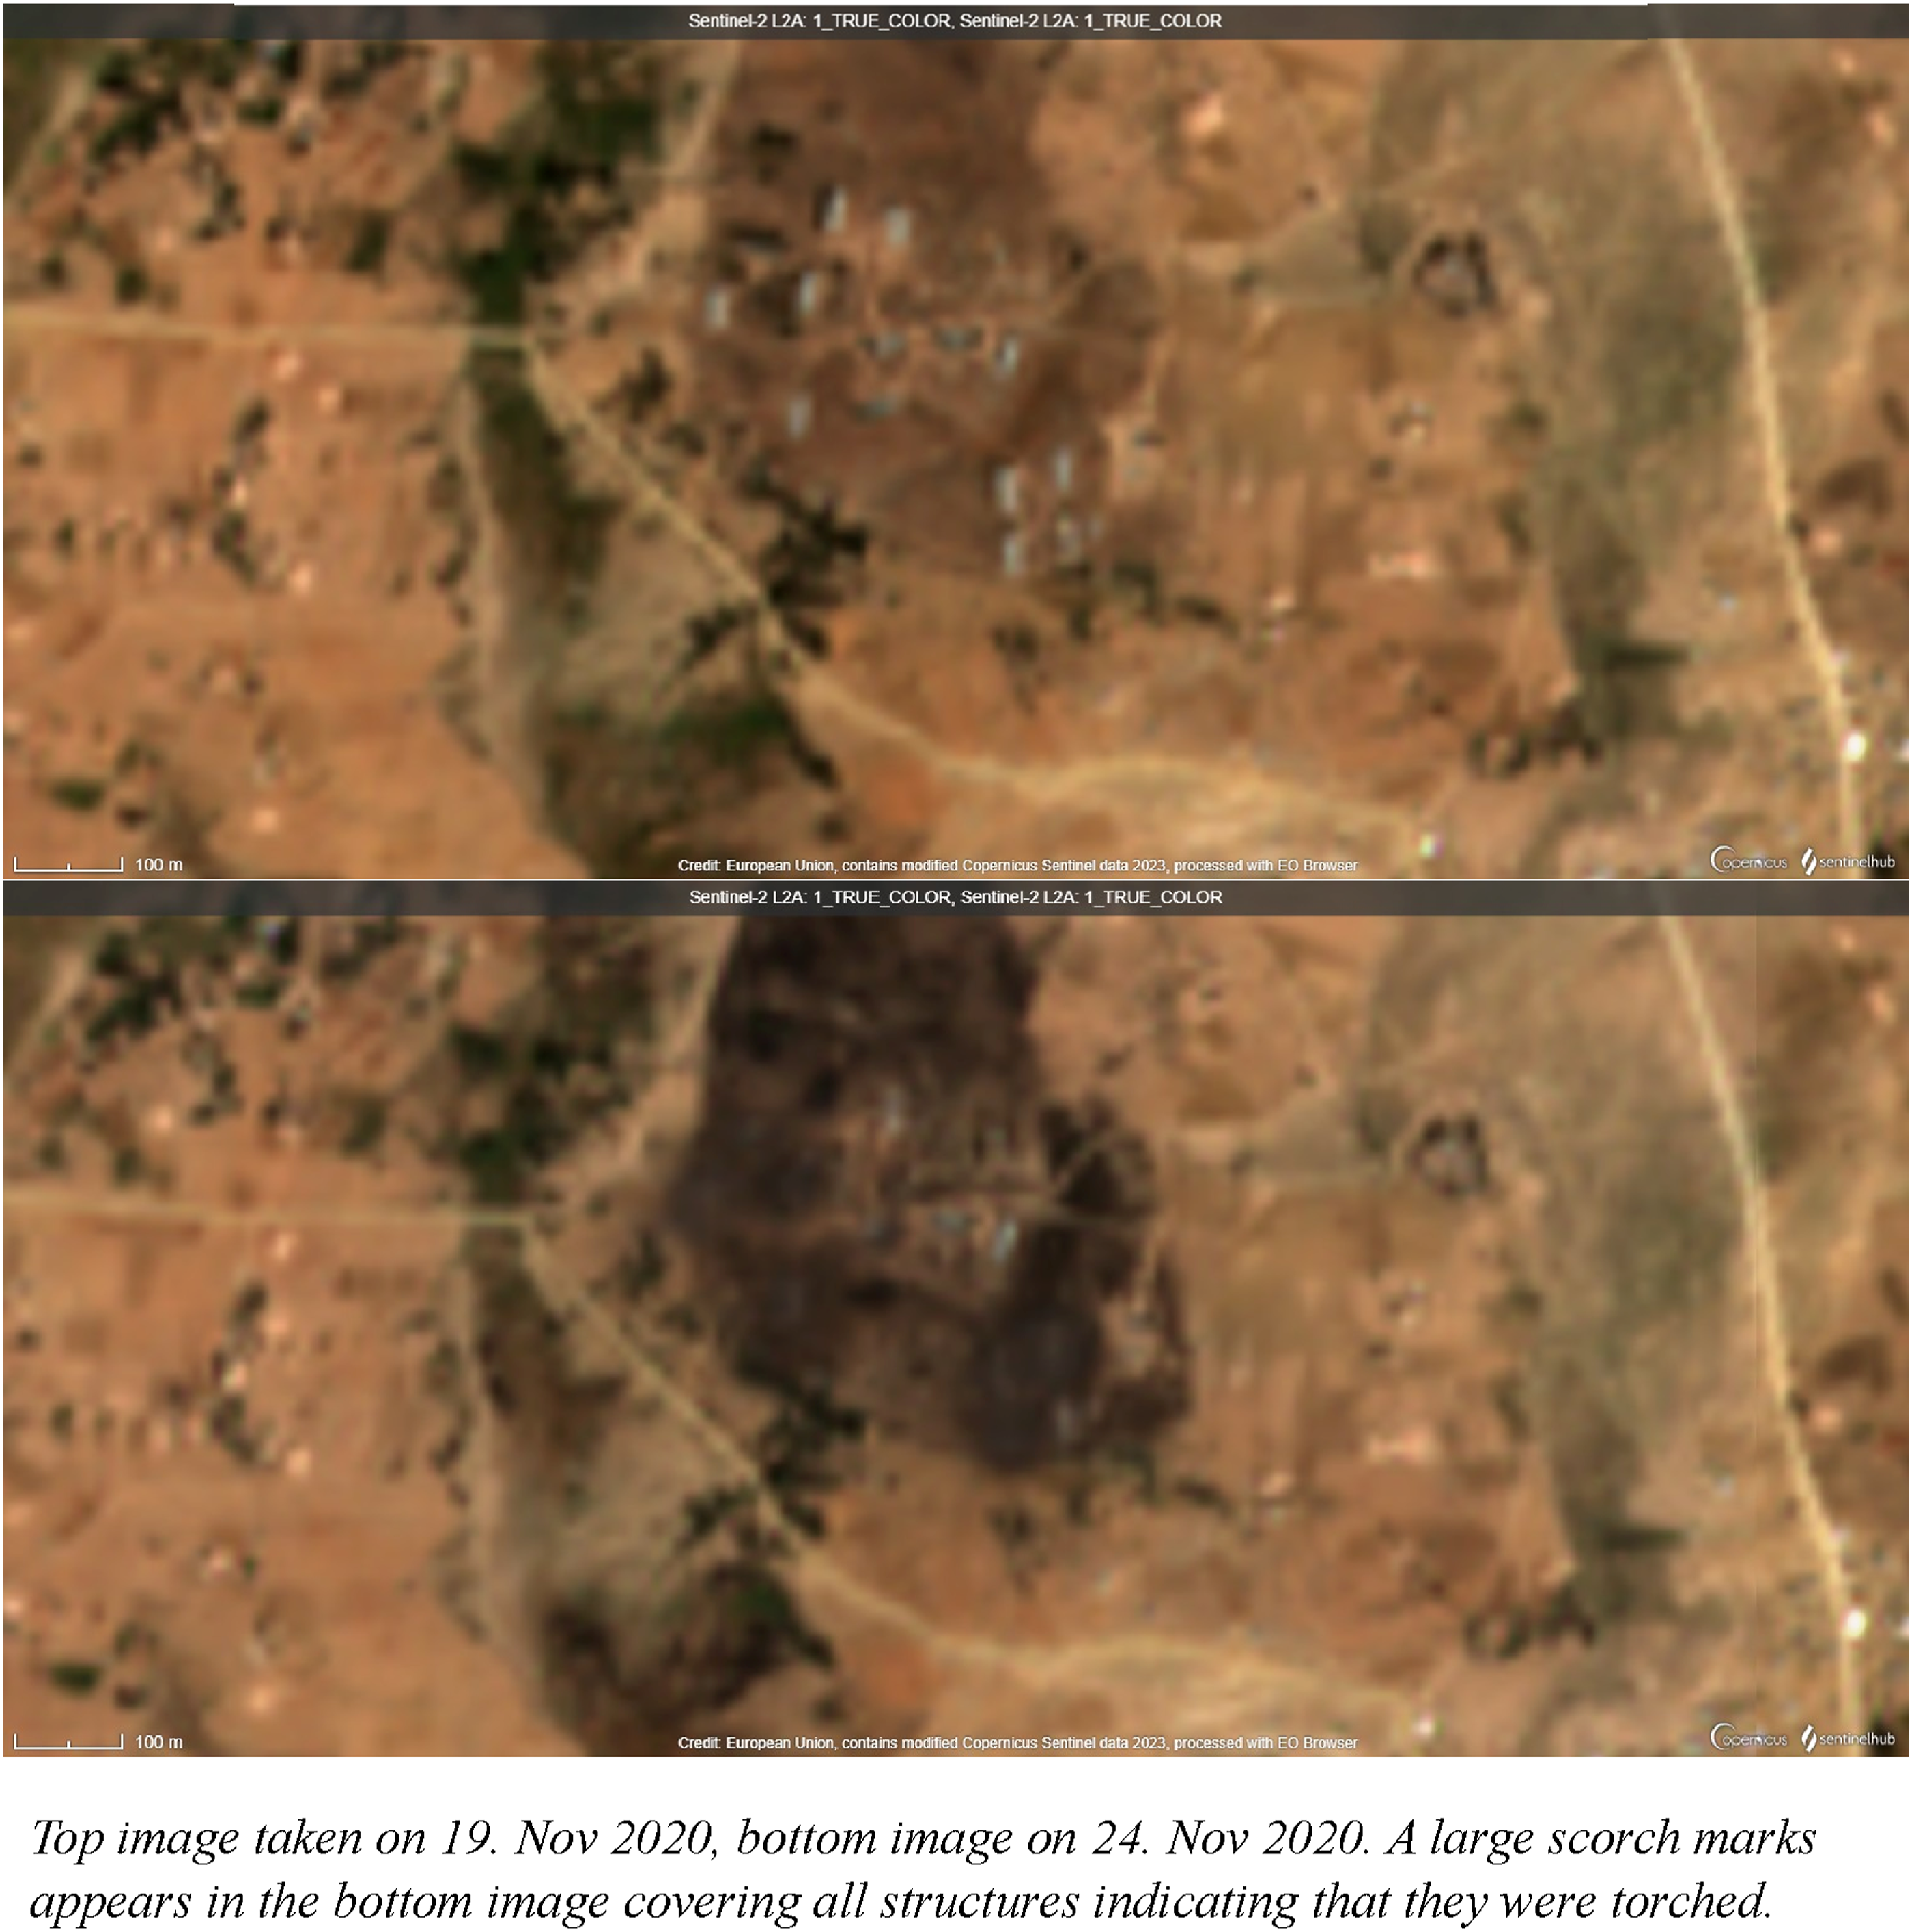
Figures 7 and 8 show an example of a conflict event near May Megelita which is missing from news-based data, but which was captured by VIIRS on 20th and 21st of November 2020. While it is unclear what purpose these structures served, they were torched to the ground. It is highly likely that this was a deliberate act, first, because the broader area around the structures is unaffected which would not be the case if the cause was wildfire. Second, the structures are within an area of Tigray in which fighting was ongoing at the time. Third, and possibly most importantly, all the structures were razed, despite there being some distance between them, suggesting that this was a willed rather than accidental outcome. It is beyond the goals of this paper to analyse how systematic the destruction of Tigray was, or to ascertain responsibility, but the above analysis shows that VIIRS provides scholars with the opportunity to investigate conflicts which are understudied due to issues of data access. Structural destruction at 14.08239, 39.55719.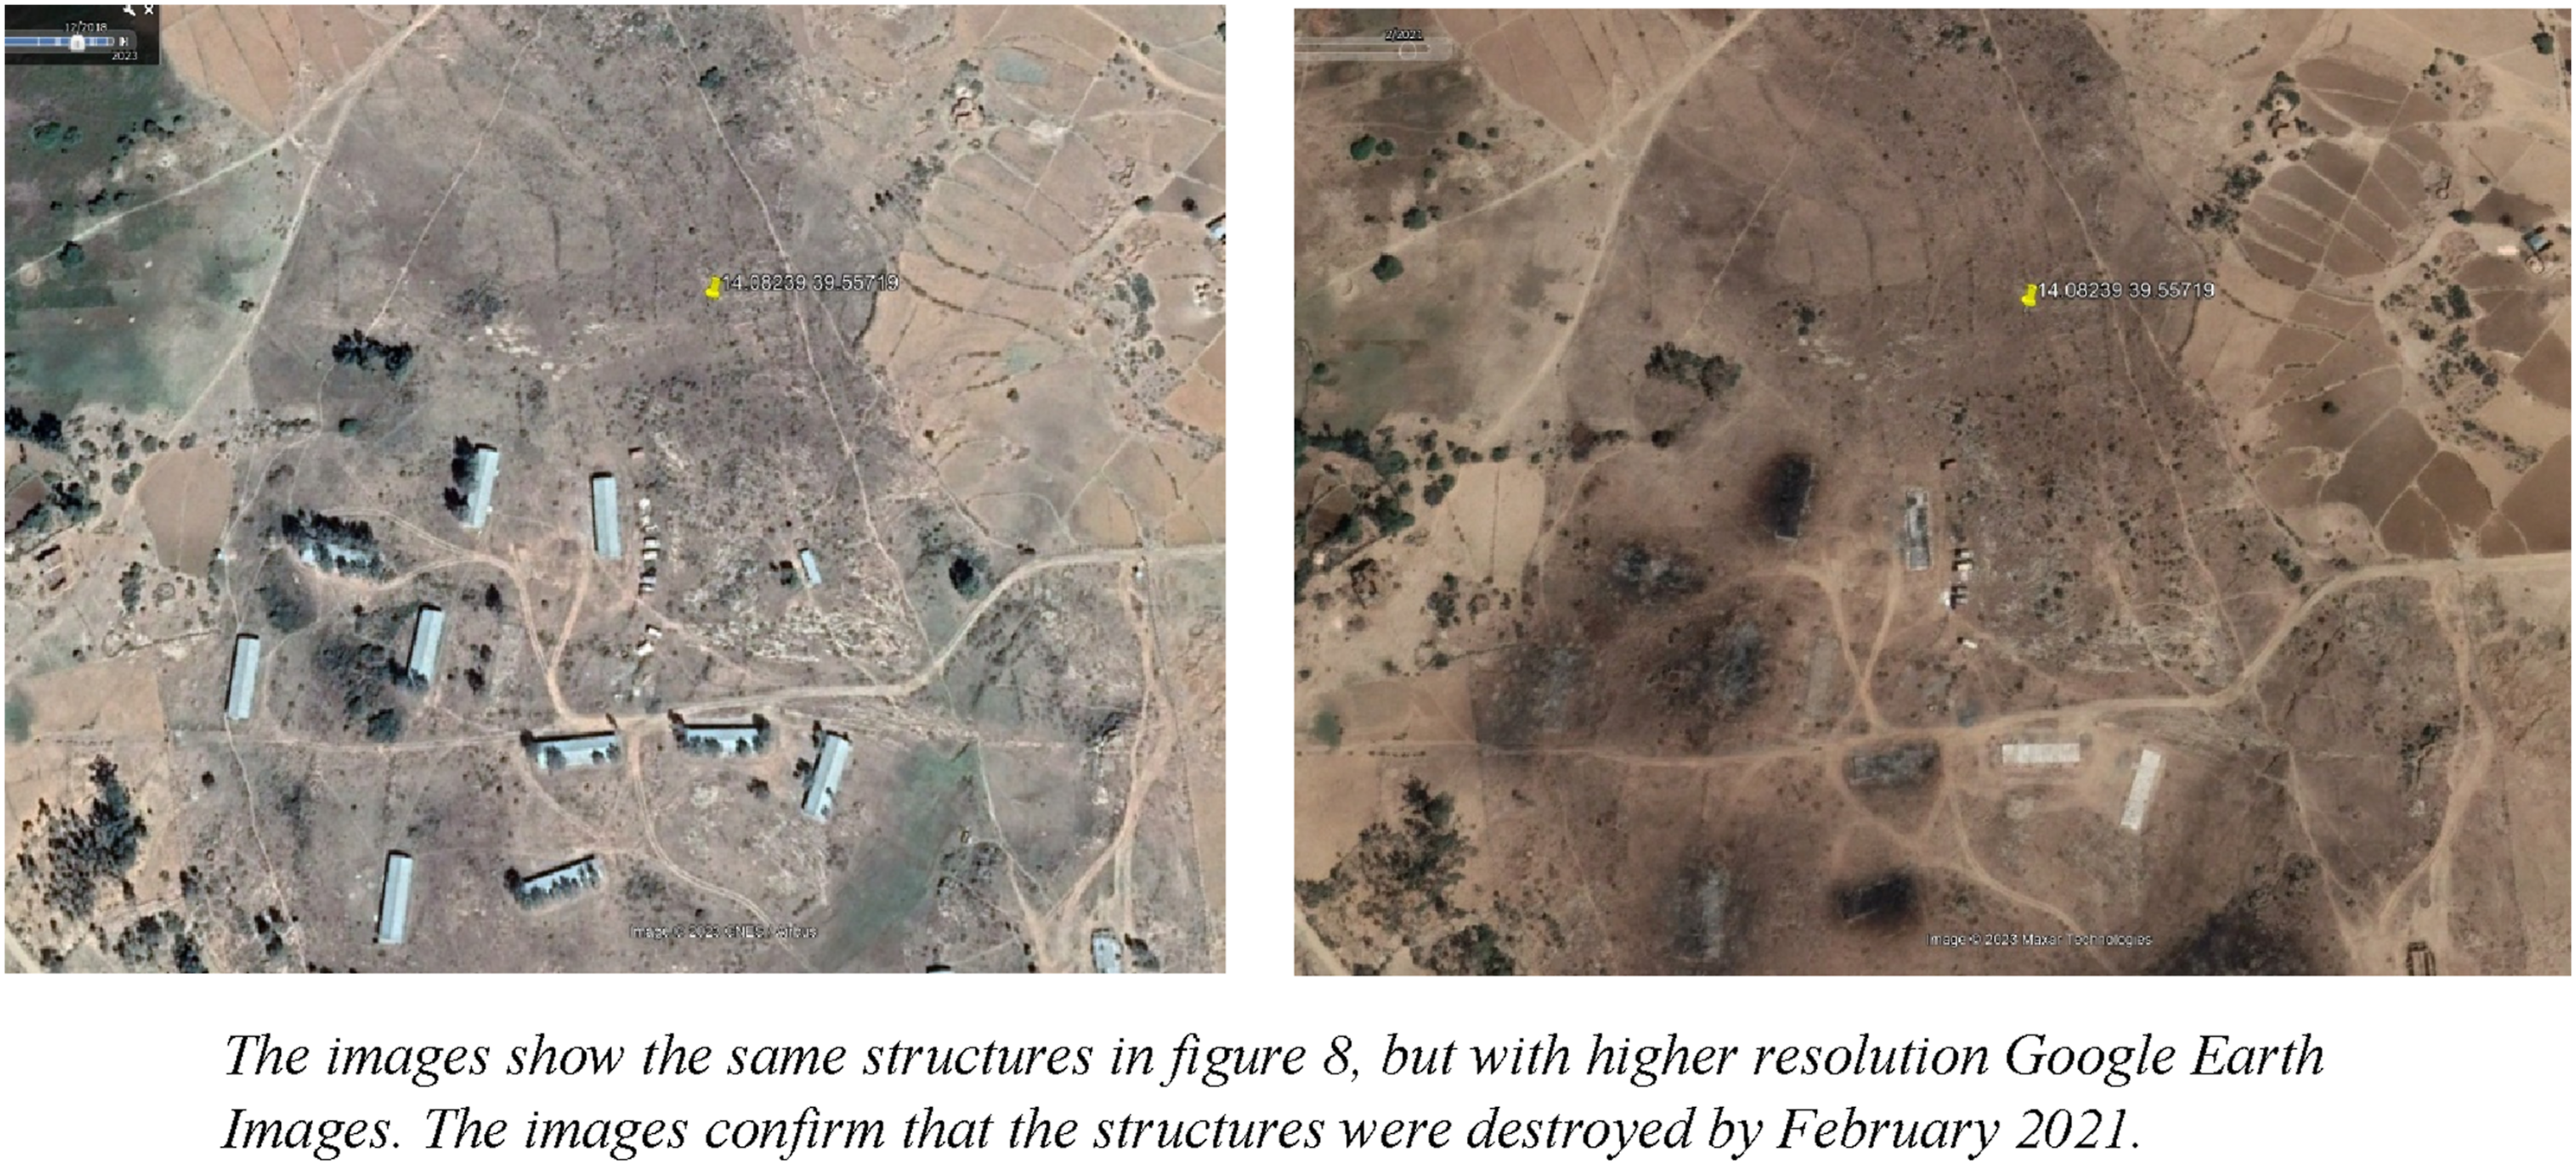
Inferences and implications
The goal of this article has been to demonstrate how fire data can allow conflict scholars to uncover unreported violence, and to verify the reliability of existing conflict event data. The case of Ukraine demonstrates that fire data can be a powerful proxy for monitoring frontlines, which allows scholars to cross-investigate the reliability of news-based data at the meso-level, to investigate non-random missingness, and to determine targets of violence at the micro-level with significant accuracy. Fire data can contribute to the micro-level research agenda of conflict studies by providing highly precise estimates for the location and time of conflict events, which allows researchers to ask new questions, for example, about how artillery and aerial bombing are used against civilians in war. The analysis of Tigray demonstrates that fire data may also allow scholars to gain insight into low-information contexts where news coverage is lacking and where field work is difficult. Fire data carries no costs or restrictions when used in conjunction with open-source satellite images for research purposes, giving easy access to near-real time data.
The use cases for fire data in the future will only multiply if the process of distinguishing true positives from false positives is simplified, for example, through machine learning. 18 By training models on true positives and introducing data on factors such as spectral signatures, seasonal variance, weather conditions, structures, and population density, it may be possible to develop a global conflict dataset based on estimates of fire detections. This would give both researchers and humanitarian NGOs access to an unprecedented level of reliable near-real time data with global coverage.
Conclusion
The collection of reliable data is a continuous challenge in conflict studies, but modern technologies for remote sensing have created low-cost opportunities for gathering data on ongoing and past conflicts. This article introduces satellite-gathered fire data in conjunction with satellite images as one such tool which under the right conditions may be a powerful resource in uncovering acts of organised violence. By comparing fire data to conflict patterns in southeastern Ukraine and Tigray, I demonstrate fire data’s utility in monitoring conflict, improving geospatial accuracy, and detecting unreported conflict events. It has significant potential in allowing scholars to verify and improve the reliability of existing data and addressing data gaps in low information environments. Future research should prioritise simplifying the large-N use of fire data, potentially allowing for large scale data collection on conflict based on a source which is not reliant on news reports.
Supplemental material
Supplemental Material - The uses for fire data and satellite images in monitoring, detecting, and documenting collective political violence
Supplemental Material for the uses for fire data and satellite images in monitoring, detecting, and documenting collective political violence by Mikael Hiberg Naghizadeh in Research & Politics.
Footnotes
Acknowledgements
I would like to thank Andrea Ruggeri, Stathis Kalyvas, Addi Haran, and Seunghoon Chae for their comments and insights. I am also grateful to Bjørn Blindheim and Aker Scholarship for their support.
Declaration of conflicting interests
The author declared no potential conflicts of interest with respect to the research, authorship, and/or publication of this article.
Funding
The author received no financial support for the research, authorship, and/or publication of this article.