
Abstract
Survey researchers are sometimes tasked with sifting through possible ways of phrasing a question in order to discover the wording that maximizes the proportion of respondents who answer in a particular way. One example occurs when a political interest group seeks to phrase a ballot measure on a given topic in a way that will garner as much voter support as possible. The present study illustrates how adaptive sample allocation can be used quickly and efficiently for this purpose. Using the example of a ballot measure on ranked choice voting, we show that adaptive design was better suited to identify the most promising ballot wording than a more conventional static design. We provide an open-source software R package and instructions for survey researchers seeking to implement adaptive experiments.
Introduction
Scholars have long suspected that public support for ballot measures may vary substantially according to how these proposals are described in the synopsis presented to voters (Burnett and Kogan, 2015; Gafke and Leuthold, 1979; Schuman and Presser, 1996). Support for this hypothesis draws on decades of surveys showing that public responses to policies can vary markedly depending on whether transfer payments are described as “welfare” or “aid to the poor” (Jacoby, 2000) or whether legal prohibitions are said to “forbid” an activity or merely “not allow” it (Hippler and Schwarz, 1986).
The hypothesis that alternative descriptions of a given policy may have a substantial effect on public support is of enormous interest to advocacy groups seeking to put a ballot measure before voters. If an appealing wording confers an extra few percentage points of voter support, the advocacy group may be less reliant on advertising and other costly outreach efforts that attempt to shift voter support during the campaign. Of course, advocacy groups do not have free rein to choose any title and description they like; in many jurisdictions, they may only propose certain wording and hope that election administrators adopt it. But which wording should the advocacy group propose?
In order to inform their proposed ballot measure wording, advocacy groups sometimes commission polls that randomly vary the ways in which a given ballot measure is described (Barber et al., 2017; Downey and Oklobdzija, 2018). The aim is to discover which wording maximizes voter support. If resources were unlimited, this exercise would be straightforward: to find which of k possible descriptions works best for a sample of size N, randomly assign N/k to each description and assess which wording maximizes the share of yes votes. In practice, however, advocacy groups face a variety of practical constraints that restrict the range of feasible research designs. First, they typically have a polling budget that allows for at most a few thousand respondents. Second, they often face a deadline for submitting their proposed language, which in turn limits the number of days that the poll can be in the field. Third, ballot measures may be presented to state or local electorates, for which the number of available respondents per day may be small. Given these constraints, an attractive research approach is an adaptive survey experiment in which the allocation of respondents to each unique ballot measure wording is updated as results come in.
Building on prior work that describes the statistical theory underlying adaptive survey design and illustrates the idea of a competition among alternative ballot wordings (Offer-Westort et al., 2021), the present paper offers a worked example of this design in practice, based on a recent study undertaken on behalf of an interest group seeking to win support for a statewide ballot measure to institute ranked choice voting (RCV). In Supplemental Material Section A, we provide practical guidelines with example
Response-adaptive design
To appreciate the intuition underlying adaptive experimental design, suppose that an interest group were interested in testing how to best phrase a ballot measure on a minimum wage increase. To do so, the group commissions a poll of 1,000 eligible voters to assess which of the 20 potential ballot measure wordings maximizes voter support. When applying a conventional static design, a pollster would ordinarily randomly assign these 20 wordings (i.e., treatment arms) evenly across the total sample and compare the share of yes votes across all arms. This one-shot experimental design may have difficulty determining the optimal ballot wording, since each arm is allotted only 50 observations.
Adaptive design helps overcome this problem by assigning more subjects to better performing arms. Instead of analyzing the data at the end of the trial, an adaptive survey periodically evaluates interim results to the properties of each arm (Bechhofer, 1954; Bubeck et al., 2011). In our running example, a pollster could split the total sample into equally sized batches and conduct experiments for each batch sequentially—for example, 100 subjects per batch over 10 batches. Not knowing at the outset which arms will perform especially well, the pollster typically begins by assigning subjects with equal probability. However, once early results are in hand, the pollster can use them to determine how to allocate subjects in the next round. That is, a researcher can assign more respondents to the arms that seem to perform well (e.g., generate higher “yes” votes among respondents). Adaptive design proceeds in this manner until a stopping rule is invoked, which might refer to a budget constraint, a total N, or a target level of statistical uncertainty (Berman et al., 2018; Rao et al., 2008).
Adaptive allocation of subjects
The goal of an adaptive experiment, as it pertains to optimal ballot wording discovery, is to maximize the share of yes votes. Intuitively, the pollster would like to invest more subjects in ballot wordings that look especially promising based on data collected up to that point. One of the most common algorithms used to allocate subjects adaptively is Thompson sampling (Thompson, 1933). Thompson sampling is rooted in a Bayesian probabilistic model of which arm is best and assigns treatments accordingly. The intuition behind this algorithm is simple: the more confident we are that a given arm is best, the more likely we are to assign that arm in the next batch.
In the first period, there are no data to generate a probability; therefore, treatment arms are sampled with equal probability. In the next period, the Thompson sampling algorithm uses the data collected from the previous period to generate the probability that each arm is best. For example, if the model suggests that there is a 60% chance that ballot wording A is best among all wordings tested, 60% of the subjects in the next period will be randomly selected to receive wording A. Similarly, if ballot wording B is accorded only a 5% chance of being best according to the algorithm, in expectation, 5% of the subjects will receive wording B in the next round. This probabilistic calculation is updated over time as more data are accumulated. Supplemental Material Section C describes the statistical theory underlying this algorithm.
Correcting for bias
A key component of adaptive designs is that the probability of assignment to each arm depends on observed outcomes, which fluctuate over time. For example, suppose that ballot wording A performed poorly (and therefore received a very low probability of being best) in the first period; it could still perform better in the next round and, consequently, be accorded a much higher probability of being best. This observed variability is more pronounced in the early stages of the study when data are limited. Therefore, even if we are only interested in estimating the share of yes votes in each arm at the end of the study, those final sample means are prone to bias (Nie et al., 2018). To account for bias, the inverse probability weighting (IPW) estimator is used, under which each observation is weighted by the inverse of the probability of assignment to the arm that it is in (Dimakopoulou et al., 2017). 2
However, IPW estimators may exhibit large variance. For example, if ballot wording A were found to have a 10% probability of being best in a second period, the outcomes from subjects who received a ballot wording A during this period will be weighted by the IPW value of 10. But if ballot wording A received 70% probability of being best in the next period, then these outcomes will be weighted by the IPW value of 1.43. Across all periods, then, the average share of yes votes will up-weight the sample mean from period 2 while down-weighting the sample mean from period 3. This could result in a higher standard error of the estimate as compared to that of the estimate under the standard static design with the same number of observations. Alternative IPW estimators exist that account for these statistical challenges (Hadad et al., 2021). However, in the context of ballot wording testing, the primary objective is to identify the best performing arm based on the estimated mean rather than obtaining precise evaluations for all arms. The standard IPW estimator suffices to achieve this goal because the best performing arm tends to receive the largest number of subjects.
Advantages
Adaptive designs have several advantages over static designs. Here, we focus our discussion on benefits as they relate to discovering optimal ballot wording. First, researchers (and advocacy groups) can evaluate a larger initial set of alternatives. Rather than pre-selecting only a few treatment arms for investigation, researchers can test a larger set of treatment arms simultaneously at a lower cost as the experiment allocates more resources to the most promising treatments during the experiment. This feature is particularly appealing for ballot wording testing: there are often many different candidate wordings that a researcher would like to test, and the adaptive design lets the researchers systematically evaluate all of them rather than having to narrow them down to a smaller set a priori, as would ordinarily be done under a static design. Relatedly, adaptive experiments can also be useful as a pilot study to quickly identify and eliminate less promising treatment options, leaving the more favorable ones to be tested in a traditional non-adaptive setting. 3
Second, adaptive design allows researchers to get an answer with a limited number of observations. Under a standard static design, a sample of size N is evenly divided across k arms. When the sample size within each arm is relatively low, the static design is unable to obtain an accurate estimate for any of the arms. Adaptive design invests more observations in the promising arms while economizing on the poorly performing ones. This dynamic allocation elevates the likelihood of discovering the best arm. As we show in the results section, we observe this uneven allocation in our application, where the best performing arm received more than five times as many observations as the worst arm.
We note that an adaptive design is particularly useful under the prior that some arms are truly better than others. If every arm were equally good, the benefit of using an adaptive design is marginal. However, when advocacy groups commission such polls, they do so because they believe that there is going to be variation in the performance across different ballot measure wordings. Given these prior beliefs, adaptive allocation of subjects is a sensible design choice. A further assumption underlying this type of adaptive design is that the true underlying performance of the treatment arms is stable during the period of the study. The Thompson sampling algorithm proposed here is designed to estimate fixed success probabilities (e.g., the probability of voting yes to a given ballot measure). This choice makes sense for the topic of ranked choice voting, which receives relatively little attention from the media. However, if we were studying a topic in a fast-moving environment where the true preferences over ballot measures are non-stationary, over-time changes in success probabilities may gradually degrade the performance of the algorithm (Granmo and Berg, 2010).
Ballot measure on ranked choice voting
Design
Question and treatment texts.

Our adaptive experiment was conducted over 10 periods, each time assigning treatment arms to roughly 200 respondents according to the adaptive algorithm. As our objective is to maximize voter support, we use the term “best arm” to refer to the ballot wording that yields the highest share of yes votes. In the first period, all arms were sampled with equal probability. In subsequent periods, we used standard Thompson sampling that adaptively allocates more subjects to the best performing arm as it emerges. 7 That is, the Thompson sampling algorithm generates probabilities that a given arm is best across all arms, and we use this probability to assign respondents to this arm in the next round.
In the first period, with a treatment assignment probability of 1/11 for all arms, the number of respondents assigned to arm 1 through 11 was as follows: [24, 25, 13, 22, 23, 25, 17, 22, 15, 24, 17]. From this sample, we observed the following average support rate for each arm: [0.50, 0.68, 0.62, 0.77, 0.83, 0.76, 0.76, 0.77, 0.67, 0.71, 0.59]. Based on these observed mean outcomes, the Thompson sampling algorithm then generated probabilities that each arm is best as follows: [0.01, 0.02, 0.02, 0.14, 0.34, 0.11, 0.14, 0.14, 0.04, 0.04, 0.01]. As expected, the algorithm allots higher probability to arm 5, which had the highest share of yes votes in the first period. We then randomly assigned respondents according to this probability distribution for the second period. The number of respondents assigned to each arm in period 2 was as follows: [0, 2, 2, 32, 68, 27, 23, 31, 4, 6]. We continued this procedure until the end of period 10.
Results
Figure 1 shows the inverse probability weighted average proportion of yes votes for each wording. Overall, the average support rate is generally high across all arms: all arms have an estimated average approval of 50% or more. We note that the wordings with the highest vote support have the smallest standard errors, as these arms tend to receive more respondents than arms with lower support rates. For example, compared to the poorest performing wording (arm 9), which received fewer than 60 respondents in total, generating a standard error as high as 8 percentage points, the most promising wording (arm 10) received over 300 respondents at the end of the study, resulting in a much more precise estimate (a standard error of 3 percentage points).
8
Under a standard static design, each arm would have received about 180 subjects. But by letting the treatment assignment adapt to past performance and allocate more observations into the most promising arms, the adaptive design allots nearly twice as many observations to the top performing arms and, consequently, is more likely to discover the best option.
Our adaptive experiment isolates a set of top finishers. Arm 10 garnered the highest vote support in the end, with an estimated proportion of 75% yes votes. But the winning arm is closely followed by arm 4 (73%), arm 6 (72%), and arm 5 (71%). Indeed, the probabilities generated by the Thompson sampling algorithm reflect the close finish: at the end of the last period, probabilities of being best were 0.19, 0.17, 0.07, and 0.18 for arms 10, 4, 6, and 5, respectively. With similarly high probabilities of being best across several arms, the best arm was not easily discernible: adaptive design invests across a set of promising arms, rather than a single arm, when there is no one clear winner. 9
Discovering a set of good arms may be an advantage in practice when a decision-maker prefers to have backup options from which to choose. In this case, the sponsoring organization may not be able to convince election officials to adopt its preferred wording. Nevertheless, our best guess is that arm 10 is the most promising option despite the presence of close runner-ups. Ballot measures are often decided by narrow vote margins (Barber et al., 2017). When such small differences can flip the ballot result, the best performing option is the safest bet. But it remains a bet, not a sure thing. At the end of ten rounds, the posterior probability that the winning arm is indeed best remains just 0.19. We conducted our experiment over 10 periods with an intention to get the result quickly, but in practice, a researcher may run additional rounds of adaptive experiments with larger samples in order to get a more precise estimate of the best arm. 10
Performance under static design: simulation
Simulation statistics.
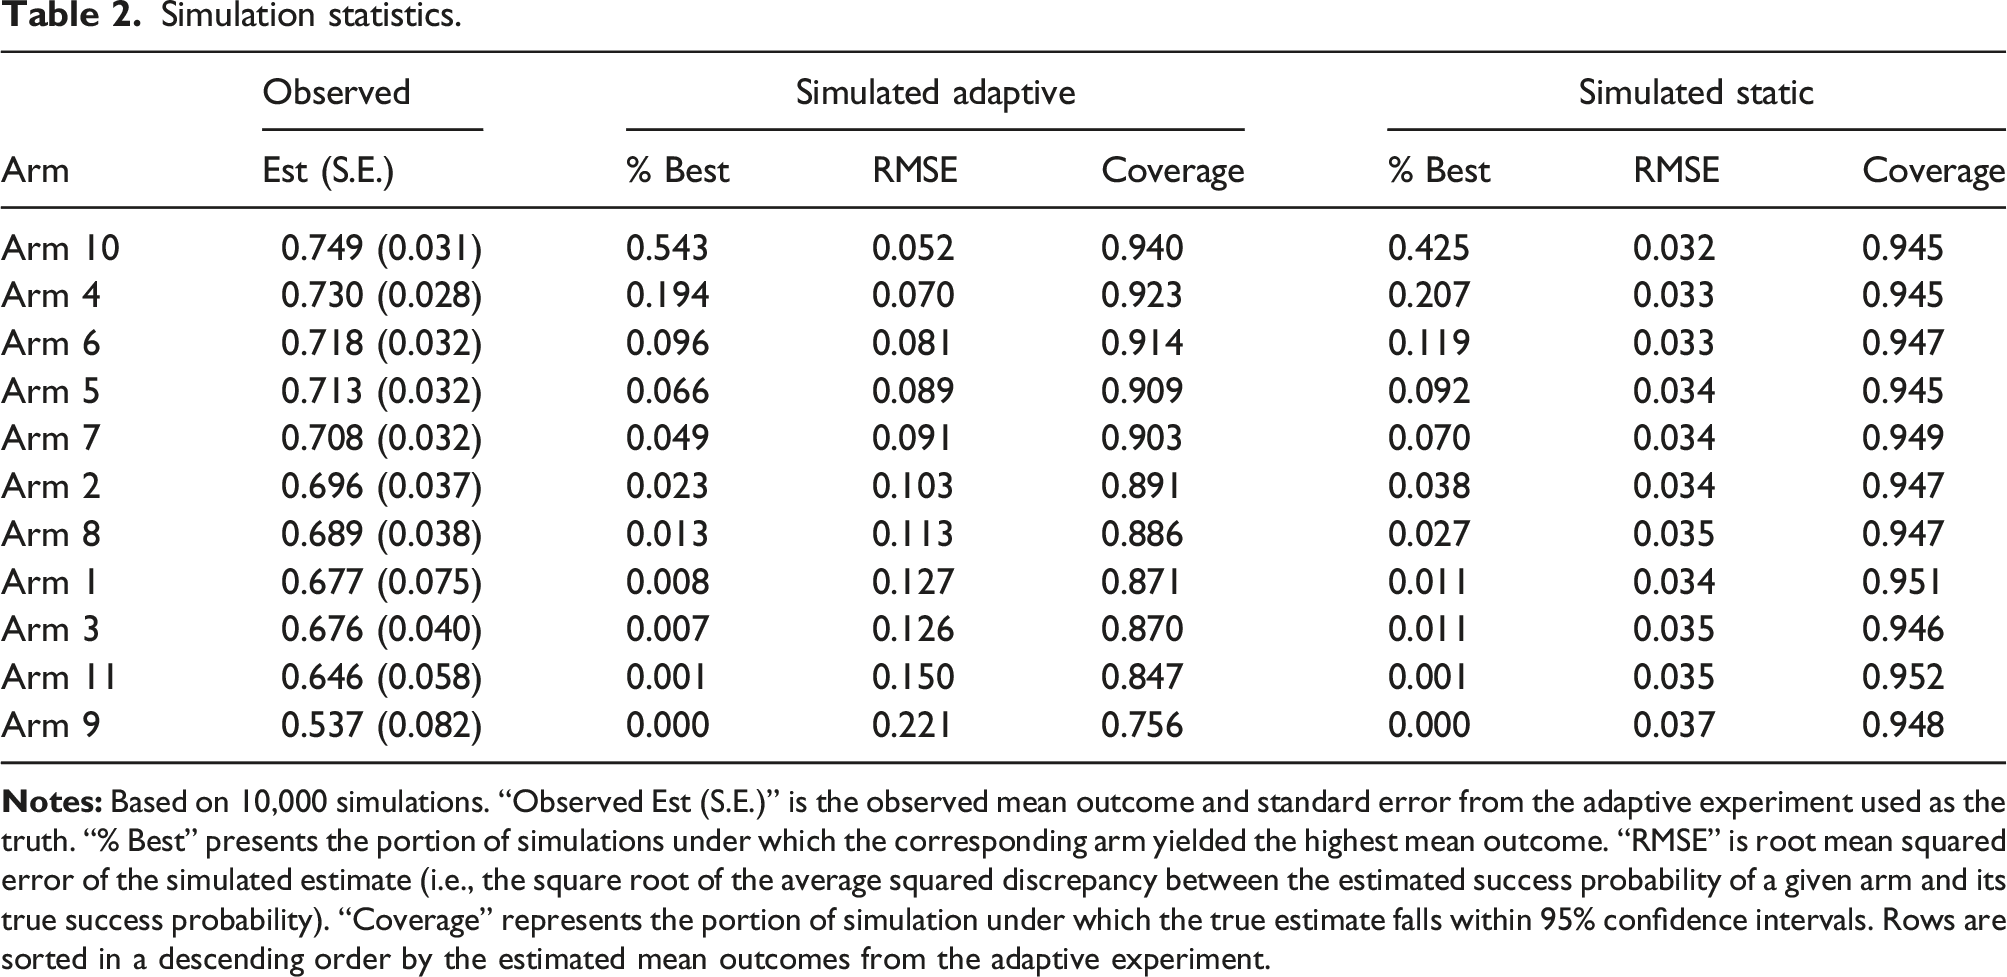
Column “Observed Est (S.E.)” shows the average approval rate and standard error estimated from the adaptive experiment, as shown in Figure 1. Treating these as the truth, we first evaluate how often a static design is able to detect the best arm as compared to an adaptive design. We find that arm 10—the best performing arm according to the experiment—turns up as the best arm in 43% of the static experiments, whereas it is selected as best in 55% of adaptive experiments.
On the other hand, the root mean squared error (RMSE) across simulations suggests that the static design is less susceptible to random sampling variability. The additional uncertainty surrounding the adaptive design reflects the use of inverse probability weights, particularly in those simulated experiments where the best arm does not quickly achieve a high sampling probability. For example, the standard errors around the estimate for the best performing arm would have been, on average, about twice as large as those under a comparable static design.
Taken together, these simulations show that, even under a scenario where the true best arm is closely followed by the next runner-ups, adaptive designs tend to outperform static designs in settings where the goal is to discover the best performing arm. The adaptive design incurs some loss of precision when it comes to precisely estimating the performance of each arm. The former goal was of greater importance to our interest group collaborator.
In Supplemental Material Section I, we present additional simulations that vary the length of the experiment, the total sample size, and the total number of arms to assess the relative performance of static and adaptive designs. Importantly, our
Conclusion
By empirically testing the performance of alternative ballot wordings, advocacy groups can potentially gain a few extra percentage points of voter support, reducing their reliance on costly outreach efforts during campaigns. The paper suggests an adaptive survey experiment as an attractive approach that helps researchers discover optimal ballot wording efficiently, addressing practical considerations such as budget constraints, time pressures, and limited availability of respondents. Using the example of a ballot measure on ranked choice voting, we demonstrate various features of adaptive design vis-a-vis a more conventional static design. Overall, adaptive survey design may provide a foundation for advocacy groups to make informed decisions about how they present their ballot measures to the public. To facilitate the use of adaptive design, we provide an
We note that an adaptive design encompasses a much broader class of designs that differ in their objectives (Agrawal and Goyal, 2013; Athey et al., 2022), sampling algorithms (Carpentier et al., 2011), and estimators (Dimmery et al., 2019; Hadad et al., 2021). These alternatives lie beyond the scope of this paper, which introduces an adaptive design that is easy to implement and most relevant to political interest groups: identifying the optimal wording for a ballot measure. The adaptive design, however, is applicable to broader contexts and has demonstrated its effectiveness in various policy-making efforts such as helping refugees find work (Caria et al., 2020) or reducing the sharing of COVID-19 misinformation (Offer-Westort et al., 2024).
That said, we are quick to acknowledge the limitations of adaptive designs in real world applications. The advantages of adaptive allocation disappear when the treatment arms have identical success probabilities. Although practitioners might be tempted to test a wide array of interventions (e.g., different ballot wordings, advertisements, and influencers), they should also reflect on whether the interventions are different enough from one another to plausibly produce different outcomes. Another consideration is whether the success probabilities are plausibly stable over time. In our application, there was no reason to believe that public opinion was in flux while our survey was in the field, but the stability assumption might be dubious when interventions are deployed amid rapidly-changing political campaigns, where interventions that work well oneday might be ineffective a few days later. In such environments, what is learned from any experiment, whether adaptive or static, may have a short shelf life.
Supplemental Material
Supplemental Material - Discovering optimal ballot wording using adaptive survey design
Supplemental Material for Discovering optimal ballot wording using adaptive survey design by Diana Da In Lee and Donald P Green in Research & Politics.
Footnotes
Acknowledgments
These authors contributed equally to the research design and writing. The first author created the ![]() . We would like to thank Alexander Coppock, Alec R. Ewig, Anja Kilibarda, and Molly Offer-Westort for helpful comments.
. We would like to thank Alexander Coppock, Alec R. Ewig, Anja Kilibarda, and Molly Offer-Westort for helpful comments.
Declaration of conflicting interests
The author(s) declared no potential conflicts of interest with respect to the research, authorship, and/or publication of this article.
Funding
The survey included in this article was funded by Oregon Ranked Choice Voting Advocates, which is a 501(c)(4) nonprofit organization. Neither author received compensation for the work described here, nor do they have financial or family ties to the survey firm or interest group that funded this study.
Data availability statement
The data and code required to reproduce results reported in this article can be found at https://doi.org/10.7910/DVN/O273OW. Open-source software ![]()
Supplemental Material
Supplemental material for this article is available online.
Notes
References
Supplementary Material
Please find the following supplemental material available below.
For Open Access articles published under a Creative Commons License, all supplemental material carries the same license as the article it is associated with.
For non-Open Access articles published, all supplemental material carries a non-exclusive license, and permission requests for re-use of supplemental material or any part of supplemental material shall be sent directly to the copyright owner as specified in the copyright notice associated with the article.