
Abstract
Conflict scholars commonly employ public opinion surveys to understand the causes and consequences of violence. However, surveying in wartime presents a distinctive set of challenges. We examine two challenges facing polling in countries at war: under-coverage of national samples and response bias. Although these issues are acknowledged in the literature on surveying methods, they become significantly more pronounced in war zones due to the geographic clustering of violence and the heightened sensitivity surrounding certain opinions. We illustrate these challenges in the context of the ongoing Russia–Ukraine war, drawing on original panel survey data tracing the attitudes of the same people in Ukraine prior to and after Russia’s full-scale invasion in 2022. We show that unit and item non-response bias in surveys conducted during the war are related to respondents’ political orientation, particularly their support for NATO membership measured in 2019. We conclude with lessons for those employing survey methods in wartime, and point to steps forward, in Ukraine and beyond.
Introduction
Research on the causes and consequences of violence commonly draws on surveys conducted in war zones. Surveys play a vital role in understanding local perspectives on support for violence and prospects for peace, and are, thus, essential for those working to alleviate the impact of violence and, ultimately, bring conflict to an end. However, conducting surveys in war zones is challenging. Limited access caused by insecurity can make it difficult to collect data, and even when access to respondents is possible, people may be reluctant to share their views due to fear of retribution or distrust of researchers, leading to response biases. These issues, though widely recognized in survey research, take on heightened importance in the context of international conflict, where accurate data are vital for both understanding and addressing the root causes of violence.
We contribute to an emerging literature on surveying in conflict zones (e.g. De Juan and Koos, 2021; Haer and Becher, 2012; Pechenkina et al., 2018) by outlining the issues of under-coverage and response bias. Although widely recognized in the survey literature, we specify their importance in war zones and illustrate them empirically in the context of Ukraine, highlighting common pitfalls of conducting and interpreting surveys fielded during war. We conclude with recommendations for those working with wartime surveys, emphasizing their broader relevance to the study of international conflict.
Challenges to wartime polls
The first challenge is under-coverage, which occurs when a sample lacks representation from some groups in a population. To overcome under-coverage, researchers can employ weighting adjustment measures, often by relying on additional sources of data, such as census data (Haer and Becher, 2012; Wagner and Stoop, 2018), though relevant additional data (on population, for example) may be hard to collect in war-affected countries due to displacement and loss of life.
Under-coverage is especially challenging in war zones due to the geographical concentration of violence (e.g. Buhaug and Gates, 2002; O’Loughlin and Witmer, 2011; Toft, 2014), which increases the risk of under-coverage of areas worst affected by violence. There are four common causes of under-coverage in war which are evident in the case of Ukraine: migration abroad, migration within the country, limited access to areas controlled by certain armed actors, and limited access to territories with active fighting. For surveys assessing political questions related to the war – and wanting to present a nationally representative set of views – one key issue is the potential exclusion of individuals with divergent and potentially unpopular opinions. People who support a certain armed actor may flee to areas under their control or neighbouring countries. For questions of accessing certain territories, it can be dangerous for survey enumerators to collect data, and belligerents may target areas in part because of the attitudes of the people who live there. This challenge can partly be addressed by changing the mode of surveying from in-person to telephone (and, these days, this is mostly via mobile phones), but if people have fled abroad, they may not be captured in in-country phone surveys if their old mobile phone numbers no longer work.
The second challenge is response bias among those who can take the survey. There are two forms of response bias that may undermine samples that are accessible: certain respondents may be less likely to (1) take part in surveys (unit non-response), and/or (2) answer politically sensitive questions (item non-response) or, relatedly, conceal their true preferences (preference falsification). The common thread linking these is the issue of sensitivity and perceived risks of punishment (Reisinger et al., 2023). These challenges pose additional risks to under-coverage. First, they may lead to surveys not being representative of the population of accessible areas. Second, they may lead to inaccurate measures of public opinion.
Unit non-response arises when potential respondents decline to participate in a survey (Groves et al., 2000). In wartime, individuals who are fearful of voicing unpopular opinions may be less likely to participate in surveys, thereby skewing the composition of the sample (Rosenfeld, 2023). Additionally, sensitive questions on subjects such as criminal activity or experiences of violence may lead to re-traumatization. Regardless of precautions and efforts to communicate potential risks to respondents (e.g. Cronin-Furman and Lake, 2018), respondents’ perceived risk of harm is likely to be heightened in conflict zones. Therefore, unit non-response due to the sensitivity of the research topic is particularly pertinent for war polls (Pechenkina et al., 2018).
Unit non-response leads to bias if there is a relationship between the dependent variables of a study and the characteristics that lead to non-response. This is likely to be common during war, especially if surveys are interested in political views. For example, in government-controlled Ukraine, people with positive views of Russia may not respond to surveys. If this is the case, then the analysis of survey data from government-controlled Ukraine – regardless of whether it employs experimental methods to overcome item non-response and preference falsification – would underestimate levels of support because people with positive views of Russia would not be included in the sample.
There are two ways in which respondents may conceal their true preferences. 1 First, individuals may avoid questions by either stating that they do not know or simply by refusing to answer, known as item non-response or the ‘don’t knows’ (Naylor and O’Loughlin, 2021). Indeed, while war generates a ‘rally-around-the-flag’ effect, it also leads some people to engage in strategic hedging on sensitive questions (Lyall et al., 2013). Second, individuals may give a false answer, known as preference falsification. This is particularly problematic because researchers may not be aware that respondents are engaging in falsifying their preferences, as opposed to when respondents refuse to answer. The common thread linking both item non-response and preference falsification is the stigmatization of certain attitudes, which is likely to be heightened during war.
Empirical illustration from Ukraine
We demonstrate these two challenges – under-coverage and response bias – with the case of Ukraine, drawing on two surveys we developed in 2019 and 2022 which were carried out by the highly experienced pollsters at the Kyiv International Institute of Sociology (KIIS). 2 Relevant sensitive attitudes differ across war zones. We focus on support for NATO membership – a measure of whether respondents are geopolitically more West-leaning – because it is a central issue in the war and, as such, potentially sensitive. 3 The 2019 survey was conducted face-to-face on people’s doorsteps. Respondents were assured that their answers were anonymous and confidential, and they could opt to end the survey at any point. The sample (2,212 respondents) was nationally representative at the time, excluding the areas not controlled by the Ukrainian Government in the east and Crimea. 4 Over 75% (N = 1,712) accepted to take part in a future survey. We intended to field a second survey with the same respondents a year later, but this wave was put off first by the outbreak of the global COVID-19 pandemic and, then, delayed by Russia’s full-scale invasion.
In October 2022, we conducted a follow-up survey by telephone. The security risks posed to enumerators was drastically reduced by changing mode to telephone. Just over 25% of respondents from the first wave in 2019 took part in the second wave in 2022 (N = 429). This represents high levels of attrition, largely because three years had passed. We also employed a different medium to collect the survey and KIIS did not contact people living in areas with active combat or occupied by Russia, nor those who had fled abroad. KIIS used random sampling to ‘top up’ the second wave (N = 1,783) to ensure a sample large enough to be representative of government-controlled Ukraine. Combined, the data collection therefore contains two nationally representative samples of government-controlled areas and, embedded within them, a longitudinal sample.
To explore under-coverage, we first analyse the spatial variation in survey attrition. Figure 1 maps out percentage change in number of respondents per oblast between the two surveys. Areas where surveys were possible in 2019 but less so in 2022 are visible. As noted above, the data collection mode changed from face-to-face to telephone. This is a limitation in our analysis, but it is unlikely to be driving such high levels of attrition alone and/or to explain its spatial variation.
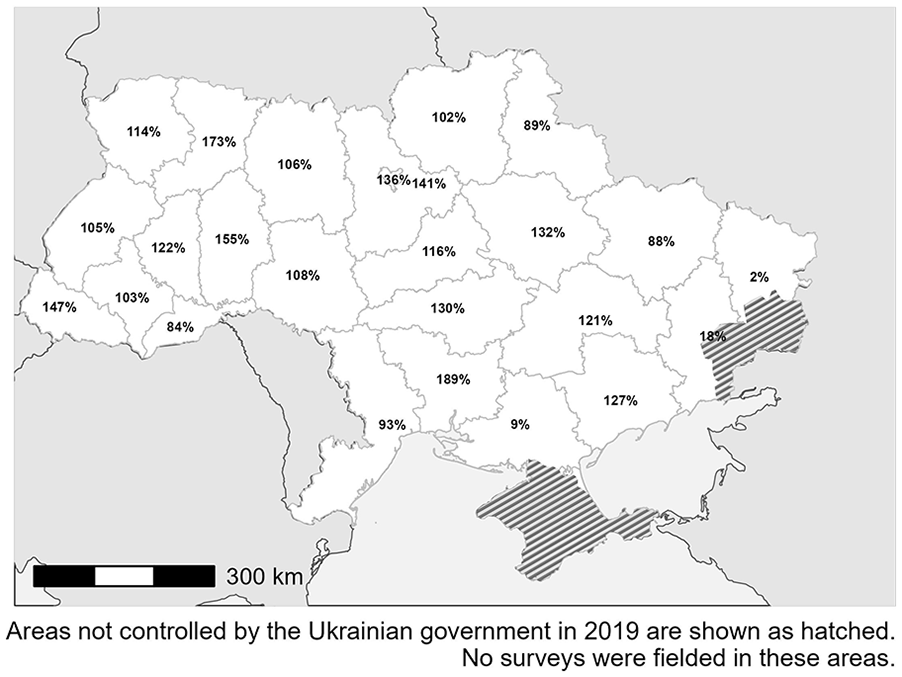
Percentage change in total number of respondents per oblast surveyed face-to-face in 2019 and by telephone in 2022.
For follow-up interviews in 2022, enumerators coded different forms of attrition for respondents who agreed to be re-surveyed in 2019: 25% completed the second survey. Of those who did not complete the survey, 69% were unreachable, and 31% refused to take part for various reasons. 5
Figure 2 shows the results of three logistic regression analyses: the dependent variable is coded as 1 if respondents dropped out of the panel between 2019 and 2022 (left pane); refused versus completed the survey in 2022 (middle pane); and were unreachable versus completed the survey in 2022 (right pane). As an independent variable, we include respondent oblast in 2019 as a categorical variable with the reference category as Kyiv city. We also include demographic control variables for gender, income, education and age. The coefficient is shown on the x-axis and black if it is statistically distinguishable from zero at 90% confidence intervals. If confidence lines do not cross over zero, the coefficients are statistically significant at 95% confidence levels. Oblasts are shown from east to west along the y-axis. Respondents in more eastern oblasts such as Luhansk and Donetsk were more likely to drop out of the panel. Splitting attrition into refused or unreachable, respondents in Luhansk and Donetsk are more likely to have been unreachable. This tendency is also visible in Kherson in the south. These trends are important because the oblasts with a high attrition rate experienced the highest levels of violence. Based on data from the Armed Conflict Location and Event Data Project (ACLED) (Raleigh et al., 2023), approximately 52% of fatalities recorded between February and October 2022 occurred in Luhansk and Donetsk. Additionally, about 15% of the total fatalities took place in Kherson, jumping to 24% if we also include Zaporizhzhia. While this analysis does not account for common reasons for attrition – people lost phones, changed numbers, or lost interest – the analysis suggests that oblasts with the highest attrition were the most violent and/or were under Russian occupation at the time of the survey.
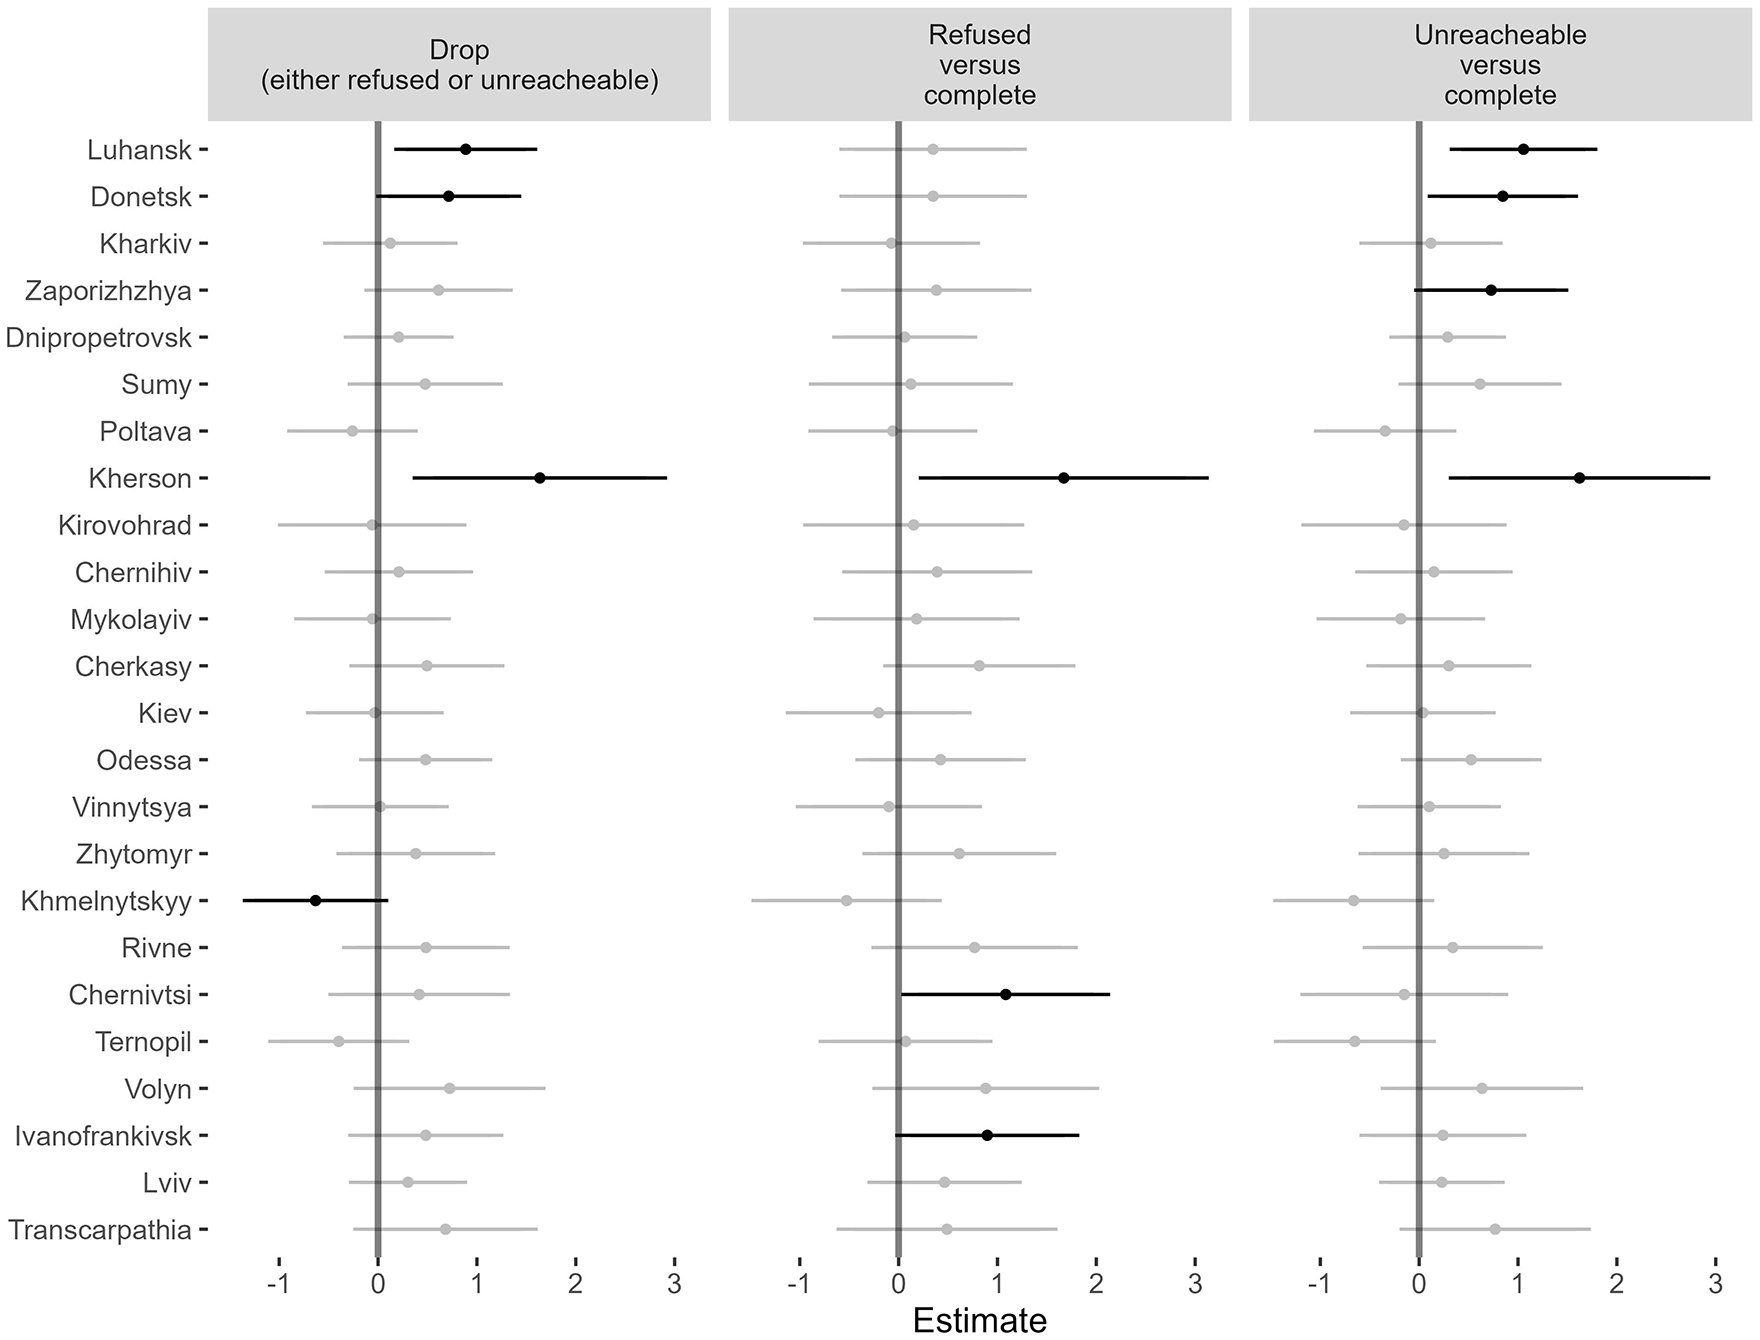
Probability of dropping out of the panel survey (left), refusing to take part versus those who completed the survey (middle), and being unreachable versus those who completed the survey (right), based on respondent oblast in 2019.
Problematic for the analysis of attitudes over time, respondents from regions with the highest rates of attrition overwhelmingly expressed opposition to Ukraine joining NATO in 2019, which is visible in Figure 3. Only 22% of respondents in Luhansk, Donetsk and Kherson supported NATO membership in 2019. Our 2022 sample is derived from regions less impacted by the violence of war and Russian occupation, which are also the areas that were more inclined towards NATO membership before the war (O’Loughlin et al., 2022). Conclusions derived from wartime polling are limited to the areas accessible to researchers and the current residents within those areas. While this may seem obvious, it carries implications beyond Ukraine. It is essential for researchers (and those who cite their data) to clarify that surveys of war zones often fail to capture the attitudes of individuals in certain areas in ways that may be related to the topic of interest, such as support for war objectives, or, as in the case of Ukraine, geopolitical orientations.
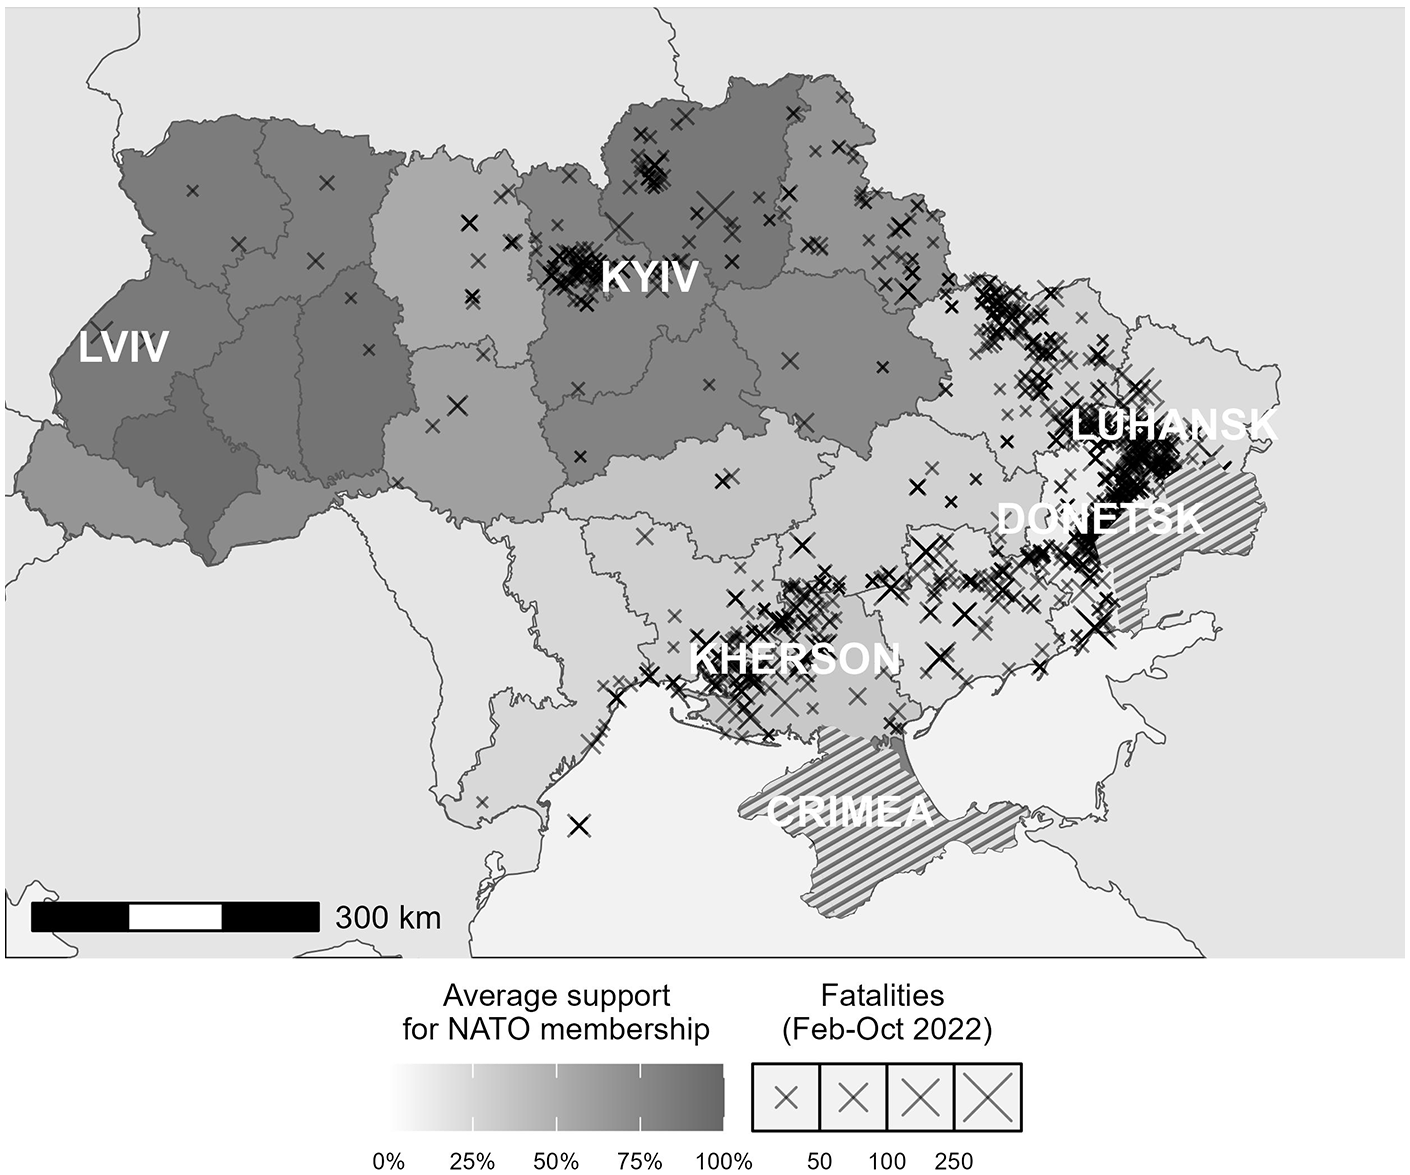
Conflict-related violence in 2022 according to ACLED laid over average support for NATO membership in 2019.
The longitudinal component of our data allows us to analyse unit non-response. To analyse how the political opinions of respondents may be related to unit non-response, we again rely on support for NATO membership measured in 2019.
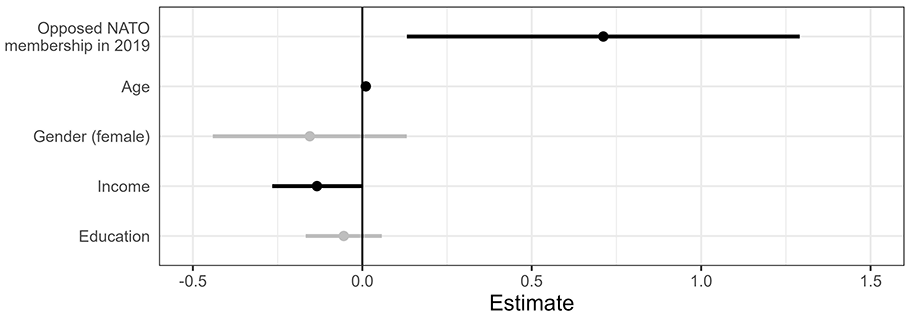
Figure 4 shows the results of three logit regression analyses in which the binary dependent variable indicates whether respondents completed the survey (left pane). 6 Again, we explore the attrition by comparing whether respondents refused to take part (middle pane) or were unreachable (right pane) versus whether respondents completed the survey. All models include controls for age, gender, education, income, and oblast fixed effects, 7 as measured in 2019. The results indicate that respondents who opposed NATO membership in 2019 were less likely to complete an interview in 2022. When restricting the sample to only those who either completed or refused to take part, both coefficients are positive but only refusal is statistically significant at 95% confidence intervals.
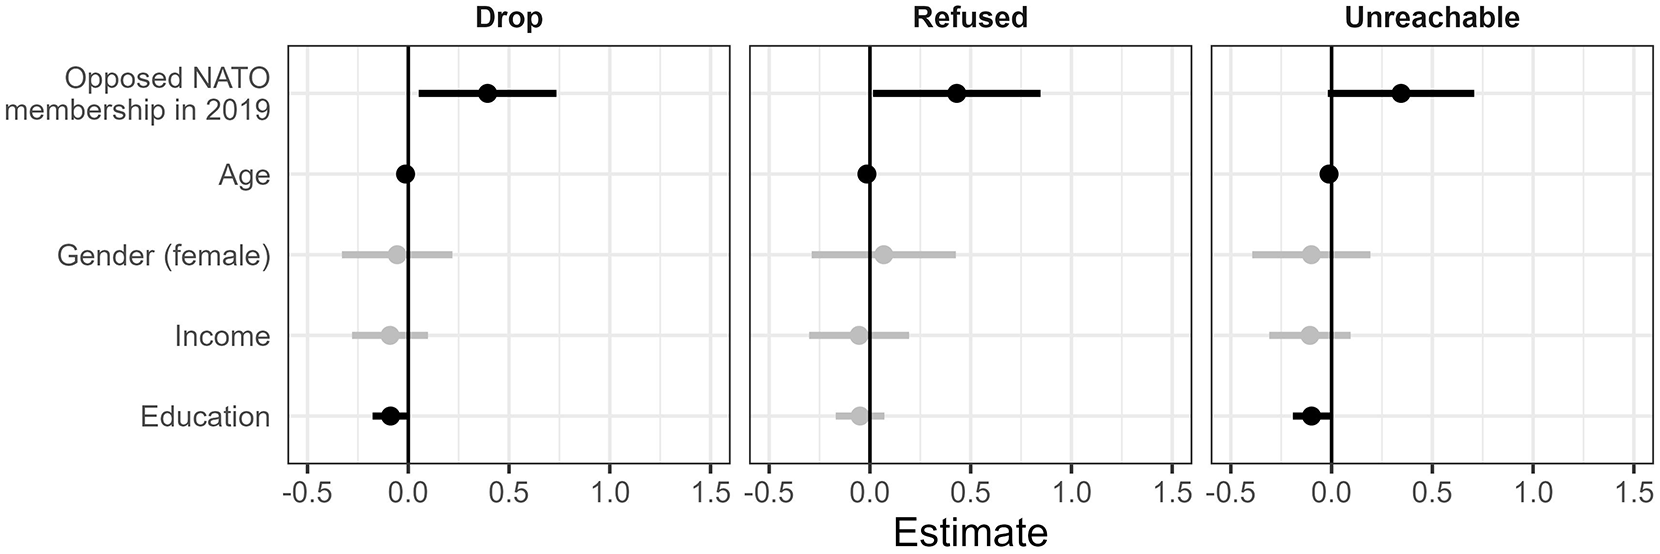
Different forms of attrition depending on support for NATO membership in 2019.
In sum, surveys conducted during the war do not account for the views of those who have fled abroad and remain in violent or occupied areas (as detailed above), but we also find evidence that the survey suffers from unit non-response bias for respondents that were less Western-oriented in 2019 even in areas where enumerators had access in 2022. Furthermore, there is evidence that this effect may be driven by refusal (i.e. they are still in Ukraine and no longer want to take surveys) as opposed to being unreachable (i.e. they may have left Ukraine or live in an area occupied by Russia). We conclude that samples in accessible areas are likely to suffer from unit non-response bias.
We assess item non-response bias by drawing on survey responses from the 25% who completed both surveys. A Little’s (1988) test of potentially sensitive questions reveals that missing data are not missing completely at random (MCAR). This indicates that respondent characteristics are related to item non-response. We again focus on respondents who opposed NATO membership in 2019, suspecting that they may feel social pressure to respond in a certain way and thus avoid answering questions.
First, we compare the average number of item non-responses per respondents in an ordinary least squares (OLS) framework. To do so, we take as our dependent variable the count of ‘don’t know’ or ‘refused to answer’ responses for each respondent across 14 potentially sensitive political questions. 8 The results of this analysis, which include demographic controls, are shown in Figure 5. On average, respondents who were against joining NATO in 2019 provided 0.71 more non- responses than those who were in favour, representing a 59% increase relative to the average number of non-responses. This analysis shows a statistically significant relationship between non-response and pre-war political orientation but ignores important variation across questions.
Number of ‘don’t knows’ to potentially sensitive questions.
Second, we run a series of similar logit regression models in which the dependent variable is whether respondents provided a non-response to each question. As indicated by the black coefficient lines in Figure 6, those who were against joining NATO in 2019 are more likely to provide a non-response to almost half of the potentially sensitive questions. Combined, our analyses suggest strategic hedging among respondents who were less Western-oriented in 2019.
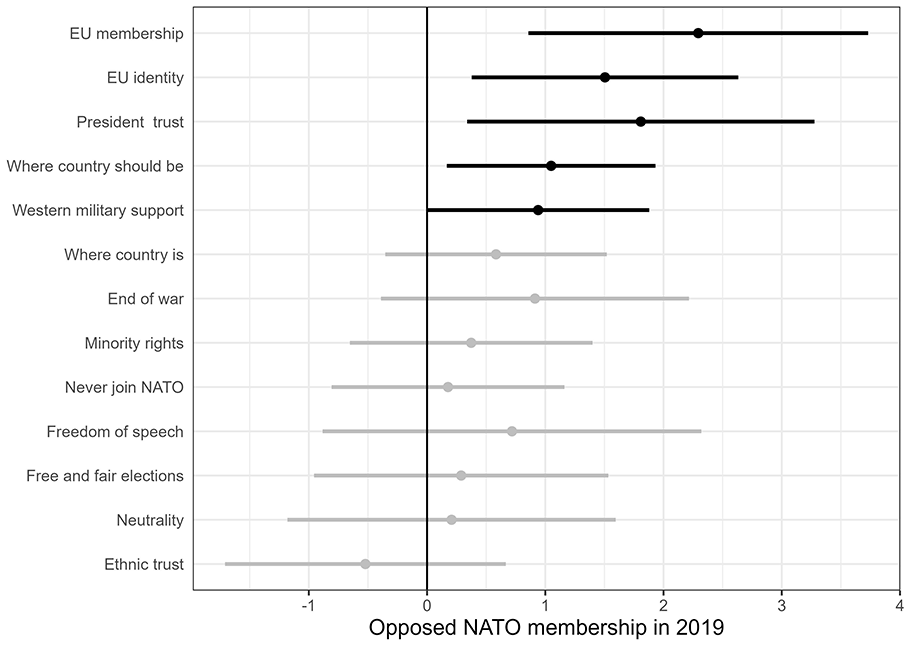
Probability of non-response from respondents who were against joining NATO in 2019.
Item non-response bias shares similar underlying causal mechanisms as preference falsification. One can measure preference falsification with experimental designs aimed at eliciting respondents’ true preferences, which we discuss in detail below. We did not develop such an approach, but we note that the existence of non-response bias indicates that the likelihood of preference falsification is high because the underlying mechanisms – social desirability and stigma – are the same. In sum, it is likely that wartime surveys in Ukraine suffer from significant response biases.
Ways forward
What can researchers do? The two challenges necessitate different responses. There is no easy panacea for under-coverage. In light of this, researchers should take steps in their analysis, interpretation and dissemination to actively communicate the uncertainty around accurately measuring public opinion. This may require more than simply stating that the survey was limited to certain areas, and, additionally, to explicitly state that we cannot know the views of those who have fled the conflicted country or remained in the most violent and occupied territories – and recognize that these views may differ from the views of those covered. In light of this limitation, researchers could collect multiple sources of data (e.g. fieldwork or interviews with displaced populations) and triangulate the evidence alongside surveys. Ultimately, we advise against big claims based on surveys alone.
Researchers who aim to elicit political preferences on sensitive topics, as opposed to immediate needs, should develop research strategies to overcome response biases. These efforts, therefore, mostly take place before a survey is fielded. How can we design research to elicit truthful responses and avoid both non-response and preference falsification? There is a large and growing literature on survey methodology that focuses specifically on indirect methods to elicit responses to sensitive questions.
One such technique is list experiments (Blair et al., 2020). As noted by Reisinger et al. (2023), they allow flexibility, can be combined with direct questions to increase accuracy, and shed light on types of people most likely to misreport. While susceptible to design effects, including floor and ceiling effects (e.g. Lyall et al., 2013; Pechenkina et al., 2018), the list experiment provides an effective way to measure sensitive items.
There are several other techniques for measuring sensitive questions. Rosenfeld et al. (2016) evaluate list experiments alongside other techniques, including indirect questioning techniques, endorsement experiments, and randomized response technique (see also Blair et al., 2015). Researchers need to consider the trade-off of various approaches. For example, some techniques are more difficult to implement with poorly educated populations. In these cases, the trade-off will also be informed by resource constraints. Direct questioning allows researchers to ask a range of questions in a limited timeframe, which keeps interview time and costs down. Eliciting responses to sensitive questions may require more effort per item, but the payoffs in terms of reducing bias are high.
Conclusion
Wartime polls offer valuable insights, but they face significant challenges, particularly concerning representativeness and the accuracy of expressed preferences. As researchers, we need to communicate the uncertainty these challenges entail. This is not to say that researchers should shy away from conducting public opinion surveys in war-torn settings. Indeed, wars underscore the importance of rigorous and independent academic research, as it can help guide policymakers and first responders, and give a voice to those suffering from violence. This is certainly the case for Ukraine. In 2022 alone, the United Nations High Commissioner for Human Rights recorded over 6,000 civilian casualties (OHCHR, 2022). Over six million people, mostly women and children, have fled the country as of September 2024 (UNHCR, 2024). In the context of the largest humanitarian crisis in Europe since the Second World War, academic research can shed light on conflict dynamics, human rights abuses, and, in the case of surveys, ordinary people’s perceptions – indeed, wars are often fought in the name of ‘what the people want’. We have a duty to study public opinion, but also to effectively communicate uncertainty.
Footnotes
Acknowledgements
We thank Natalia Kharchenko and her team at KIIS for their excellent work on both surveys. We are grateful for comments and suggestions from Manuel Vogt, Enzo Nussio, UCL’s Conflict & Change research cluster, and participants at both the 2023 Jan Tinbergen European Peace Science Conference and the 2024 Annual World Convention of the Association for the Study of Nationalities. We would also like to thank two anonymous reviewers for their helpful comments.
Replication data
Funding
The author(s) disclosed receipt of the following financial support for the research, authorship, and/or publication of this article: The project received funding from a joint US National Science Foundation/Research Council UK grant (NSF Award 1759645; ESRC Award ES/S005919/1) and the Norwegian Research Council (Award 275404).
Notes
KIT RICKARD, b. 1990, PhD in Political Science (Political Science Department, University College London (UCL), 2022); Senior Researcher, Centre for Security Studies, ETH Zürich (2023–present). Research interests: conflict, legacies of war, international relations, research methods.
GERARD TOAL, b. 1962, PhD in Geography (Syracuse University, 1989); Professor, School of Public and International Affairs (Virginia Tech, Washington metro area). Research interests: critical geopolitics, territorial conflicts after Communism, geopolitics–climate nexus, geopolitical orientations. Author: Critical Geopolitics (1996); Bosnia Remade (2011); Near Abroad (2017); Oceans Rise Empires Fall (2024).
KRISTIN M BAKKE, b. 1977, PhD in Political Science (University of Washington, Seattle, 2007); Professor of Political Science and International Relations at University College London; Associate Editor at Journal of Peace Research. Research focuses on how states respond to opposition within their borders, the dynamics of violence in self-determination struggles, postwar state building and wartime legacies, and geopolitical orientations. Author of Decentralization and Intrastate Struggles: Chechnya, Punjab, and Québec (Cambridge University Press, 2015).
JOHN O’LOUGHLIN, b. 1948, PhD in Geography (Pennsylvania State University, 1973); Professor of Geography and Fellow, Institute of Behavioral Science, University of Colorado Boulder (1988–present). Research interests: geopolitical orientations in the post-Soviet space; spatial analysis of conflict; climate change, food security and conflict in sub-Saharan Africa, especially Kenya.