
Abstract
Negativity against LGBTQ+ and gender equality symbols is escalating across Western European countries, including those at the forefront of sexual modernism. Drawing on data from Spain, this paper theorizes and finds that state-sponsored LGBTQ+ symbols receive significantly more negativity than other aspects of LGBTQ+ issues related to general and specific attitudes toward formal rights. The negativity is primarily explained by support for Vox, a radical right-wing party, and age. The study provides insights into the complexities of public opinion surrounding LGBTQ+ symbols, offering a nuanced understanding of the challenges faced by the LGBTQ+ community in terms of acceptance and visibility. Furthermore, it highlights the influence of political affiliations and generational factors in shaping these attitudes.
Introduction
Negativity against LGBTQ+ and gender equality symbols are escalating across Western European countries. In Germany, on LGBTQ+ Pride 2023, far-right groups such as the AfD youth coopted the LGBTQ+ flag. Through a literal translation of pride month into German (#StolzMonat) and the rebranding of the pride flag with the colors of the German flag, they appropriated the LGBTQ+ symbolism and transformed it into a counter-symbol of national pride. 1 In a similar attempt to stigmatize LGBTQ+ symbolism, Swiss SVP member and editor-in-chief at the weekly magazine Die Weltwoche, compared in 2022 the LGBTQ+ OneLove football armband to Nazi symbols. 2 Earlier, in Amsterdam, LGBTQ+ flags were banned in some student apartments after several flags in support of the LGBTQ+ community were set alight. 3
Anti-LGBTQ+ symbolism instances find special momentum in Spain. In the first week following the inauguration of the new councilors from the PP-Vox coalition resulting from the local elections in Spain in 2023, several municipalities banned the display of the rainbow flag representing LGBTQ+ rights on public buildings.
4
In Nàquera (Valencia), official condemnations of gender-based murders will no longer be issued, and specific minutes of silence rejecting gender violence will not be organized. That same week, a large banner made by Vox appeared in the center of Madrid, “throwing to the bin” feminism and the LGBTQ+ community, symbolized by the rainbow flag, among other things (Left panel of Figure 1). The regional leader of Vox Juan García Gallardo’s stigmatizing explanation for the banner seems applicable to German #StolzMonat: “We always say yes to the flag of Spain that unites and reunites all our compatriots, but we say no to a rainbow rag that unites the international plutocracy with the most sectarian left.”
5
Depictions of attacks made by Vox against LGBTQ+ and gender equality symbols.
This is concerning for several reasons. First, these events represent an escalation of other recent attacks on liberal and LGBTQ+ symbols by the radical right in Spain. In 2019, the official Vox party Twitter account had already published a tweet featuring Aragorn, a character from Lord of the Rings, alongside the Spanish flag, fighting against supposed enemies, including the Venus symbol representing the feminist struggle and a small ghost adorned in the colors of the rainbow flag commonly associated with LGBTQ+ pride (Right panel of Figure 1). Since 2020, the government in Madrid, led by PP, decided to remove the flag that used to fly at the town hall during pride month. In 2023, PP and Vox not only vetoed the commemoration of pride month in several regional parliaments but also Vox threatened to put the security service of the Cortes de Castilla y León in out-party offices to remove the LGTBQ+ flag. 6
Second, in the name of symbols such as flags “men live and die” (Pi-Sunyer 1995), and their effects on group cohesion are well demonstrated (Callahan and Ledgerwood 2016). This importance is particularly pronounced for LGBTQ+ individuals, for whom symbols serve as a fundamental tool for visibility. Furthermore, evidence suggests that symbolic attacks are linked to violence against minorities (Jäckle and König 2017; Romarri 2020). An example of this is the case where, following the ban on displaying LGBTQ+ flags on public buildings in Nàquera, a young individual was forced to remove an LGBTQ+ flag from their private balcony due to threats of stoning by neighbors. 7
Hostility against LGBTQ+ symbolism contrasts with societal attitudinal and legal changes. While negative attitudes, trans-exclusion, and explicit homo- and transphobia still persist in society, there have been significant transformations in terms of institutional recognition, social tolerance, and public support for LGBTQ+ individuals (Caughey, O’grady, and Warshaw 2019; Velasco 2023). These changes are reflected in the adoption of public policies aimed at enhancing the welfare of sexual and gender minorities, thereby integrating them into the societal “mainstream” rather than marginalizing them as a sexual outgroup. Spain, for example, passed in 2023 a pioneering bill that paved the way for gender self-identification. Furthermore, 91% of Spaniards were supportive if a family member came out as gay or bisexual, and 87% said they’d feel the same if the person were transgender or nonbinary in 2021 (Nolsoe 2021).
In this paper, I provide an explanation for the apparent contradiction between negativity against the state-sponsored display of LGBTQ+ symbols and otherwise favorable attitudes and institutions toward the LGBTQ+ community exploiting unique data on the support for banning pro-LGBTQ+ and gender equality symbols in public buildings in the Spanish context.
Support for state-sponsored LGBTQ+ symbolism
The argument presented is that state-sponsored LGBTQ+ symbols, such as the pride flag, receive much less support than other LGBTQ+ issues due to three main reasons. Firstly, support for the display of LGBTQ+ symbols constitutes support for a specific measure. As Dotti Sani and Quaranta (2020) explain, many previous studies have examined general attitudes toward LGBTQ+ using survey questions such as “Gays should be free to live as they wish.” According to the authors, this kind of attitude should be distinguished from specific attitudes such as support for adoption by gay and lesbian individuals, for which the population tends to hold more negative attitudes, as demonstrated by these same authors. Further research on specific measures corroborates homonegative discrimination when respondents face specific attitudes (Turnbull-Dugarte, 2022). While general attitudes may serve as a starting point, it is only when citizens support specific measures that it can be said that they not only tolerate the existence of LGBTQ+ individuals but also accept it (Walters 2014). From this perspective, support for the public display of LGBTQ+ flags is a specific measure, similar to support for gay and lesbian adoption. However, mere acceptance is not enough; supporting LGBTQ+ symbolism entails celebration, revindication, and LGBTQ+ pride (Monaghan 2021). In this sense, widespread support for inclusive policies regarding LGBTQ+ symbolism should be comparatively weaker than general attitudes, but also specific attitudes such as equal marriage or adoption.
Another reason why state-sponsored LGBTQ+ symbols are likely to be viewed with more negativity is that their advocacy is seen as a threat to informal privileges held by cis-heterosexual peers. Doan et al. (2014) examine whether people distinguish between formal rights, such as marriage, and informal privileges, such as public displays of affection. These informal privileges are considered “unearned advantages” and include privileges like feeling safe and comfortable in public spaces or, as I argue, affirming LGBTQ+ identities as legitimate and promotable, worthy of public representation via the exhibition of state-sponsored LGBTQ+ flags. These scholars found that while heterosexual individuals are willing to grant formal rights to same-sex couples, their support significantly decreases when it comes to public displays of affection, their measure of “informal privilege.” This same logic should explain the differential negativity towards the display of LGBTQ+ flags.
Lastly, negativity towards state-sponsored LGBTQ+ symbols differ from other measures such as opposition to equal marriage or negativity toward LGBTQ+ display of affection, in that symbols depersonalize these offenses. This should result in lower perceived social costs since the rejection of LGBTQ+ symbolism does not necessarily categorize one as “homophobic” to the same extent as opposing LGBTQ+ rights. Individuals can shield themselves by claiming that they are not against LGBTQ+ people and their rights but rather against certain symbols. It becomes a covert and subtle way to express prejudice in a context where expressing hostility towards LGBTQ+ individuals goes against the majority sentiment of society and serves as an outlet for those with homophobic attitudes to express them without openly revealing their prejudice.
All of this leads us to hypothesize that attitudes towards state-sponsored LGBTQ+ symbols will be more negative than abstract support for LGBTQ+ individuals and concrete support for LGBTQ+ rights, such as adoption.
On top of this hypothesis, this paper seeks to understand whether traditional correlates of negativity towards LGBTQ+ issues, such as age, gender, and media consumption (for a review, Adamczyk and Liao 2019), predict also opposition toward the display of LGBTQ+ symbolism in public buildings. I yield special attention toward partisanship due to the important role that voters have in allowing backsliding policies. Considering that much anti-LGBTQ+ sentiment originates from Vox’s elite, this study investigates whether its supporters share this negativity and whether voters of Vox’s major coalition partner, the mainstream right-wing party PP, are similarly inclined to oppose the display of LGBTQ+ flags.
Empirics
Despite flags and other symbols being a contentious issue in various parts of the world, Spain stands out as a country deeply entwined with flag-related matters. The display of the Spanish national flag has been a subject of controversy due to its historical association with Franco’s regime (Muñoz 2012). Spanish nationalists, in response to the outgroup threat posed by the 2017 independence referendum in Catalonia, adopted the practice of displaying the Spanish flag on balconies (Dinas et al. 2020). Opposition to Catalan independence has not been the only way in which the flag has been used in Spain in opposition to specific groups or causes. Other targets are, as I have explained above, the LGTBQ+ collective, feminists, and other issues associated with the ideological outgroup (such as Agenda, 2030 or squatters).
Within Spain, Murcia, a 1.5 M inhabitants’ Southern region, is probably the place where it is most interesting to see the comparative support for general measures of tolerance, concrete measures of acceptance of LGBTQ+ rights, and support for symbolic measures such as the exhibition of LGBTQ+ flags. This is because it is the first region where LGBTQ+ flags became politicized. It is also where Vox garnered the most votes in the two last general elections, 8 and where it has had the earliest entry into the institutions. 9 The government in Murcia was the first where Vox made some influence by passing policies such as the “parental PIN” in Murcia. 10 The parental PIN is a measure aimed at restricting the access of minors to gender equality and LGBTQ+ education.
A fortuitous circumstance allows us to make an initial comparison of support for different pro-LGBTQ+ measures in Murcia. This is due to the proximity in time of the fieldwork for the European Social Survey (ESS) in Spain, including Murcia, which asked about general and specific attitudes towards formal LGBTQ+ rights (“If a close family member was a gay man or a lesbian, I would feel ashamed,” “Gay men and lesbians should be free to live their own life as they wish,” “Gay male and lesbian couples should have the same rights to adopt children as straight couples”), and the survey conducted by the CEMOP public institute, affiliated with the University of Murcia, which asked a representative sample of Murcians their agreement with the prohibition of displaying gender equality and LGBTQ+ flags in public buildings (“The display of banners claiming gender equality, LGTBi rights or other similar issues on public buildings should be prohibited” 11 ). The ESS data was collected between January 21 and May 31, 2022, while the CEMOP data was collected from May 31 to June 8, 2022, without any disruptive events occurring during these intervals. Additionally, as observed in the Online Appendix, the populations have enough comparable characteristics such as gender, education level, age, and left-right positioning.
Figure 2 presents the comparison of LGBTQ+ attitudes among Murcian respondents. The results are quite revealing: When considering the overall support (summing up both strong and somewhat agreement), I observe that support for allowing LGBTQ+ flags in public buildings stands at 58.9%, more than 10 points behind support for same-gender adoption at 71.6%. In contrast, a substantial majority agrees with more general homopositive statements: a 87.8% say they would feel no shame if they had a non-heterosexual family member, and a 89.2% believe gays and lesbians should live their lives freely. Consistent with our expectations, these data clearly demonstrate that general LGBTQ+-positive attitudes differ from specific support for adoption, but also that adoption receives much more support than state-sponsored LGBTQ+ flags. Level of support for LGBTQ+ measures in Murcia, Spain. No shame and Flags were reversed for comparability matters. While ESS questions have five categories, CEMOP’s flag question has only four (they did not provide “neither agree nor disagree” as an option).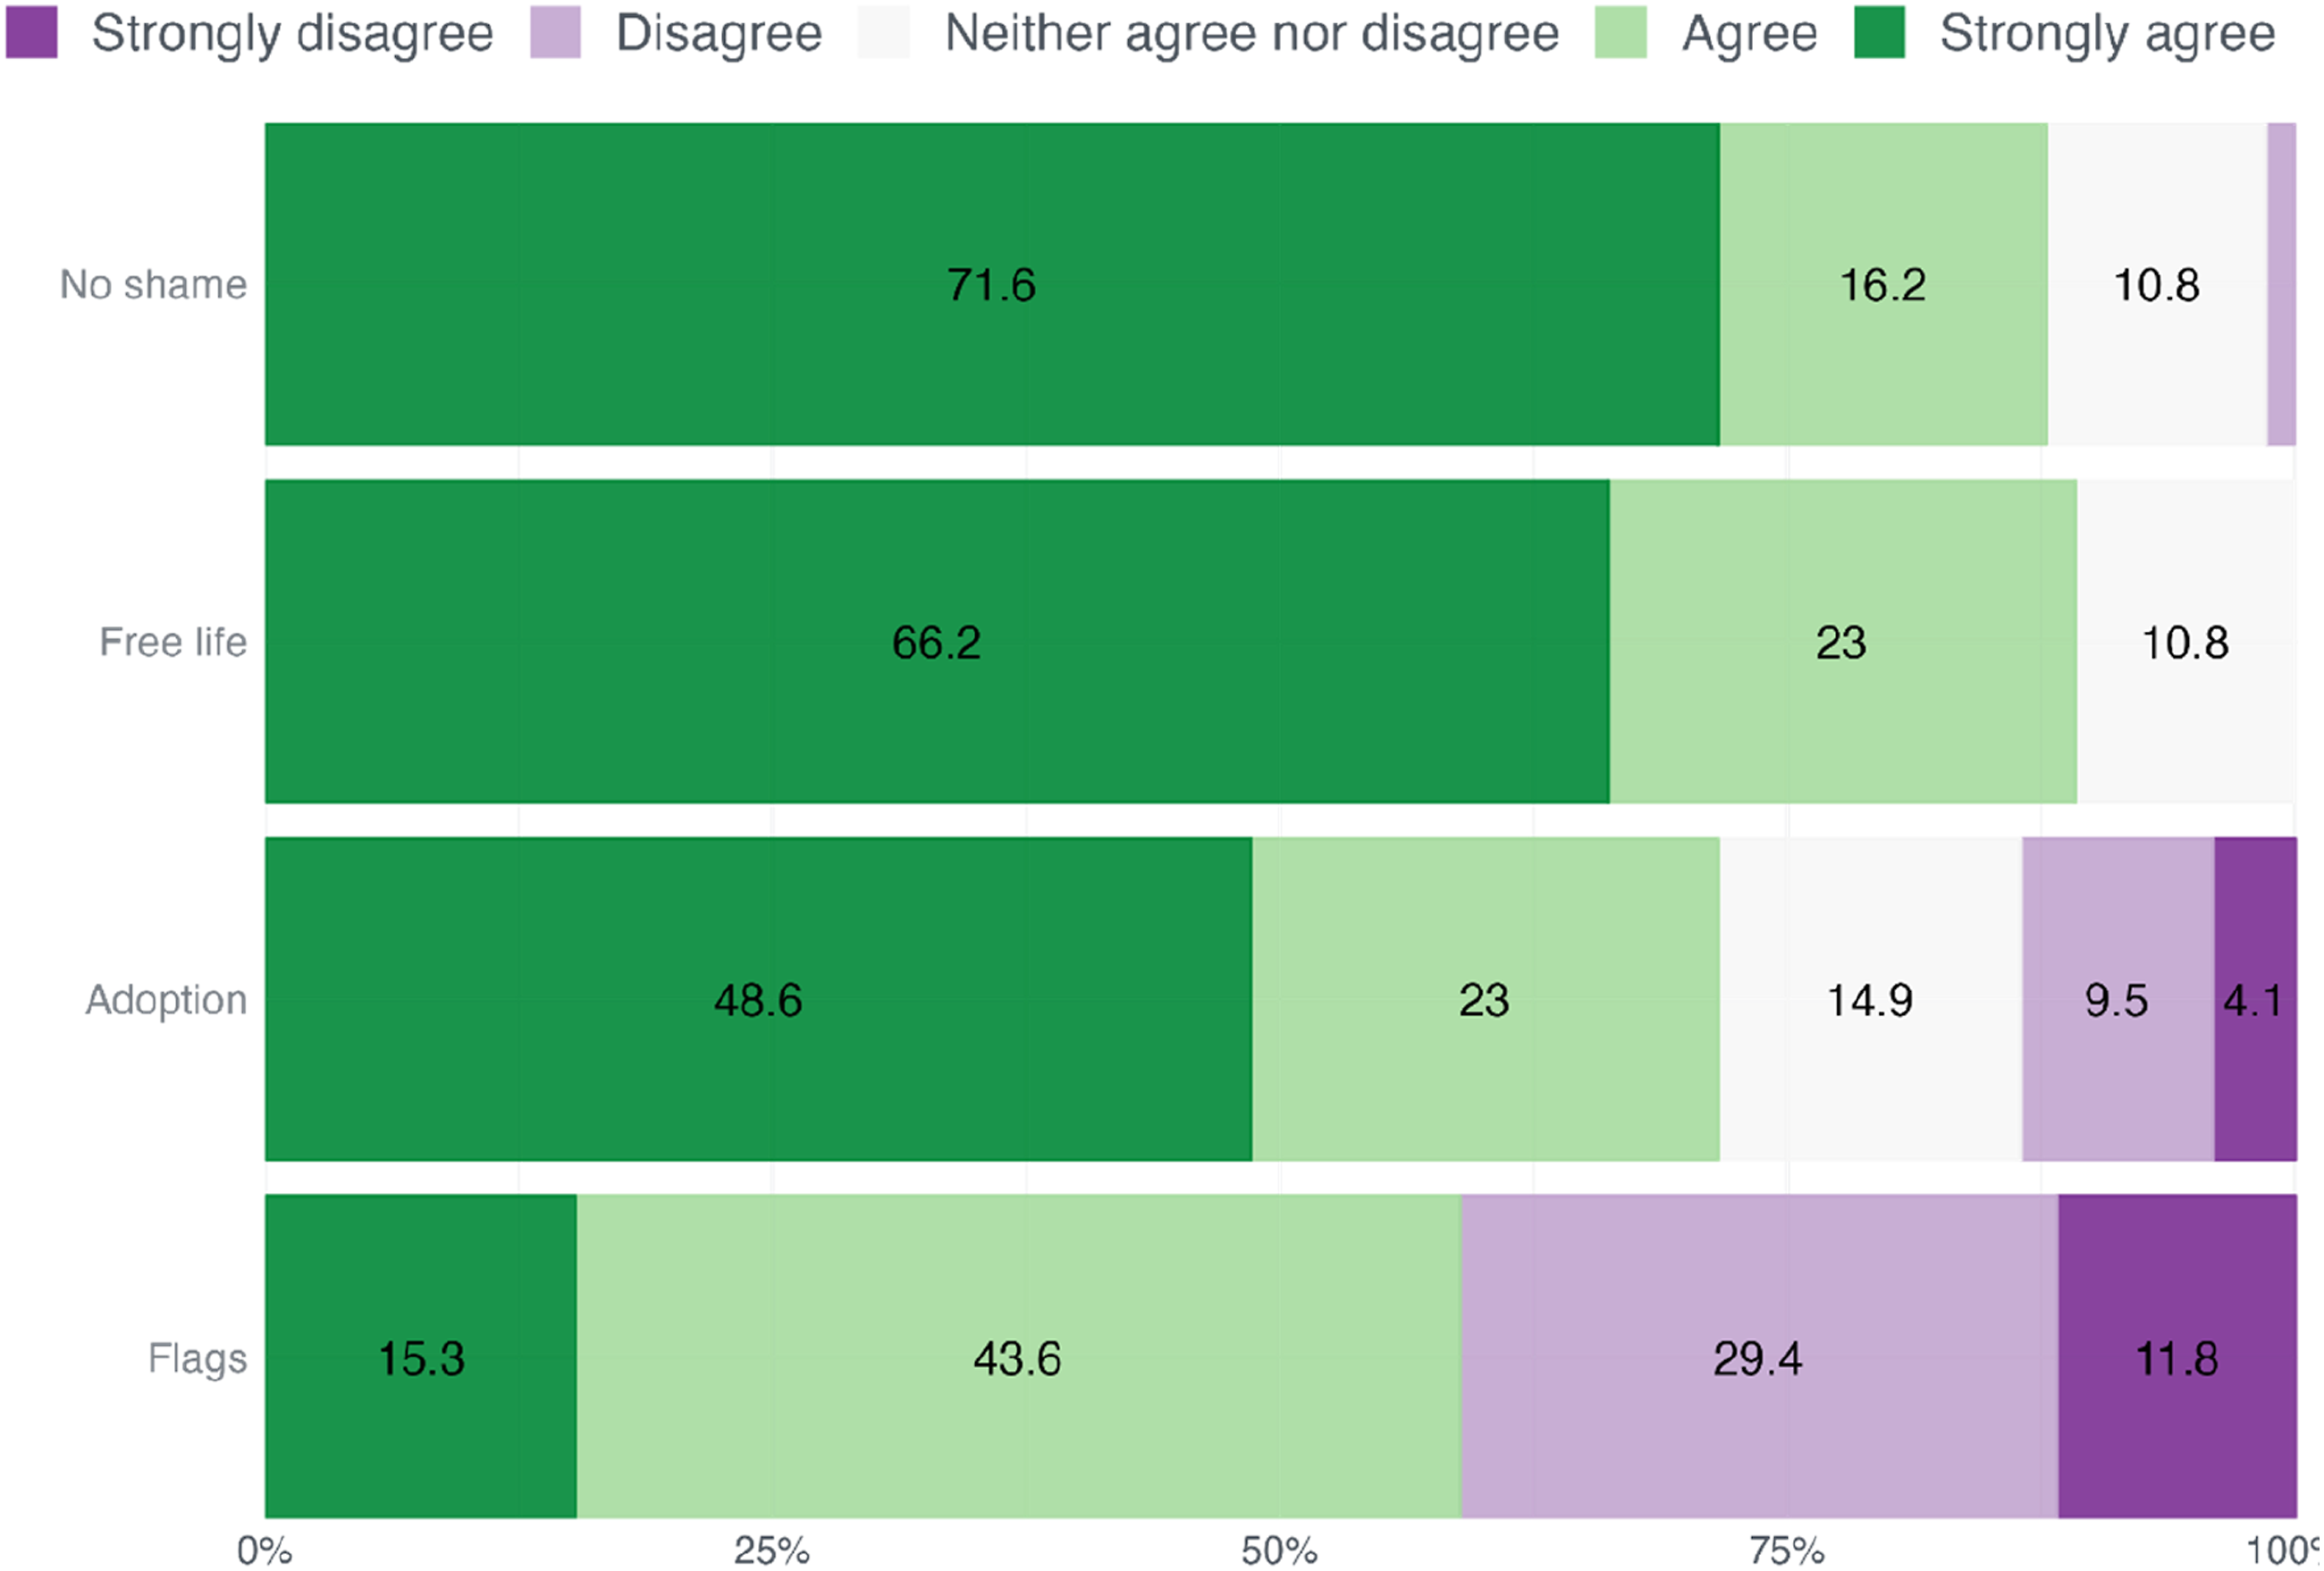
What are the predictors of opposition to state-sponsored LGBTQ+ flags? To answer this question, I focus on the data from the CEMOP survey and examine how variables that are usually correlated with more significant support for the LGBTQ+ community and their rights influence the rejection of LGBTQ+ flags.
I conducted a series of ordinal logistic regressions using the same 4-point Likert scale (covering “Strongly disagree,” “disagree,” “agree,” and “Strongly agree with the prohibition of the display of LGBTQ+ flags in official buildings). The CEMOP survey includes variables such as voting recall, voting intention, the evaluation of national-level candidates from each party (rated on a scale of 1–5), and the performance of each party in the Murcia region (although originally 0–10, rescaled to 1–5 for comparability reasons). I made four symmetrical ordinal logistic models varying the inclusion of each of these variables. This allows us to disentangle how robust relationships are irrespective of the operationalization of party liking. In the models where I used vote intention and vote recall centrist party Cs was set as the reference category. The remaining variables were consistent across all models: age, education, gender, self-reported ideological position, employment status, municipality size, and media consumption. The Online Appendix provides a comprehensive description of the variables and results.
Across all models, two variables stand out as predictors of support for the prohibition of LGBTQ+ flags: age and party proximity. Figure 3 presents the log odds for the party and age variables in the four models (for the detailed output, see the Online Appendix). In In the upper portion of the chart, regardless of the model, I observe that as age increases, the probability of holding negative attitudes toward the display of LGBTQ+ flags in public buildings also increases. Although the contrast between the age group of young individuals (18–31) and those aged 31–44 are largely insignificant respondents aged 45 and above consistently exhibit more favorable attitudes toward the prohibition of flags compared to younger individuals. This finding aligns with previous literature showing that younger people tend to have more accepting attitudes in general (Becker and Scheufele 2011; Kuntz et al., 2015). Although I cannot disentangle whether the effect is generated by age or cohort, previous signals that both effects could be in place at the same time. While it is quite consistent that younger people tend to be more open-minded towards LGBTQ+ issues than older people (Garretson 2015), attitudinal change is often quicker than cohort replacement can account for (Keleher and Smith 2012). Our results suggest that a similar age dynamic could apply to support LGBTQ+ symbolism. Odds ratios and 95%/90% confidence intervals of the odds ratio for opposition to LGBTQ+ symbolism.
In the lower section of the figure, which examines voting behavior and party evaluations, a distinct pattern emerges, particularly regarding Vox. Although not statistically significant in the party evaluation model, measures such as voting recall, voting intention, or the assessment of its leader, Santiago Abascal, consistently indicate that an affinity for Vox predicts opposition to LGBTQ+ flags. While the effect is less pronounced than that for Vox, the declared intention to vote for the mainstream right PP (compared to Cs) also emerges as a significant predictor (p = .01). In contrast, supporting left-wing UP and mainstream left PSOE is negatively or not associated with opposition to state-sponsored LGBTQ+ flags. These findings underscore a robust link between support for far-right parties and negative attitudes toward LGBTQ+ issues, corroborating previous research (Corrales and Kiryk, 2022). The specific predictive power of the intention to vote for PP, vis-a-vis voting recall, hints at the radical right’s influential pull on this electorate.
Some predictors show inconsistency, emerging as significant only in one or two models. These include media consumption and right-wing self-positioning, suggesting that partisanship might not fully capture the entire effect of ideology. Additionally, residing in a small town (with fewer than 50,000 inhabitants) also appears as a sporadic predictor. This finding resonates with recent studies indicating that individuals identifying with rural areas are less likely to support pro-LGBTQ+ policy measures compared to their non-rural counterparts (Thompson 2023). Interestingly, in the full models that include partisan variables, gender does not emerge as significant predictor. However, omitting partisan variables reveals both conservative media consumption (specifically regional La Verdad) and being a man (compared to being a woman) consistently appear as predictosr in all four models. The gender outcome resonates with studies highlighting a gender gap in voting for radical right parties (Antón-Merino et al. 2023; Immerzeel et al. 2015), suggesting that partisanship may mediate the gender differences in attitudes. Results also corroborate research on the impact of gender roles on men’s more conservative sexual attitudes (Burke et al., 2017; Gerhardstein and Anderson 2010) and media’s influence on LGBTQ+ attitudes (Mihelj et al., 2023). Yet, they also suggest that the inclusion of partisan variables overrides media and demographic predictors except for age, emphasizing the strong partisan nature of the opposition to LGBTQ+ symbolism.
Conclusion
In the last decade, researchers have argued that radical right parties and their supporters have moved towards “sexually modern nativism” (Lancaster 2020), and there is indeed a growing constituency of voters that express in surveys both anti-immigration and positive attitudes towards LGB formal rights (Lancaster 2022). Research also shows that when combined with populist attitudes, sexually modern nativists are more likely to vote for the radical right (Spierings et al. 2017). In a similar vein, a recent study found that in Germany LGBs are more likely to vote both for progressive parties and the AfD that their heterosexual counterparts (Wurthmann, 2023). The argument is that Western societies, in general, have embraced a form of “nationalized” gender and sexual liberalism that includes the defense of gender equality and LGBTQ+ freedoms (Lancaster 2022; Lægaard 2007). Consequently, it is contended, a significant segment of the Western radical right base combines anti-immigration stances with liberal positions on sexuality and gender.
The findings of this study suggest that prior perceptions of the radical right’s sexual and gender liberalism may not extend to the refusal to ban LGBTQ+ symbols in public buildings. The empirical results indicate that in contexts where radical right figures have politicized these symbols, opposition to LGBTQ+ symbols extends beyond radical right supporters to include even those who indicate willingness to vote a mainstream right-wing party such as PP. Overall, it is clear that attitudes toward state-sponsored LGBTQ+ flags receive relatively less support compared to other aspects of sexual and gender modernity such as equal marriage or adoption, which are usually associated with tolerance and a general tendency to embrace advances in rights.
These results bring light to an attitudinal phenomenon that is important because LGBTQ+ symbols represent respect and the safety of the group, while also bringing visibility to the LGBTQ+ community. The findings regarding age, in this sense, open the question of whether younger generations might bring more positive attitudes towards LGBTQ+ symbols. Additionally, it is unknown to what extent negative attitudes towards symbols represent covert forms of generalized prejudice towards LGBTQ+ individuals (Turnbull-Dugarte and López Ortega, 2023), as research on the “paradoxically” contradictory agenda of the radical right-wing movements suggests (Möser et al. 2022). Future research should delve into these questions in more detail, investigating attitudinal heterogeneity, including issues related to pride and symbolic representation.
Footnotes
Declaration of conflicting interests
The author(s) declared no potential conflicts of interest with respect to the research, authorship, and/or publication of this article.
Funding
The author(s) received no financial support for the research, authorship, and/or publication of this article.
Notes
Appendix
Full description of the items asked in the Ipsos 2021 LGBT+ survey
In the study, participants were asked to indicate their level of support or opposition to various scenarios relating to LGBT rights, visibility and representation.
The responses to the following items were structured across a five-point scale: “Strongly agree,” “Somewhat agree,” “Not sure,” “Somewhat agree,” “Strongly agree.” The scenarios presented included: • Same-sex couples should be allowed to marry legally • Same-sex couples should have the same rights to adopt children as heterosexual couples
The responses to the following items were structured across a five-point scale: “Strongly support,” “Tend to support,” “Neither support nor oppose,” “Tend to oppose,” and “Strongly oppose.” The scenarios presented included: • LGBT individuals being open about their sexual orientation or gender identity with everyone. • LGBT individuals displaying affection in public, such as kissing or holding hands. • The inclusion of openly lesbian, gay, and bisexual athletes in sports teams. • An increase in LGBT characters in television shows, films, and advertising.
For the purpose of graphical representation and analysis, the responses were collapsed into a simpler format. The categories of “Strongly agree,” “Somewhat agree,” “Strongly support,” and “Tend to support” were combined into a single category, visually represented as bars in Figure 2 in the main text.
Summary table of CEMOP and ESS (Murcia) statistic.
Variable
Values
ESS (Murcia) frequencies
CEMOP frequencies
Gender [factor]
Man
32
43.2%
403
49.1%
Woman
42
56.8%
417
50.9%
Education level [character]
1. Primary education or less
10
13.7%
156
19.4%
2. Secondary education
24
32.9%
232
28.8%
3. University or more
30
41.1%
242
30.0%
4. Vocational education
9
12.3%
176
21.8%
Age [character]
1. 18–30
18
24.3%
154
18.8%
2. 31–44
18
24.3%
213
26.0%
3. 45–64
29
39.2%
295
36.0%
4. >65
9
12.2%
158
19.3%
Left-right [numeric]
Mean: 5.5
SD: 2.6
Mean: 5.9
SD: 2.2
Ordinal logistic regressions for opposition to LGBTQ+ symbolism (odds ratios).
Term
Contrast
Vote intention model
Vote recall model
Candidate model
Party model
Gender
Woman
−0.328 (0.174)
−0.328 (0.174)
−0.328 (0.174)
−0.328 (0.174)
edu
Secondary education
−0.12 (0.291)
−0.12 (0.291)
−0.12 (0.291)
−0.12 (0.291)
edu
University or more
−0.194 (0.288)
−0.194 (0.288)
−0.194 (0.288)
−0.194 (0.288)
edu
Vocational education
−0.138 (0.293)
−0.138 (0.293)
−0.138 (0.293)
−0.138 (0.293)
age
31–44
0.433 (0.271)
0.433 (0.271)
0.433 (0.271)
0.433 (0.271)
age
45–64
1.16*** (0.275)
1.16*** (0.275)
1.16*** (0.275)
1.16*** (0.275)
age
>64
1.425** (0.507)
1.425** (0.507)
1.425** (0.507)
1.425** (0.507)
size_town
0–10k
−0.259 (0.41)
−0.259 (0.41)
−0.259 (0.41)
−0.259 (0.41)
size_town
10–50k
−0.282 (0.202)
−0.282 (0.202)
−0.282 (0.202)
−0.282 (0.202)
size_town
50–300k
−0.189 (0.232)
−0.189 (0.232)
−0.189 (0.232)
−0.189 (0.232)
work_situation
Private worker
0.303 (0.339)
0.303 (0.339)
0.303 (0.339)
0.303 (0.339)
work_situation
Public worker
−0.201 (0.288)
−0.201 (0.288)
−0.201 (0.288)
−0.201 (0.288)
work_situation
Retired
−0.272 (0.411)
−0.272 (0.411)
−0.272 (0.411)
−0.272 (0.411)
work_situation
Student
−0.115 (0.387)
−0.115 (0.387)
−0.115 (0.387)
−0.115 (0.387)
work_situation
Unemployed
−0.043 (0.274)
−0.043 (0.274)
−0.043 (0.274)
−0.043 (0.274)
left_right
0.281*** (0.05)
0.281*** (0.05)
0.281*** (0.05)
0.281*** (0.05)
left_right_dad
−0.058 (0.054)
−0.058 (0.054)
−0.058 (0.054)
−0.058 (0.054)
left_right_mum
0.079 (0.059)
0.079 (0.059)
0.079 (0.059)
0.079 (0.059)
info_socialmedia
0.052 (0.056)
0.052 (0.056)
0.052 (0.056)
0.052 (0.056)
info_whatsapp
0.002 (0.073)
0.002 (0.073)
0.002 (0.073)
0.002 (0.073)
info_laverdad
0.171* (0.072)
0.171* (0.072)
0.171* (0.072)
0.171* (0.072)
info_laopinion
−0.112 (0.076)
−0.112 (0.076)
−0.112 (0.076)
−0.112 (0.076)
info_siete
−0.062 (0.059)
−0.062 (0.059)
−0.062 (0.059)
−0.062 (0.059)
info_lasexta
0.085 (0.062)
0.085 (0.062)
0.085 (0.062)
0.085 (0.062)
Performance of the ordinal regression models.
AIC
BIC
RMSE
Sigma
AIC
Vote intention model
1049.99
2.24
2.34062392127994
928.003193548642
Vote recall model
988.20
2.22
2.32630180284658
868.167294187788
Candidate evaluation model
612.97
2.25887647603703
2.44942234485742
505.262401471556
Party evaluation model
518.73
2.02383860107437
2.24626397738874
418.385659631967
Summary of other variables used in regression models.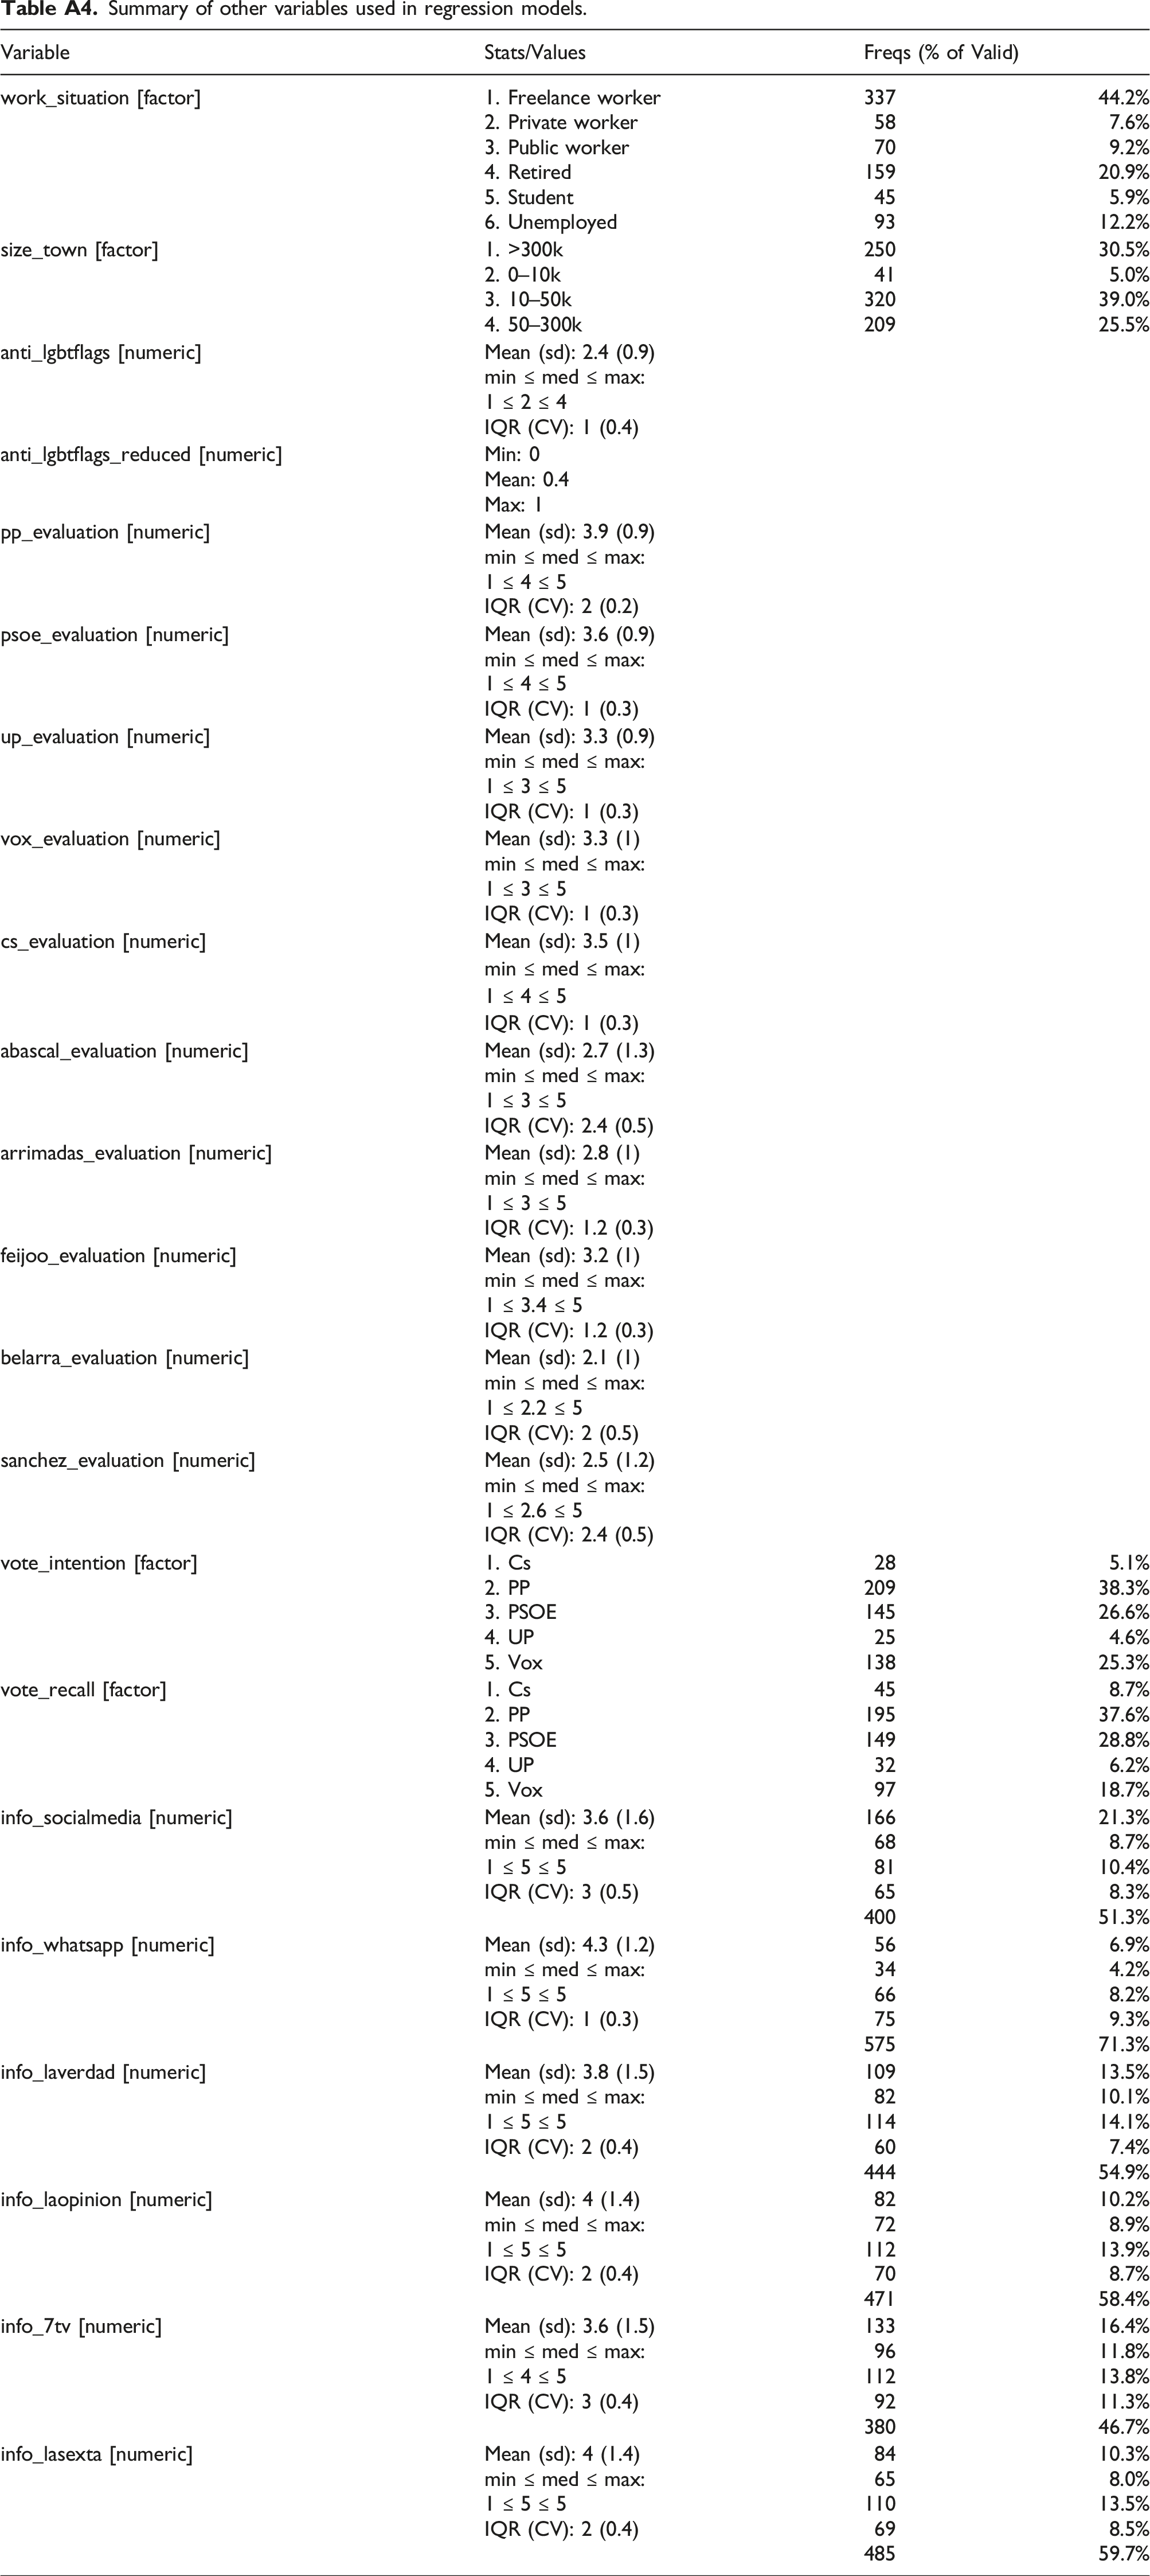
Variable
Stats/Values
Freqs (% of Valid)
work_situation [factor]
1. Freelance worker
337
44.2%
2. Private worker
58
7.6%
3. Public worker
70
9.2%
4. Retired
159
20.9%
5. Student
45
5.9%
6. Unemployed
93
12.2%
size_town [factor]
1. >300k
250
30.5%
2. 0–10k
41
5.0%
3. 10–50k
320
39.0%
4. 50–300k
209
25.5%
anti_lgbtflags [numeric]
Mean (sd): 2.4 (0.9)
min ≤ med ≤ max:
1 ≤ 2 ≤ 4
IQR (CV): 1 (0.4)
anti_lgbtflags_reduced [numeric]
Min: 0
Mean: 0.4
Max: 1
pp_evaluation [numeric]
Mean (sd): 3.9 (0.9)
min ≤ med ≤ max:
1 ≤ 4 ≤ 5
IQR (CV): 2 (0.2)
psoe_evaluation [numeric]
Mean (sd): 3.6 (0.9)
min ≤ med ≤ max:
1 ≤ 4 ≤ 5
IQR (CV): 1 (0.3)
up_evaluation [numeric]
Mean (sd): 3.3 (0.9)
min ≤ med ≤ max:
1 ≤ 3 ≤ 5
IQR (CV): 1 (0.3)
vox_evaluation [numeric]
Mean (sd): 3.3 (1)
min ≤ med ≤ max:
1 ≤ 3 ≤ 5
IQR (CV): 1 (0.3)
cs_evaluation [numeric]
Mean (sd): 3.5 (1)
min ≤ med ≤ max:
1 ≤ 4 ≤ 5
IQR (CV): 1 (0.3)
abascal_evaluation [numeric]
Mean (sd): 2.7 (1.3)
min ≤ med ≤ max:
1 ≤ 3 ≤ 5
IQR (CV): 2.4 (0.5)
arrimadas_evaluation [numeric]
Mean (sd): 2.8 (1)
min ≤ med ≤ max:
1 ≤ 3 ≤ 5
IQR (CV): 1.2 (0.3)
feijoo_evaluation [numeric]
Mean (sd): 3.2 (1)
min ≤ med ≤ max:
1 ≤ 3.4 ≤ 5
IQR (CV): 1.2 (0.3)
belarra_evaluation [numeric]
Mean (sd): 2.1 (1)
min ≤ med ≤ max:
1 ≤ 2.2 ≤ 5
IQR (CV): 2 (0.5)
sanchez_evaluation [numeric]
Mean (sd): 2.5 (1.2)
min ≤ med ≤ max:
1 ≤ 2.6 ≤ 5
IQR (CV): 2.4 (0.5)
vote_intention [factor]
1. Cs
28
5.1%
2. PP
209
38.3%
3. PSOE
145
26.6%
4. UP
25
4.6%
5. Vox
138
25.3%
vote_recall [factor]
1. Cs
45
8.7%
2. PP
195
37.6%
3. PSOE
149
28.8%
4. UP
32
6.2%
5. Vox
97
18.7%
info_socialmedia [numeric]
Mean (sd): 3.6 (1.6)
166
21.3%
min ≤ med ≤ max:
68
8.7%
1 ≤ 5 ≤ 5
81
10.4%
IQR (CV): 3 (0.5)
65
8.3%
400
51.3%
info_whatsapp [numeric]
Mean (sd): 4.3 (1.2)
56
6.9%
min ≤ med ≤ max:
34
4.2%
1 ≤ 5 ≤ 5
66
8.2%
IQR (CV): 1 (0.3)
75
9.3%
575
71.3%
info_laverdad [numeric]
Mean (sd): 3.8 (1.5)
109
13.5%
min ≤ med ≤ max:
82
10.1%
1 ≤ 5 ≤ 5
114
14.1%
IQR (CV): 2 (0.4)
60
7.4%
444
54.9%
info_laopinion [numeric]
Mean (sd): 4 (1.4)
82
10.2%
min ≤ med ≤ max:
72
8.9%
1 ≤ 5 ≤ 5
112
13.9%
IQR (CV): 2 (0.4)
70
8.7%
471
58.4%
info_7tv [numeric]
Mean (sd): 3.6 (1.5)
133
16.4%
min ≤ med ≤ max:
96
11.8%
1 ≤ 4 ≤ 5
112
13.8%
IQR (CV): 3 (0.4)
92
11.3%
380
46.7%
info_lasexta [numeric]
Mean (sd): 4 (1.4)
84
10.3%
min ≤ med ≤ max:
65
8.0%
1 ≤ 5 ≤ 5
110
13.5%
IQR (CV): 2 (0.4)
69
8.5%
485
59.7%