
Abstract
Recent studies have documented large discrepancies between mass preferences and policies in U.S. states consistent with theories that highlight the oversized influence of affluent Americans on policymaking. In this note, we replicate and extend a recent such study (Simonovits, Guess, and Nagler, 2019) to assess how policy bias evolves in time. Specifically, relying on novel data and methods, we construct measures of minimum wage preferences and compare them to observed policies in each state for the years of 2014, 2016, 2019, and 2021. We demonstrate that, averaged across states, policy change closely tracked a pronounced increase in preferences for higher minimum wages, but the size of policy bias remained relatively stable. However, this national pattern hides an increasingly polarized policy landscape: in many states, insufficient responsiveness led to an increasing deviation between preferences and policies, while in other states policy changes—larger than preference changes—closed initial policy bias.
To what extent do public policies set by U.S. states reflect mass preferences? Some recent studies have documented large deviations between public opinion and public policies across a range of issue domains (Lax and Phillips, 2012) driven by a combination of the outsized influence of the wealthy (Gilens and Page, 2014; Simonovits et al., 2019) and partisan biases in responsiveness(Lax et al., 2019). However, to our knowledge all studies that collected the data necessary to compare state policies and opinions on the same scale—a feature necessary to quantify policy bias—have used cross-sectional data. 1 Thus, an important question left open in this literature is whether such “gaps of representation” are eventually closed as a result of state legislators responding to mass opinion.
Providing evidence on the dynamic relationship between average preferences and policies is challenging for two separate reasons. First, in order to compare preferences and policies on the same scale, one needs to collect data on the two which are measured on the same scale. Second, the units of analysis (i.e., states) need to be observed repeatedly so that dynamics can be studied. To our knowledge, no such studies exist. Instead, studies have explored the related question of whether changes in preferences are correlated with corresponding policy change (Caughey and Warshaw, 2018). However, policy could move in the same direction with mass opinion and stay far removed from it so long as initial divergence is large and/or the degree of policy change is insufficient. Moreover, a focus on responsiveness limits attention to the average relationship between preferences and policies, and as such using it as an evaluative standard is likely to mask important heterogeneities across states.
In this paper, we deploy a research design and marshal data that allows us to precisely describe the dynamic relationship between mass opinion and policy—at least in one specific issue domain. We replicate and expand a recent study by Simonovits et al. (2019) to explore if its conclusion—a pronounced and uniform conservative bias—has stood. Our analysis relies on seven national surveys fielded between 2014 and 2021 that measure preferences about the minimum wage in U.S. dollars. Using an augmented Bayesian dynamic multilevel model with post-stratification (MRP), we obtain estimates of average preferences for each U.S. state in the years 2014, 2016, 2019, and 2021 and match the resulting data with minimum wage laws in the same years. As we measure preferences and policies on the same scale, we can assess the dynamics of representation in each state simply by tracking policy bias (the deviation between preferences and policies through time).
We report three key findings. First, on average the representation of mass preferences in minimum wages has stayed quite stable across the 7 years we study. Averaged across states, the difference between average preferences and policies hovered 1.4 and 2.3 dollars, despite a pronounced upward trend in mass preferences. Second, we find that the association between state preferences and state policies increased over time, likely reflecting a large number of legislative changes. 2 Third, considering variation across states, we find a great degree of heterogeneity despite the short-span of our study: in many states, legislative inaction together with increasing support for higher minimum wages has led to significantly increasing gaps between preferences and policies. In contrast, other states have seen overly responsive policy-making that led to a significant improvement of representation, at least on the short run. Taken together, our findings point to the importance of using measures of representation that can uncover important differences across states.
Taken together, these findings showcase the importance of replicating descriptive findings in political economy. In the absence of such replications, there is no way for us to know if classic results of representation still characterize well the empirical relationship between public opinion and public policy. Insofar as we care not only about qualitative (e.g., preferences and policy outcomes are correlated) but also quantitative patterns (e.g., minimum wages are about $2 lower than preferences), this issue is all the more acute. Our approach reveals important changes in the opinion–policy relationship despite studying it within a relatively short time period suggesting that similar replications could overturn conventional wisdom across a wider range of contexts.
Research design
Our empirical analysis explores the relationship between average preferences about the minimum wage and corresponding state laws between 2014 and 2021. Our focus on a single policy issue—rather than a composite measure of policies—spanning a relatively short time period comes with the cost of limited generalizability; how much and how fast policies respond to changes in public opinion might be different in other periods or for other policies.
At the same time, our design also comes with distinct advantages. First, the minimum wage is a highly salient issue, which—we believe—may be prone to short-term changes due to changes in consumer prices. For example, if a citizen notices that rents went up substantially in their hometown, they could plausibly update their belief whether it’s possible to make ends meet on the current minimum wage. Second, minimum wage laws are changed relatively frequently and easily. Case in point, during the period we study 13 statewide ballot initiatives have been voted on. In short, minimum wages constitute a most likely case for policies that closely track changes in public opinion. Finally, quantifying representation on this issue is easy as changes in policies and preferences can be measured on a meaningful and comparable cardinal scale.
Data
We rely on seven national surveys where respondents were asked to express their preferred levels of the minimum wage in dollars. We report detailed information about the datasets—including question wording, summary statistics, and minor coding decisions—in Section A in the Online Appendix (OA). In the "supersurvey” we created from these data, we have 21,951 observations from 15,635 unique respondents. We use the following demographic covariates in our analyses: age (4 categories), sex (2 categories), education (5 categories), race/ethnicity (2 categories), and state of residence (51 categories including Washington DC).
Thereby, our models identify 4 ⇥ 2 ⇥ 5 ⇥ 2 ⇥ 51 = 4080 types of U.S. citizens. Our models also include year of survey (4 categories), and an interaction between state and year (204 categories). As a state-year level smoother, we rely on Presidential election results using simple linear intrapolation to estimate the state-level two-party vote share of the Democratic party in November prior to data collection. For example, while for the 2021 data, we rely on the 2020 November vote, for 2014, we estimate 2013 vote as the weighted average of 2012 and 2016 elections (with weights of 0.25 and 0.75, respectively).
Note that the seven surveys diverge in terms of size, mode, and sampling. In particular, five of the seven surveys rely on online opt-in panels. However, because we rely on multilevel modeling and post-stratification, our state-level estimates of public opinion will approximate true state-level preferences as long as inclusion to these samples is ignorable to our dependent variable—that is, minimum wage preferences—conditional on the demographic variables we include in our models. We also note that recent work (Simonovits and Payson, 2023; Wang et al., 2015) has used online samples and MRP to successfully approximate election results as well as minimum wage preferences in cities.
For the second stage of our estimation, we rely on U.S. Census microdata from the American Community Surveys (ACS) (Ruggles et al., 2020). We use 5-year samples for each year prior to our data collection when it is available (thus 2013, 2015, and 2018). For the 2021 data, we rely on the most recent 5-year ACS available, that is, 2019 data. We aggregate these microdata to compute the frequency of each category of citizens.
Estimating state-level preferences
To obtain state-specific preferences for each of the four years we study, we follow recent literature (Ghitza and Gelman, 2013; Lax and Phillips, 2012) and utilize multilevel regression and post-stratification (MrP). Our model is non-standard in that we predict opinion on a cardinal scale, and we are among the first few in the literature to explore changes in public opinion (Gelman et al., 2016). Using cardinal minimum wage preferences poses an important challenge as the distribution of preferences is bi-modal. The majority of preferences is centered around $11, but a minority of respondents would abolish state minimum wage policies and therefore indicate a preference of $0. Simple linear models are unable to account for this distribution underestimating the frequency of $0 preferences and provide overly confident estimates. Instead, we build our model in two steps. First, a multilevel logistic regression predicts whether participants want a state minimum wage or not (i.e., prefer $0 or not). Second, a multilevel linear regression predicts the level of minimum wage preference among respondents who want to have (a non-zero) state minimum wage (N = 19,860). Figure OA1 in the Online Appendix displays coefficient estimates from our final models. Section C.4 in the OA demonstrates that combining two regression models does not lead to estimates that are different from those obtained through a simpler linear regression model.
Both logistic and linear models account for the temporal dynamics of public opinion by including year and state-year variables. Our approach is superior to running separate models for each year because it allows partial pooling across time. This step is also crucial for estimating state-level minimum wage preferences from surveys with only federal minimum wage preferences. Moreover, Democratic vote share also varies across both states and years, and thus, we can use it to pool information about time trends. We demonstrate the superior performance of models with (vs without) Democratic vote share in OA Section C.3.
Finally, our models include a random intercept representing responses to questions on the state versus the federal minimum wage. In the two surveys where we measured both preferences (for the years 2014 and 2016), we use both responses of each respondent, and the random intercept estimates the average difference between state and federal minimum wage preferences. We then use this estimate to extrapolate state-level preferences in the 2014 surveys. We are confident that this extrapolation yields valid estimates for two reasons. First, respondents overwhelmingly indicated similar preferences for federal and state-level minimum wages, evident in the fact that the coefficient estimate for the item was 0 in both models. Second, we explored if the gap in federal and state-level preferences is different across states but found that accounting for this potential heterogeneity does not improve our model fit.
We build our multilevel models in RStanArm, an R library implementing Stan software’s full Bayesian statistical inference with MCMC sampling. Bayesian analysis has two main advantages: first, weakly informative priors help even very complex multilevel models (like ours) to converge. Second, the simulations result in posterior draws for each of our parameters, and thus, we can also obtain posterior distributions for minimum wage preference for all possible combinations of our independent variables (demographic groups, states, and years). In essence, our analysis yields two posterior distributions for all 4,080 types of U.S. citizens in each of our 4 years: the share of respondents within the category whose preference is $0 and the average preference for those whose preference is non-0. We multiply these two posterior distributions to arrive at a combined minimum wage preference estimate. Finally, these estimates are weighted (post-stratified) to the U.S. Census to account for the unique demographic composition of each state in each year and are aggregated to state-years to obtain our MrP estimates of average preferences in each state and year pair. These estimates are themselves posterior distributions and therefore allow us to quantify and propagate uncertainty in our reports. Credible intervals are reported in [square brackets]. We describe our model specification as well as our priors in Section B.1 in the OA. Recent methodological advances in the literature highlight the complexity of MRP model validation and the limitations of traditional approaching using leave-one-out cross-validation (Kuh et al., 2022). Accordingly, in Section C.3 of the OA, we present evidence of the validity of our state-level estimates relying primarily on theoretically relevant external data. Both across and within states, we observe a strong correlation between our estimates and rental prices as well as preferences regarding the national minimum wage as measured by the Cooperative Congressional Election Study (CCES).
Our goal is to explore the evolution and dynamic relationship between public opinion about the minimum wage and corresponding policies in each state. To do so, we use the repeated measures obtained from the MrP procedure and merge the panel dataset of average preferences with corresponding data on the minimum wage laws that were in place in each U.S. state in the years 2014, 2016, 2019, and 2021. Based on these data, we can compute policy bias—the deviation between average preferences and policies in each state (Simonovits et al., 2019).
Results
We first consider the relationship between preferences and policies in each year included in our study. The four panels in Figure 1 plot state policies in 2014, 2016, 2019, and 2021 against average preferences in the corresponding states and years. Three clear patterns stand out. First, in each year, we observe a substantive conservative policy bias; almost every point in our figure is below the diagonal. Second, in each of the four years, policies were strongly related to variation in preferences; states with preferences for higher minimum wages had on average more generous policies.
3
Finally, the relationship between minimum wages as corresponding average preferences across states is becoming steeper: the minimum wage difference associated to a $1 difference in preferences grew from 72 cents (90% CI [0.57, 0.87]) in 2014 to $2.26 (95% CI [1.90, 2.63]) in 2021. Static policy responsiveness (2014–2021). Note: Each state is denoted with a point. Black lines represent the diagonals—so that dots below the diagonal indicate conservative policy bias in a state. Blue lines show linear trends.
While the results reported so far concern cross-sectional comparisons between states with lower versus higher preferences, our data also allows to estimate the association between changes in preferences and changes in policy outcomes. To obtain an estimate of such dynamic association between preferences and policies we regressed minimum wages on preferences while including state-fixed effects, thereby restricting our analysis to within-state variation. We find that for a dollar change in preferences between two surveys, policies changed by 70 cents on average (90% CI [0.53, 0.89]).
These results suggest that on average state-house democracy performed well in this time period. That said, it is informative to look beyond the average responsiveness. Accordingly, we continue our analyses by disaggregating temporal variation in responsiveness state-by-state. Figure 2 plots our estimates of average preferences (x-axis) against the policies for each U.S. state. Vertical bars around each point denote 90% highest density continuous intervals. More biased policies (those further from the diagonal denoting congruence between preferences and policies) are denoted with darker shades of gray. The trajectory of U.S. minimum wage preferences and policies between 2014 and 2021. Note: For each state, markers plot estimated minimum wage policies against corresponding average preferences (and 90% credible intervals) across years. The solid lines represent the diagonals—so that dots below the diagonal indicate conservative policy bias in a state.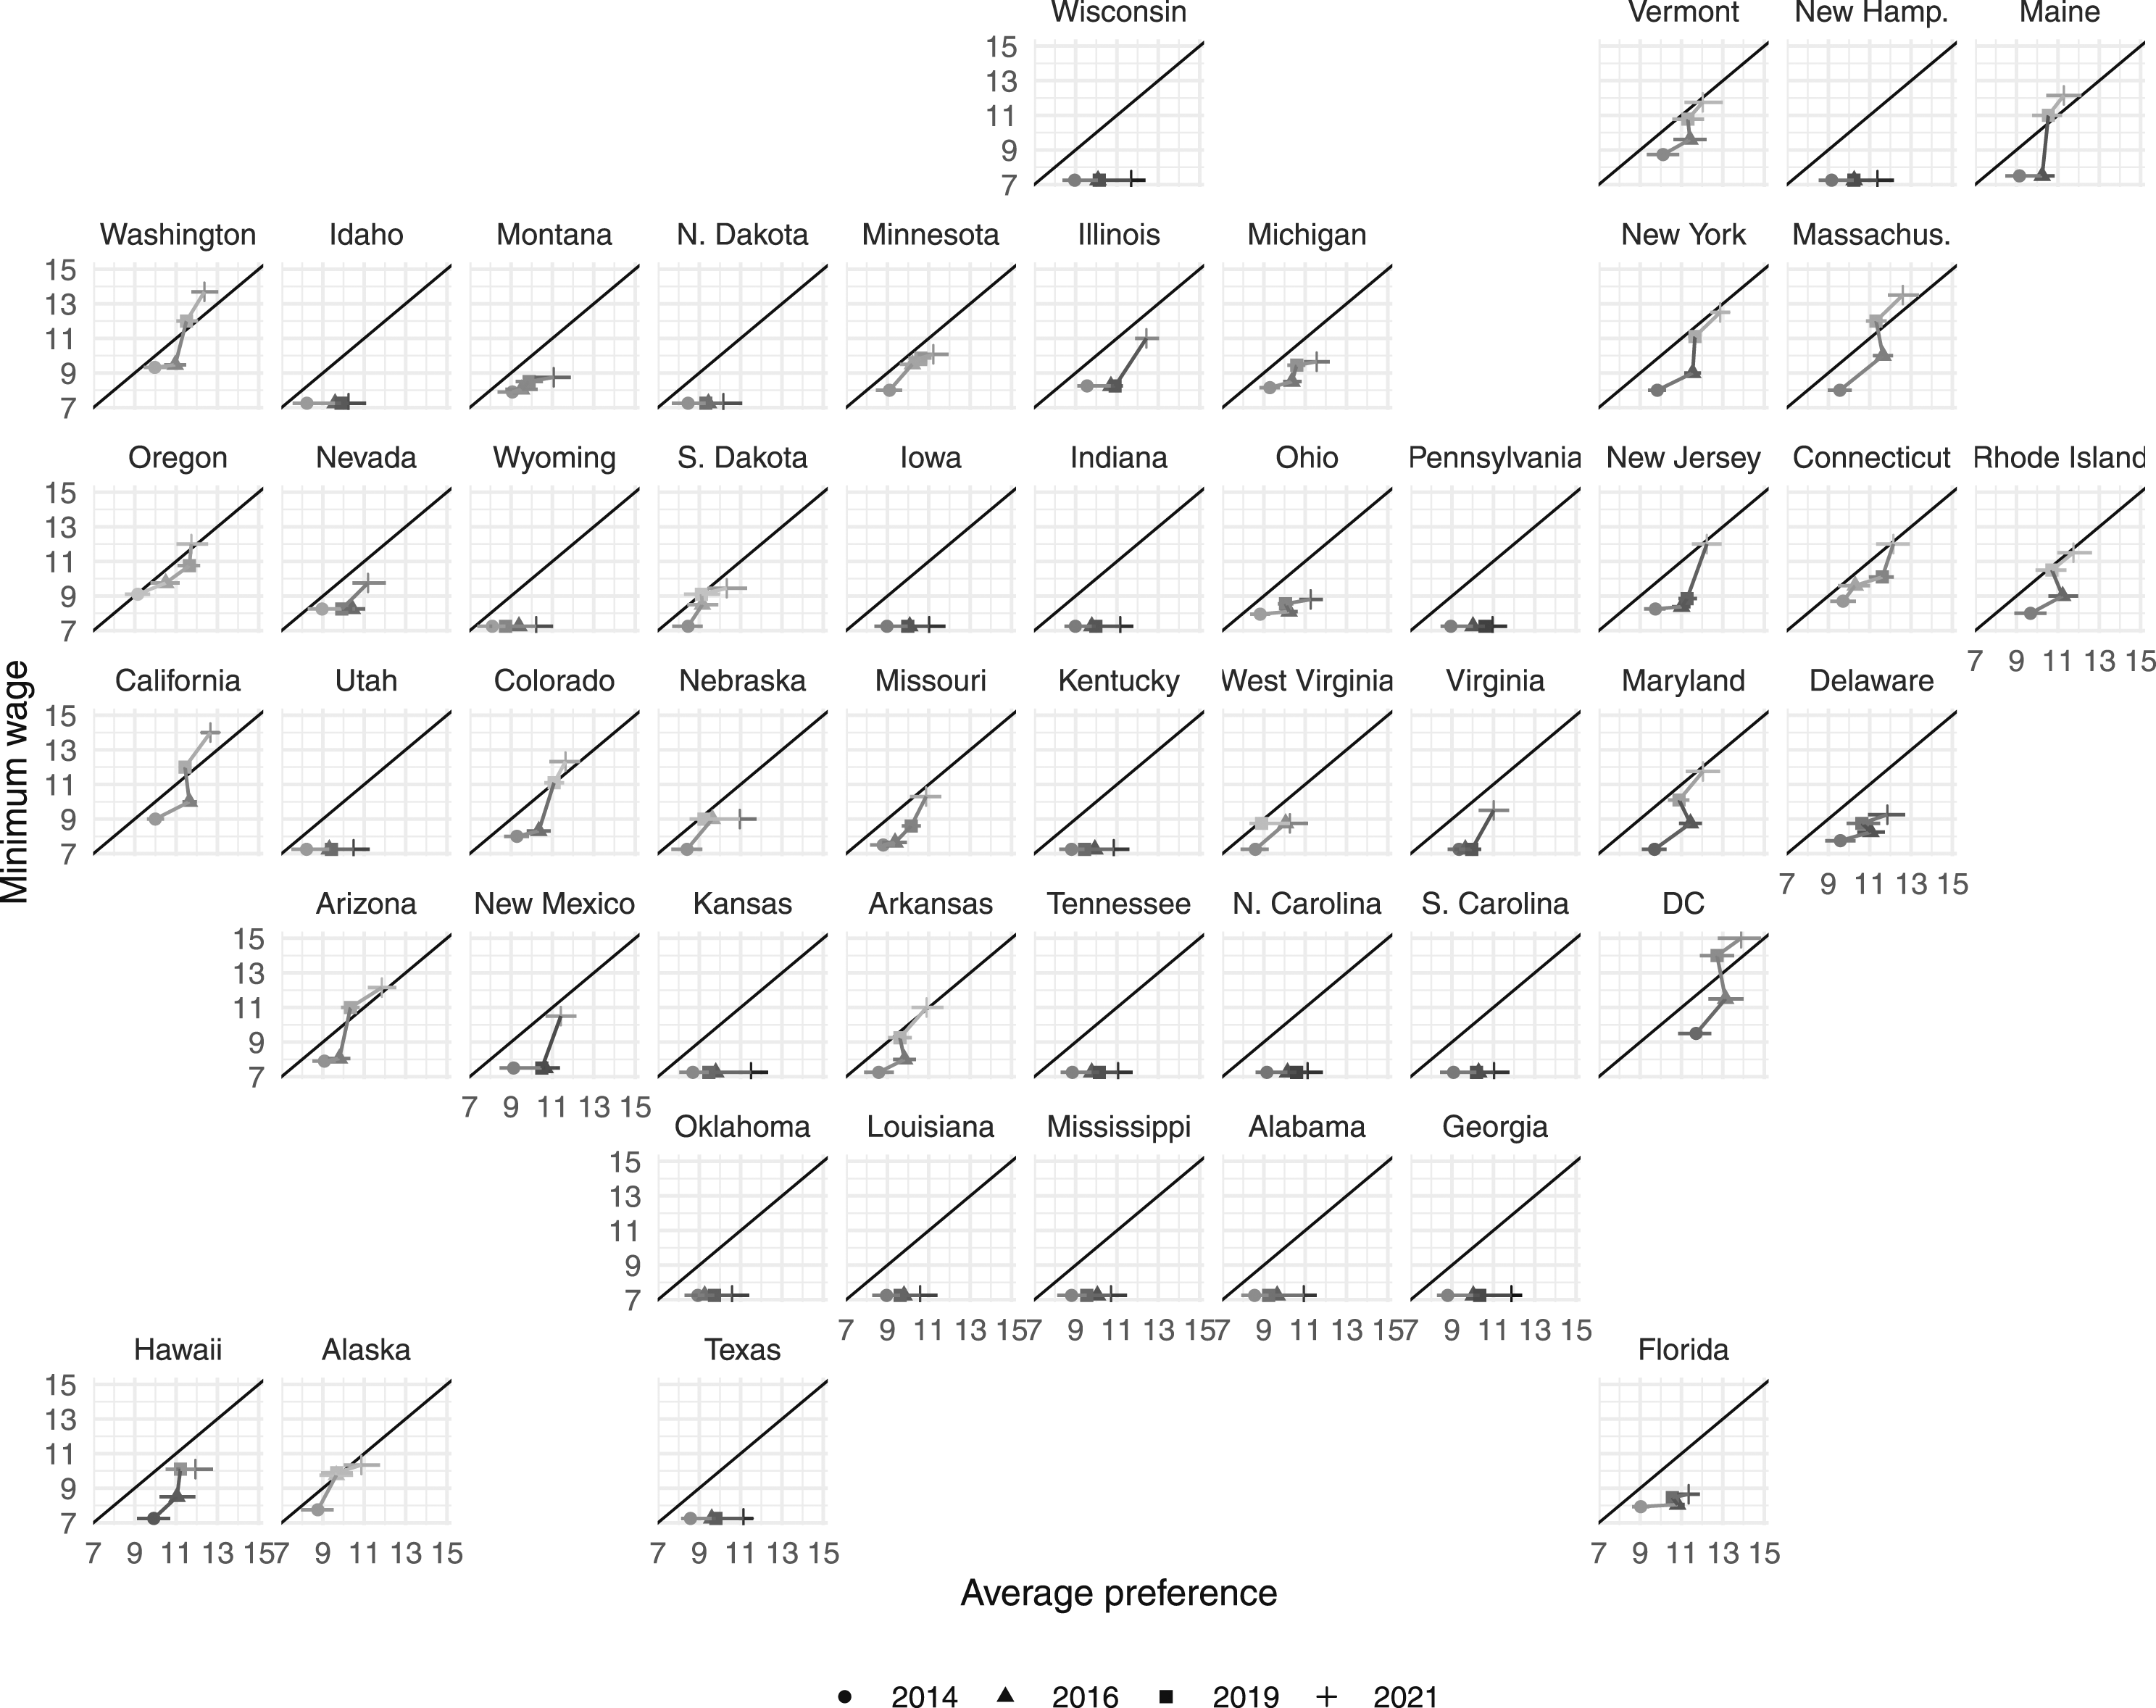
A number of notable lessons emerge. First, preferences are monotonically increasing in almost all states, on average by $2.3. We observe the largest increase in Massachusetts ($3.2, 90% CI [2.3, 4.2]) and the smallest in Oklahoma ($1.5, 90% CI [0.3, 2.4]). Second, the median minimum wage across states also steadily increased (medians: 2014–$7.25; 2016–$8.05; 2019–$8.5; 2021–$9.25) on average by a similar amount than preferences (mean change = $1.8), yet this average change masks a much larger heterogeneity across states: in 20 states—notably in Southern United States—policy does not change at all, either for the lack of a state minimum wages (e.g., Alabama and Louisiana) or for a reluctance of state legislatures to change them (e.g., Texas and Utah). In other states (e.g., in Virginia, Illinois), policy is changed only once in the 7 years of our study period, thereby creating an ebb and flow in policy bias. Finally, a third group of states has updated policies regularly, yielding a relatively stable policy bias (e.g., Oregon and Connecticut). In short, Figure 2 warns us that it is not easy to summarize the diversity of preference-policy trajectories with just a single estimate of policy responsiveness.
Figure 3 summarizes these patterns by exploring temporal variation in policy bias. It shows that the median bias hovered around $1–2 throughout our study period: it grew from $1.4 (90% CI [0.9, 2.0]) in 2014 to $2.3 (90% CI [1.7, 2.9]) in 2016, then decreased to $1.8 (95% CI [1.2, 2.4]) in 2019, and stagnated with a bias of $1.9 (90% CI [1.1, 2.7]) in 2021. Meanwhile, policy bias in minimum wage laws also reflects an increasing polarization in the United States. The range in median biases grew steadily from $2.6 in 2014 to $3.2 in 2016, $4.6 in 2019 and $6.0 in 2021. No state had a liberal bias in 2014, and the smallest conservative bias was in Oregon at $0.04. By 2021, nine states (AZ, AR, CA, CO, DC, ME, MA, OR, and WA) had a liberal policy bias. The divergence of policy bias between 2014 and 2021. Note: Thin lines denote policy bias (i.e., the signed difference between preferences and policy) in each state, with negative values indicating conservative policy bias. The thick line is the national average policy bias weighted by state population size. The error bars denote 67%, 89%, and 97% credible intervals, respectively.
Exploring the possible factors behind these differences, we explored the role of two differences across states (see Online Appendix C). First, we compared the evolution of policy bias across states with and without direct democratic institutions (Matsusaka, 2008). In states with direct democracy, policy bias stagnated on average, whereas in states without it grew. Second, we compared red and blue states. We found that in most blue states, policy bias decreased between 2014 and 2021. Meanwhile, in purple and red states, the bias grew substantially.
Discussion
Our study offers new insights on the dynamic relationship between policies and public opinion in the United States and contributes to the rapidly evolving methodological arsenal for studying it. Going beyond existing research (Caughey and Warshaw, 2018), we capitalize our unique data and design to quantify the extent to which public policies track changes in preferences. Moreover, our ability to measure preferences and policies on the same continuous scale allows us to investigate how states differ in translating changes in preferences in corresponding policies.
Based on our analysis of minimum wage laws, it appears that statehouse democracy “works” on average in the sense that changes in policies are related to fluctuations of mass opinion within states. At the same time, we find that even though on average, policy changes followed public opinion, this was insufficient to close a large gap between the minimum wages citizens want and what they got. Perhaps most importantly, our analyses also reveal important differences between states: During the period we study, some of them experienced no policy change in the face of large conservative biases and significant changes in mass opinion, while other states increased their minimum wages disproportionately to corresponding changes in public opinion and as a result closed the representation gap. These patterns are likely to reflect a growing polarization in terms of policy outcomes, in the face of relatively similar trends in public opinion.
Needless to say, our approach still features a number of important limitations. First, like many studies in the existing literature (Lax and Phillips, 2009), our empirical analysis focuses on a single policy and as such its findings may not generalize to the opinion–policy relationship across all issues. Second, we are limited in the time-span of our data and as such we might underestimate the degree to which policy follows mass opinion to the extent that the alignment of polices and preferences takes longer—as some of the mechanisms posited in the literature would require. Third, in our entire exercise we consider nominal minimum wage, and as a result, some of our comparisons might understate or overstate differences across states or time periods. While additional analyses (see Online Appendix C2) confirm that our finding regarding average changes in policy bias remain similar once we account for inflation, in the lack of state-level data on consumer prices, we cannot rule out that differences in nominal policy bias across states may be offset by corresponding differences in prices.
In any case, our study could be taken as an example of how we can quantify the relationship between policies and mass preferences across more issues and a longer time-span in the United States and beyond. This is all the more important given the unfolding debate about the unequal influence of affluent Americans on policy outcomes (Erikson, 2015). As our findings demonstrate, this could lead to important new insights on one of the most fundamental functions of democracies: translating individual preferences into laws.
Supplemental Material
Supplemental Material - Stability and change in the opinion-policy relationship: Evidence from minimum wage laws
Supplemental Material for Stability and change in the opinion–policy relationship: Evidence from minimum wage laws by Gabor Simonovits and Alexander Bor in Research & Politics
Footnotes
Declaration of conflicting interests
The author(s) declared no potential conflicts of interest with respect to the research, authorship, and/or publication of this article.
Funding
The author(s) disclosed receipt of the following financial support for the research, authorship, and/or publication of this article: This publication is the result of research conducted for Central European University, Private University. It was made possible by the CEU Open Access Fund.
Supplemental Material
Supplemental material for this article is available online.
Notes
References
Supplementary Material
Please find the following supplemental material available below.
For Open Access articles published under a Creative Commons License, all supplemental material carries the same license as the article it is associated with.
For non-Open Access articles published, all supplemental material carries a non-exclusive license, and permission requests for re-use of supplemental material or any part of supplemental material shall be sent directly to the copyright owner as specified in the copyright notice associated with the article.