
Abstract
The regression discontinuity (RD) design offers identification of causal effects under weak assumptions, earning it a position as a standard method in modern political science research. But identification does not necessarily imply that causal effects can be estimated accurately with limited data. In this paper, we highlight that estimation under the RD design involves serious statistical challenges and investigate how these challenges manifest themselves in the empirical literature in political science. We collect all RD-based findings published in top political science journals in the period 2009–2018. The distribution of published results exhibits pathological features; estimates tend to bunch just above the conventional level of statistical significance. A reanalysis of all studies with available data suggests that researcher discretion is not a major driver of these features. However, researchers tend to use inappropriate methods for inference, rendering standard errors artificially small. A retrospective power analysis reveals that most of these studies were underpowered to detect all but large effects. The issues we uncover, combined with well-documented selection pressures in academic publishing, cause concern that many published findings using the RD design may be exaggerated.
Introduction
The regression discontinuity (RD) design requires relatively weak assumptions for identification of causal effects (Cattaneo, Titiunik and Vazquez-Bare, 2020b). As a result, the method has been widely used in modern empirical political science, and its popularity continues to grow. Prominent studies examine the effect of incumbency and control over media (Boas and Hidalgo, 2011), and the effect of electing extremist candidates in primaries (Hall, 2015). Because the requisite identifying assumptions are weak, researchers may surmise that all empirical challenges faced when using the method are easily solved. In this paper, we demonstrate that this view is largely unfounded, highlighting the serious statistical challenges associated with the RD design.
The main contribution of this paper is an investigation of how these statistical challenges manifest themselves in the body of published political science research using the RD design. We collect all articles using an RD design in the American Political Science Review, American Journal of Political Science, and Journal of Politics published from 2009 through 2018. We find that the distribution of published RD estimates exhibits some pathological features. Reported t-statistics bunch around, and especially just above, 1.96, corresponding to the conventional statistical significance level of five percent. Furthermore, estimated effect sizes are strongly associated with estimated standard errors. This suggests selection pressure to obtain, report, or publish results that are statistically significant at conventional levels.
A possible explanation for the pathological features lies with researcher discretion in analysis. Researcher discretion is an important concern because the RD design offers considerable leeway in how to estimate effects, and researchers could leverage this leeway to search for significant findings, a practice sometimes called p-hacking. While the problems of p-hacking and publication bias are widely recognized, their importance for the RD design specifically has largely been overlooked; one recent exception is Gelman (2022). To investigate whether researcher discretion can explain the pathological features, we compare studies that use automated bandwidth selection procedures against those implementing non-automated procedures. Researcher discretion should be a greater concern with non-automated bandwidths, all else equal, as there are more choices to be made by researchers. However, we find more bunching for studies using automated bandwidth selection, suggesting that researcher discretion in bandwidth selection cannot readily explain our findings.
We next reanalyze all studies with available data in order to investigate the consequences of using inappropriate statistical procedures on the distribution of published results. Our reanalysis uses a standardized procedure based on current state of the art methods (Calonico et al., 2015). This aims to correct potential methodological shortcomings in studies using older methods and procedures, and to remove discretion in the analysis. The reanalysis does not meaningfully change the reported point estimates, but the estimated standard errors become larger on average, moving the t-statistics closer to zero. This indicates that the body of published RD studies tends to systematically overestimate the accuracy of their findings.
A contributing explanation for the pathological features could be selection pressure in the publication process. Researchers may abandon projects that fail to produce statistically significant results, or journal editors and referees may be reluctant to accept such results for publication. This type of publication bias would give rise to these pathological features even if researchers do not search through many specifications for statistically significant results. The problem has been well-documented in, for example, political science (Gerber and Malhotra, 2008a), experimental psychology (Open Science Collaboration, 2015), and economics (Brodeur et al., 2020).
The degree to which publication bias is consequential for the health of a literature depends on the statistical power of the analyses conducted in the field. In a body of underpowered studies, the share of rejected hypotheses that are false positives will typically be much greater than the nominal significance level. When a field consists primarily of underpowered studies and suffers from severe publication bias, a large majority of published findings could be false. Inappropriate inference procedures, such as biased standard error estimators, further inflate the number of false positives, exacerbating the problem. To investigate whether this is a concern for the body of RD studies, we conduct retrospective power analyses on all studies with available data. The exercise shows that most studies were not well-powered to detect small- or moderate-sized effects. RD studies in political science tend to be underpowered, sometimes severely so, making the concern over possible publication bias more alarming.
The findings in our paper are a stark contrast to the results of a similar study in economics by Brodeur et al. (2020). These authors found that the body of RD research in economics does not exhibit notable pathological features, especially compared to studies using instrumental variables. The difference between political science and economics might be puzzling given that applied empirical practice for RD estimation is similar in the two fields. However, as noted by Brodeur et al. (2020, p. 3646), differences between the fields have been documented before. For instance, Gerber and Malhotra (2008a) find that the ratio of tests just above the 1.96 threshold of statistical significance relative to those just below is two in political science, while Brodeur et al. (2020) find that the same ratio is only about 1.1 in economics. We investigate one potential explanation for the difference regarding RD research: namely, that political scientists predominately use election data with the design, which often is a scarce source of data. Economists use register data or other microdata to a greater degree, which tend to be more plentiful, making the power issues less pronounced.
Taken together, our investigation suggests that many published findings using the RD design in political science may be exaggerated, if not spurious. Our analysis suggests that lack of sufficient statistical power combined with publication bias is a likely culprit. Power is a particularly important concern for RD designs in political science as researchers predominantly use the design to study elections, where the amount of data is limited by the number of electoral districts and election cycles. 1 Although the RD design is an invaluable part of the methodological toolkit in political science, empirical researchers must nevertheless take the estimation challenges associated with the method seriously and properly address them. Our suggestions for empirical practice moving forward are that researchers should use appropriate, modern analysis procedures, that they should restrict their focus to studies with sufficient power, and that they should pre-register analysis plans when possible.
Why is it hard to estimate RD effects?
The causal effect studied in the RD design is the difference between the expected treated and control potential outcomes at a cutoff where treatment assignment changes in a discontinuous fashion. If the conditional expectation function of the outcome were known, this effect can be calculated without error under an assumption that the conditional expectation functions of the potential outcomes are continuous at the cut point. In other words, the RD effect is identified under a continuity assumption. The assumption is reasonable in a wide variety of settings, such as when units cannot precisely control treatment assignment. This has earned the RD design its reputation as a method that produces credible findings. The concept of an RD design was introduced by Thistlethwaite and Campbell (1960). The formal identification results for the design were first derived by Hahn et al. (2001). An insightful and accessible discussion is provided by Cattaneo et al. (2020a).
However, identification is not enough. The identification exercise presumed the conditional expectation function of the outcome was known, but it will generally not be. Learning about the causal effect requires estimating this function, and this estimation exercise may be unexpectedly challenging. While the identifying assumptions required by the RD design might be comparable in strength to those required by randomized controlled trials (RCTs), the statistical challenges under the RD design are better compared with those we typically face in other types of observational studies. The main challenge is that we are interested in the value of the potential outcome functions when evaluated at the cutoff, but there will generally be no observations exactly at the cutoff. Therefore, researchers need to rely on observations away from the cutoff for estimation, and these observations may not be informative of the quantities of interest.
The standard way to proceed is to assume that the potential outcome functions are smooth, meaning that they do not change too quickly. This implies that observations close to the cutoff are somewhat informative of the value of the functions at the cutoff, so they can be used for estimation. Researchers then face a trade-off. If we estimate the RD effect using only observations very close the cutoff, we ensure that the observations are relevant, but doing so discards most of the data, rendering the estimates less precise. By contrast, if we include observations farther away from the cutoff, precision improves, but the relevance of the observations decreases. We can interpret this as a bias–variance trade-off, where the bias is governed by the relevance of the observations and the variance by their numbers.
No matter how one resolves this trade-off, the consequence is that the nominal sample size (i.e., the number of rows in the data set) is not a good indicator of the effective sample size (i.e., the amount of useful information in the data set). Even if identification in an RD design might be almost as credible as in a randomized experiment, we would often need a sample size that is orders of magnitude larger to estimate the causal effect in an RD design to the same level of accuracy as in an experiment. The bias–variance trade-off also introduces researcher discretion in that there is no intrinsically correct way to resolve the trade-off, and researchers can, purposefully or inadvertently, use this leeway to search for significant findings.
The bias–variance trade-off is inherent to the RD design, and therefore inescapable, but several methods have been developed to help researchers navigate it. The most common approach is to carefully balance bias and variance with the aim to maximize accuracy, as measured by mean square estimation error. The bandwidth selection method described by Imbens and Kalyanaraman (2011) is an early such example. While this and other similar methods do improve accuracy, they cannot escape the inherent limitations of the data; the effective sample size often remains small even when the nominal sample size is large. Besides improving accuracy, these methods also reduce researcher discretion, possibly limiting researchers’ ability to engage in specification searching. Of course, researcher discretion is not entirely removed. Researchers may, for example, still be able to choose between different bandwidth selection methods, and decide on other aspects of the analysis.
The use of bandwidth selection methods to maximize accuracy provides a partial solution to some of the most pressing problems associated with RD designs, but in doing so, creates a new one. To conduct hypothesis tests or construct confidence intervals, researchers need to estimate the accuracy of the RD point estimate. Conventional methods used to gauge this accuracy rely on an assumption that the bias of the estimator is negligible compared to its variance, as would be the case in, for example, a randomized experiment. However, when a bandwidth selection method balances bias and variance to maximize accuracy, the bias is not negligible, and it must therefore be accounted for when drawing inference. Researchers sometimes neglect doing so, with the consequence that their hypothesis tests and confidence intervals are misleading even when the sample is large.
There are predominately three approaches to address this problem. The first approach is so-called undersmoothing, meaning that one uses a bandwidth that is smaller than the optimal one. If done correctly, this will ensure that the bias indeed is negligible in large samples, so researchers can use conventional methods to construct hypothesis tests and confidence intervals. The downside is that the accuracy of the point estimator is worse compared to when using the optimal bandwidth.
The second approach is to adjust the inference procedure for the bias. One can show that the bias when using the optimal bandwidth can be estimated using a similar approach as for the point estimator. This bias estimate can be used to adjust the point estimate before the construction of confidence intervals and hypothesis tests, allowing researchers to address the bias and still use the optimal bandwidth. To ensure that the bias adjustment itself does not affect the overall precision, one must ensure that the bias is estimated with considerably higher precision than the precision of the point estimator. This cannot be ensured in finite samples, but it can be ensured asymptotically if the bandwidth used for the bias adjustment is considerably larger than the bandwidth used for the point estimator. However, Calonico et al. (2014) point out that it might be undesirable to use a larger bandwidth for the bias adjustment, and that the finite sample behavior might nevertheless be poor. The alternative approach described by Calonico et al. (2014), which is becoming the standard approach used in political science, is to also estimate the precision of the bias adjustment and incorporate this into the variance estimator. This allows researchers to use bias adjustments that have similar precision as the point estimator (e.g., as would be the case when the same bandwidth is used for both point and bias estimation), and it should improve finite sample performance.
The third approach is to adjust the inference procedure with the worse-case bias consistent with the observed data. The worst-case is taken with respect to a stipulated class of functions, in which the true conditional expectation function is assumed to exist. This approach obviates the need to estimate the bias, which means that we have to rely on fewer asymptotic approximations and assumptions than with the second approach. As a consequence, the third approach is expected to perform better in terms of coverage in finite samples, at the cost of typically being more conservative. The method described by Armstrong and Kolesár (2020) is an example of this approach.
Taken together, the estimation challenges associated with the RD design are immense, comparable to those faced in other types of observational studies. Yet, being attracted by its weak identification assumptions, researchers may overlook these challenges. The concerns become even more pressing when the nominal sample sizes are small, as they often are for RD studies in political science. In particular, the most common type of RD study in political science uses election cutoffs to study the effect of incumbency or other characteristics of candidates or parties. The sample size is here limited by the number of election districts and the frequency of the elections, which both tend to be small. For example, if we are interested in contemporary American gubernatorial elections, we are limited to around 200 observations, of which most will not be close elections and thus not relevant when estimating the RD effect. These estimation challenges and the relatively limited number of observations in election RDs, in particular, motivate us to take a closer look at the state of RD research in political science.
The state of RD studies in political science
We collected all studies using an RD design published in the American Political Science Review, American Journal of Political Science, and Journal of Politics between 2009 and 2018. We included studies implementing an RD design as the primary empirical strategy in an applied setting, in addition to studies where an RD design complements another design (e.g., Broockman and Ryan, 2016). We excluded studies primarily making methodological contributions (e.g., Cattaneo et al., 2016). There were 45 studies in total that satisfied these inclusion criteria. Section S1 in the supplement describes the sample selection strategy in more detail and contains a list of all 45 studies.
Figure 1 presents the distribution of t-statistics for the published findings among all 45 studies in our sample. The first panel presents the distribution of the main reported result of each article, meaning that each article contributes one t-statistic. The second panel presents the distribution of all results that were referenced in the articles’ abstracts, which we take as a proxy for being a primary result of an article. There are 80 t-statistics in total in the second panel, meaning that each article contributes 1.78 statistics on average. To avoid overrepresentation of articles that present many results, the t-statistics in the second panel are weighted by the inverse of the total number of results in each study. For the majority of the studies, we either use reported t-statistics or reconstruct t-statistics using the ratio of coefficients and standard errors. For the small number of the studies where neither t-statistics nor standard errors were reported, we reconstruct t-statistics using reported p-values, confidence intervals and point estimates, or using replication code and data provided by the authors. Distribution of t-statistics among published RD studies in political science. (a) Main reported result; (b) All primary results.
The histograms in both panels of Figure 1 demonstrate clustering around the value 1.96. This corresponds to a significance level of 5%, which is the conventional threshold for calling a result “significant.” Particularly noteworthy is the substantial imbalance in density to the right of 1.96, suggesting that results that clear the 5% significance level threshold are artificially favored. The density of t-statistics increases somewhat before the 1.96 threshold, which suggests that almost significant results are also favored. Nevertheless, the spike in density to the right of 1.96 is pathological, in the sense that we would not expect to observe this pattern of t-statistics occurring naturally.
The number of RD studies in our population is relatively small, and it is perhaps conceivable that this distribution of t-statistics could arise with somewhat high probability even when there are no real pathologies in the literature. To assess this in a more formal way, we turn to the so-called caliper test described by Gerber and Malhotra (2008a, 2008b), which was also used by Brodeur et al. (2020). 2 The test compares the number of studies just above and just below the 1.96 threshold that corresponds to statistical significance at the 5% level. Under the assumption (null hypothesis) that the 5% significance level is irrelevant for researchers’ and editors’ publication decisions, the 1.96 threshold should be immaterial, and we would expect approximately the same number of studies just above and just below it. However, the 1.96 threshold becomes relevant for the publication decision if there is p-hacking or publication bias. In this case, we would not be surprised to see more studies just above the threshold. Following Gerber and Malhotra (2008a, 2008b), we include studies within windows around the cutoff with radii (i.e., half-widths or calipers) of 10%, 15%, and 20% of the threshold itself, here corresponding to 0.196, 0.294, and 0.392, respectively. A smaller window is better targeted towards the 1.96 threshold, but has lower power.
Caliper tests of imbalance of t-statistic among RD studies.

Researcher discretion
A possible explanation for the bunching of t-statistics around the value 1.96 observed in the previous section is researcher discretion. Such discretion could be used to seek statistically significant results by searching through specifications and analysis procedures. When done deliberately, the practice is called p-hacking, but researchers can conduct specification searching inadvertently. No matter whether it is deliberate or not, searching for significant results invalidates hypothesis tests, p-values and confidence intervals.
It is difficult to directly gauge the influence of researcher discretion and possible p-hacking. We do not observe all specifications researchers tried before finding the one reported in their published article, and unusual specification choices can often be rationalized after the fact. In an effort to circumvent this problem, we take advantage of the fact that different methods of bandwidth selection provide different levels of researcher discretion. An automated bandwidth selection procedure, such as those described by Imbens and Kalyanaraman (2011) and Calonico et al. (2014), leaves less room for specification searching. This is in contrast to non-automated procedures and global polynomial specifications, which involve many specification choices. Table S3 in the supplement describes the bandwidth selection procedures used by the studies in our investigation. This table shows that while automated procedures have seen increased use over time, roughly half of all studies throughout the studied period use non-automated procedures.
Figure 2 presents histograms of t-statistics disaggregated by studies that use and do not use an automated bandwidth selection procedure. The first panel consists of studies using automated methods, and we see a clear spike to the right of 1.96, similar to the finding in the previous section. The second panel, which consists of studies using non-automated methods, does not present a clear spike, although there are more studies to the right than to the left of the cutoff. To the degree that the bandwidth selection method is a good proxy of researcher discretion, this finding suggests that discretion is not the driving force of the pathological features we observed in the previous section. Distributions of t-statistics disaggregated by bandwidth selection procedure. (a) Automated; (b) Non-automated.
We conduct the caliper tests described in the previous section in the two groups of studies using automated and non-automated bandwidth selection procedures. The results are presented in Section S5 of the supplement. In summary, there are almost the same number of t-statistics just above as below the 1.96 threshold within all windows for the studies using non-automated procedures, with p-values around 50%, indicating that this is not an unusual observation under the null. However, there is only one t-statistic just below the threshold for studies using automated procedures, irrespective of window size, and there are 6–10 t-statistics just above the threshold, depending on window size. The p-values are between 1% and 6%, indicating that this would be an unusual observation under the null. This corroborates the insights given by the histograms. However, note that the samples are smaller in these disaggregate tests, so power is reduced.
These results should be interpreted with caution. When researchers use non-automated bandwidth selection methods, they are generally expected to report the estimates using several different bandwidths, with the expectation that the estimates are similar for most of those bandwidths. This limits the scope of specification searching even when using a non-automated method, making the bandwidth selection method less useful as a proxy for researcher discretion. There are also other sources of researcher discretion. For example, unless researchers have pre-committed to a bandwidth selection method before having access to the data, the decision to use a particular automated bandwidth selection method may itself be part of the specification search. Researchers also have discretion over which questions to investigate, and they may search through a large set of different outcomes, trying to find one that is statistically significant at conventional levels. While the current investigation does not allow us to rule out all types of researcher discretion as an explanation, it suggests that specification searching using bandwidth selection is not a major driving force of the pathological features we saw in the previous section.
Reanalysis
We next seek to understand what these studies, all else equal, might have looked like had they all been analyzed with the same, modern approach. This serves two purposes. First, it provides additional insights about whether researcher discretion is a contributing factor to the pathological features. By reanalyzing all studies using a standardized procedure, we remove many sources of researcher discretion. Second, some studies used procedures that do not properly address the statistical concerns outlined in the Why is it hard to estimate RD effects? section, potentially providing misleading results. A reanalysis addresses many, if not all, of these statistical concerns.
Methodology
Replication data are required to conduct this reanalysis. We were able to obtain such data for 36 out of the 45 studies in our sample. Section S2 in the supplement describes how we collected the replication data and lists the studies for which we failed to obtain such data, including brief descriptions of why we failed to do so. The most common reason was the use of proprietary data, which the original authors were prohibited from sharing.
Our primary reanalysis uses the default settings in the R package rdrobust (Calonico et al., 2015). The procedure implemented in this package has well-understood theoretical properties and attempts to address the concerns discussed in the Why is it hard to estimate RD effects? section. The reanalysis results we present in the main body of the paper exclude all studies that originally used the rdrobust package to estimate the effects, as a reanalysis would bring few new insights for these studies. This results in 39 estimates across 25 studies. Thus, the investigation presented in this section focuses on these 25 studies. The reanalysis for the full set of 36 studies with replication data is presented in Section S8 in the supplement.
One limitation of the approach by Calonico et al. (2015) is that it is motivated by an asymptotic approximation. This means that confidence intervals and hypothesis tests may not be valid in finite samples. For example, Eckles et al. (2020) report Monte Carlo simulations suggesting that even when n = 1,000, coverage for nominal 95% confidence intervals can be less than 92%. For this reason, we also conduct reanalyses using the rdhonest procedure by Armstrong and Kolesár (2020), for which asymptotic approximations feature less heavily, as discussed in Why is it Hard to Estimate RD Effects?. However, rdhonest also has limitations. Unlike rdrobust which adapts to the degree of smoothness in the regression function, rdhonest requires that the researcher specifies, or estimates, a lower bound on smoothness. In our setting, we use the global quartic regression implemented in rdhonest to estimate a bound on smoothness, which requires stronger assumptions than if the smoothness bound was selected based on prior knowledge.
Results
Figure 3 presents the distribution of t-statistics among the 39 estimates from the 25 studies included in the main replication exercise. Panel 3(a) replicates Figure 1(b) for the 39 estimates, containing the reported t-statistics using the analysis procedures used in the original studies. Distributions of t-statistics among replicated studies by method of analysis. (a) Original approach; (b) CCT bandwidth; (c) Bias corr. and robust SEs.
Panel 3(b) reanalyzes all 39 estimates using the default bandwidth selection method implemented in rdrobust (“mserd”) but does not make any adjustments for bias for the point estimator nor any adjustments for the standard errors. For this reason, these t-statistics will be too large as the accuracy of estimates is overestimated, potentially making them misleading. However, if specification searching in bandwidth selection was an important driver, there would be noticeable differences between the first and second panels. The figure demonstrates that the distribution shifts to the left compared to the first panel, but a clear spike remains at the value 1.96 in the second panel. This provides additional support to the conclusion that specification searching over bandwidths is not the main driver of the findings.
Panel 3(c) reanalyzes the studies using the same bandwidth selection method as in the second panel but also implements the bias adjustment for the point estimator and adjusts the estimated standard errors to account for the added imprecision of the bias adjustment. Here, we see a clear shift to the left, indicating that these studies have systematically overestimated the accuracy of their estimates.
We can disaggregate the information in Figure 3 using a funnel plot, which is a scatter plot with standardized point estimates and standardized estimated standard errors on the two axes. Figure 4 presents such a funnel plot for the 39 estimates in the replication study.
3
We use the sample variance of the outcome among control units for the standardization. The boundary for statistical significance at the 5% level is a line emanating from the origin with a slope of 1.96, here drawn in red, where estimates to the right of this line attain statistical significance at the conventional level. Like in Figure 3, the first panel presents the estimates from the original studies, the second panel uses the default bandwidth selection method in rdrobust but no bias adjustment, and the third panel implements the bias adjustment. Funnel plots for replicated studies by method of analysis. (a) Original approach; (b) CCT bandwidth; (c) Bias corr. and robust SEs.
We find that the reanalysis does not systematically change point estimates, but it does have meaningful consequences for the estimated standard errors. The standard errors are systematically larger in Figure 4(b) than in Figure 4(a). This is partly because some studies use global polynomial specifications to estimate the RD effect. A global polynomial specification does not impose any bandwidth restriction on the sample, making the bandwidth selected by rdrobust dramatically smaller, leading to larger standard errors. The standard errors are even larger in Figure 4(c), reflecting the added imprecision introduced by the bias adjustment.
We note that the estimates cluster around the red line corresponding to a t-statistic of 1.96, especially in the first panel. Echoing the logic of Gerber et al. (2001), it is hard to rationalize such a strong positive correlation between the point estimates and standard errors. In theory, one explanation could be that researchers are tremendously adept at power analysis, so they are able to target the sample size to have just sufficient power to detect the effect of interest. However, this explanation appears improbable; there are many uncertainties involved with a power analysis, and researchers rarely have precise control over the sample size in an RD study. A more probable explanation is selection pressure on what type of results get reported and published.
The results of the reanalysis are largely unchanged when we use the rdhonest procedure by Armstrong and Kolesár (2020) in place of rdrobust. Section S8 in the supplement reports the results using this alternative approach. The version of the rdhonest package we used for the reanalysis cannot account for statistical clustering, so our replication using this package is restricted to studies that did not originally use clustered standard errors. Because the rdhonest package uses a worst-case bias adjustment, conventional t-statistics will not capture the adjustment made here. To make the results from rdhonest comparable to the other results in this paper, we derive pseudo t-statistics based on the width of the confidence intervals produced by the rdhonest package. Substantively, the distribution of reanalysis results is similar to those produced by rdrobust: the pseudo t-statistics shift to the left, and the pseudo standard errors systematically increase.
Power analysis
Having well-powered studies is one of the best defenses against the concerns highlighted in this paper. Selection pressure for significant findings in a body of poorly powered studies could make most of the reported results spurious. This is because the probability of rejecting a false null hypothesis is not much greater than rejecting a true null hypothesis when power is low, meaning that the proportion of false positives of all positive findings in the published literature will be approximately the same as the proportion of true null hypothesis in the body of conducted studies. In some literatures, most investigated (alternative) hypotheses are false, meaning that most published positive findings also will be false if the power is low. But in a body of well-powered studies, the true positives will be a disproportionally large share of the overall positive findings, decreasing the proportion of published false positives. Furthermore, a well-powered study can in some cases make researcher discretion less consequential, because there is less variability in the estimate to exploit. Therefore, as noted in the Why is it Hard to Estimate RD Effects? section, it is worrying that the RD design is unusually demanding with respect to sample size, and even samples that on the surface appear large can be poorly powered.
To investigate the extent to which this is a relevant concern among RD studies in political science, we conducted retrospective power analyses for all 36 studies with replication data, comprising 64 separate analyses. Using the power analysis method implemented in the R package rdpower by Cattaneo et al. (2019), we estimate the power of a two-tailed test at the 5% significance level based on a central limit approximation for the sampling distribution. The power analyses presume that p-values will be constructed with the bias adjustment and robust standard errors as implemented by rdrobust. As this procedure is only asymptotically valid, our power calculations may be optimistic relative to approaches that control the false positive rate in finite samples.
We investigate power with respect to four different effect sizes, ranging from small to large effects. We measure effect size by Cohen’s d, which is the treatment effect standardized by the standard deviation of the outcome (Cohen, 1988). We use the standard deviation of the outcome of control units within the default bandwidth in the rdrobust package for this standardization. We investigate the effect sizes 0.1, 0.2, 0.5 and 0.8. While 0.5 is conventionally labeled as a medium-sized effect, modern social science tends to study effects of smaller sizes. For example, the What Works Clearinghouse, which is a governmental program that collects and reviews evidence of the effectiveness of various policies, labels an effect size of 0.25 as “substantively important” in their handbook (What Works Clearinghouse, 2017).
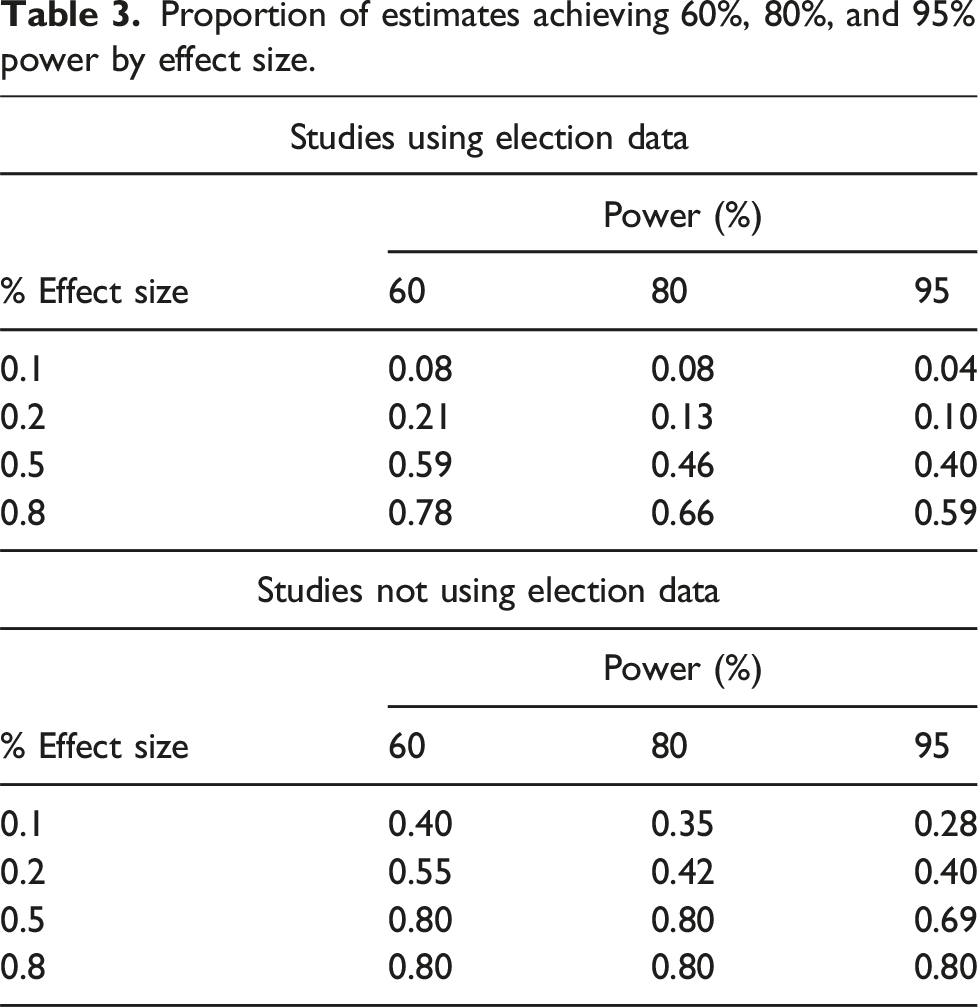
Proportion of analyses achieving 60%, 80%, and 95% power by effect size.

The table shows that these studies are overall poorly powered to detect anything but large effects. Only 22% of the analyses achieve 80% power to detect a 0.2 effect size. Recall that 80% power is the conventional level that researchers often strive to achieve when designing a study. Hence, about four out of five RD studies are not properly powered for effect sizes that in many applications would be considered noteworthy. For the effect sizes of 0.5 and 0.8, the shares of properly powered studies increase to 56% and 70%, respectively. Both 0.5 and 0.8 would be very large effects in most modern literatures in political science, so the fact that almost half of the studies are not well-positioned to detect such effects gives an indication of the severity of the problem. Overall, the body of RD studies is alarmingly underpowered.
Proportion of estimates achieving 60%, 80%, and 95% power by effect size.
To get a sense of how consequential these power issues are for the pathological features we observed in The State of RD Studies in Political Science section, we consider the distributions of t-statistics separately for studies using election data and those that do not, in a similar fashion as the investigation in the Researcher Discretion section. The distributions are presented in Figure 5. We see that there are noticeably more t-statistics just above the 1.96 threshold for studies using election data, while the t-statistics are more balanced around the threshold for the other studies. Although there is a noticeable spike at the threshold for the second set of studies as well. This observation is consistent with insufficient statistical power being the main driver of the pathological features, but this investigation is far from conclusive. It could, for example, be that election research is more competitive in political science, meaning that researchers have a greater incentive to p-hack and that editors are more selective. Additionally, we are limited in the conclusions we draw about studies using non-election data given the limited number of published papers using such data. Distributions of t-statistics disaggregated by data source. (a) Election data; (b) All other data sources.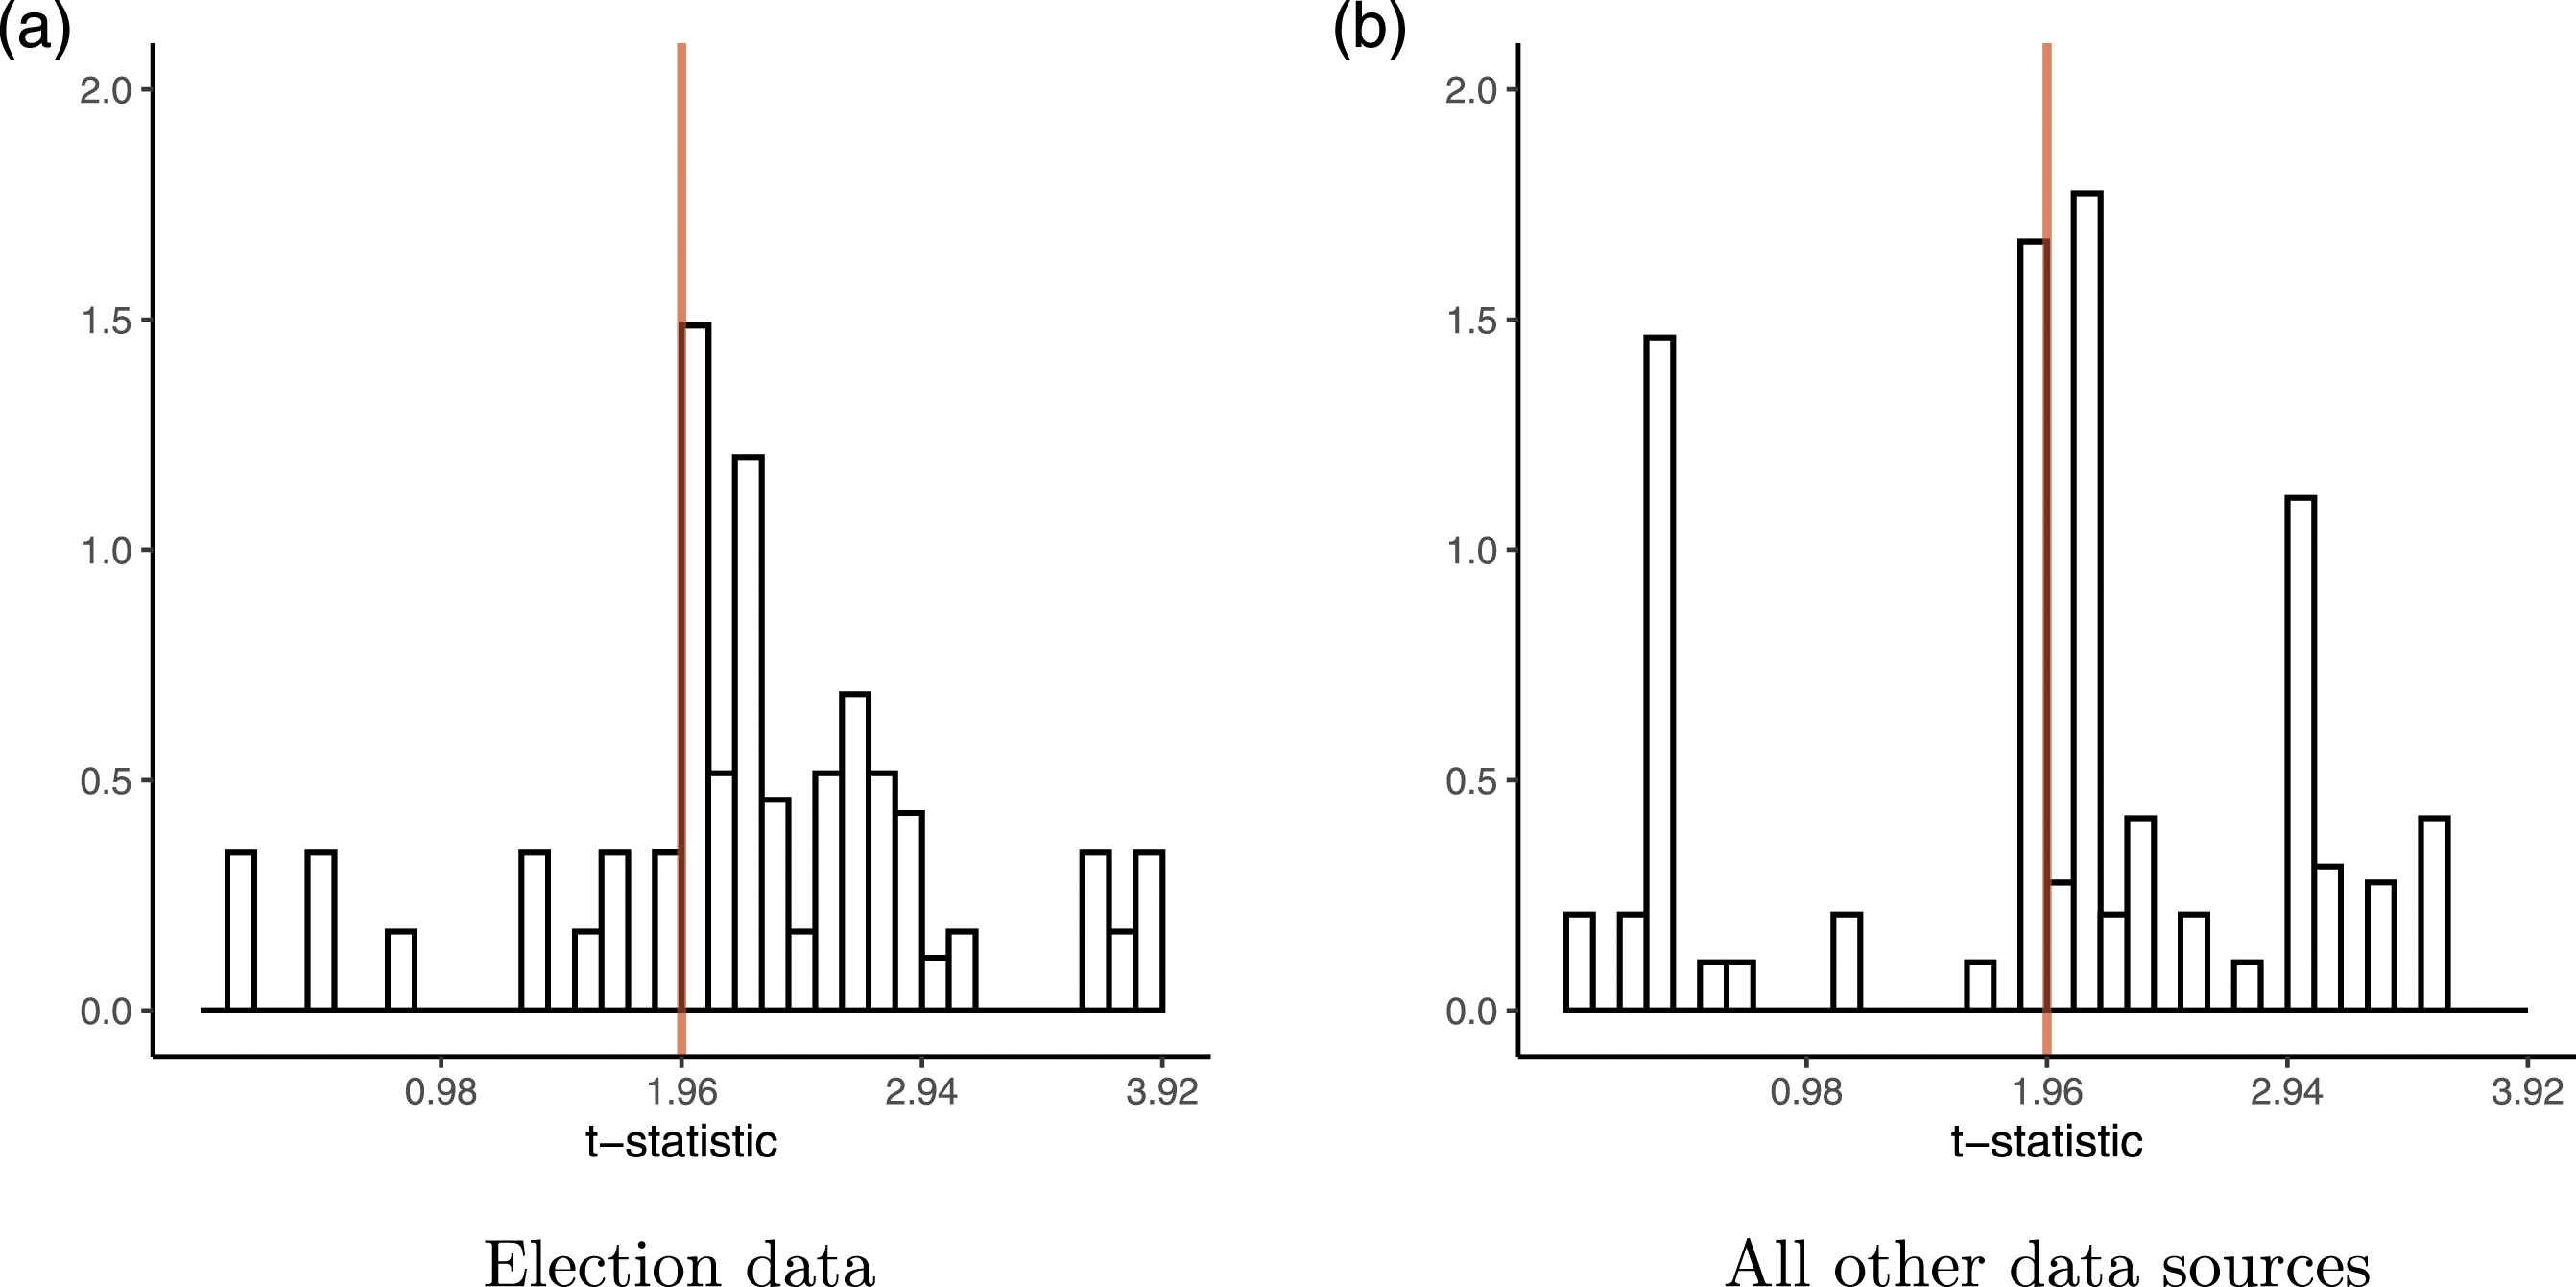
While power is a particularly important consideration for the RD design, given its hunger for data, the issues we document here are not unique to RD studies. Arel-Bundock et al. (2022) use meta-analytic evidence to estimate that approximately one in 10 tests reported in political science have at least 80% power. This analysis relies on the assumption that studies in a given literature share a common mean effect (inclusive of bias), which may understate the power of many studies in the presence of effect heterogeneity or differential bias across studies. Nevertheless, the striking degree of the documented issues suggests that power issues are prevalent throughout the field.
Concluding remarks
The body of published political science research using the RD design exhibits pathological features consistent with selective reporting and publishing based on whether results clear artificial significance thresholds. More than half of the studies in our sample do not properly estimate the accuracy of their estimates, leading to the associated hypothesis tests and confidence intervals being misleading. Most of the studies are also underpowered, and are able to detect only large effects. Taken together, this paints a somber picture of the state of empirical research using the RD design. Our results suggest that many published findings using the design are exaggerated if not altogether spurious.
The conclusion is that researchers using the RD design must take the estimation challenges associated with the design more seriously. They should make sure to conduct hypothesis tests and construct confidence intervals in a well-motivated way that properly reflects the accuracy of the finding. The procedures described by Calonico et al. (2014) and Armstrong and Kolesár (2020) represent significant progress toward this goal.
Furthermore, statistical power will often be a first-order concern with the RD design, and researchers should make sure that they have sufficiently large samples to have a good chance to detect effects of sizes relevant to the question at hand. When gauging power, researchers should remember that the nominal sample size is not relevant in an RD study, and they should instead consider how much information there is about the potential outcomes close to the cutoff. Sample size is often beyond the control of the researcher in RD studies; if the accessible sample is too small, researchers should ask whether it is appropriate to conduct the study at all. The decision to abandon a study due to concerns about power should be taken before running the analysis and observing the estimated effect.
Covariates can sometimes be used to improve precision in an RD study without collecting additional observations, which could alleviate some of the concerns about lack of power with the RD design (Calonico et al., 2019). However, covariate adjustment involves many largely arbitrary specification choices, which would make it easier to p-hack. It is unclear if the body of RD studies overall would benefit from making covariate adjustment an expected part of the analysis with the RD design. Indeed, one of the central benefits of the RD design is exactly that identification does not require background information about the units, other than the running variable that decides treatment assignment.
Journals should consider taking power into account when making publication decisions. If a study is severely underpowered, it may not contribute much to the literature even if it has nominally statistically significant results. Similarly, a well-powered study often provides useful insights no matter if its results are statistically significant at conventional levels, because confidence intervals will typically be narrow. Being more mindful about power would alleviate publication bias, making the body of published results more reliable and informative.
Another way to alleviate some of these concerns is preregistration for studies using the RD design. Given that most RD studies are retrospective, it might be difficult for researchers to credibly show that all analyses were registered before they were conducted. However, insofar as it as possible, having a full record of analyses that were intended would be helpful for the accumulation of knowledge. They reveal the absence of findings from the published literature due to the “file drawer” problem that disproportionately afflicts insignificant findings, either through the filter of publication or through specification searching. Scholars evaluating a literature (e.g., in meta-analysis) could use these preregistrations to help to undo distortions introduced through the various filters associated with the production and dissemination of knowledge. Preregistration is also useful to address inadvertent p-hacking, as researchers are less likely to accidentally or thoughtlessly deviate from their original plans when they are recorded.
Supplemental Material
Supplemental Material - On the reliability of published findings using the regression discontinuity design in political science
Supplemental Material for On the reliability of published findings using the regression discontinuity design in political science by Drew Stommes, PM Aronow and Fredrik Sävje in Research and Politics.
Footnotes
Acknowledgements
We thank Matias Cattaneo, Alex Coppock, Andrew Harris, Greg Huber, Will Hunt, Austin Jang, Josh Kalla, Winston Lin, John Marshall, Lilla Orr, Tara Slough, Jessica Sun, two anonymous reviewers, and the editor, Abel Brodeur, for helpful comments and discussions.
Declaration of conflicting interests
The author(s) declared no potential conflicts of interest with respect to the research, authorship, and/or publication of this article.
Funding
The author(s) received no financial support for the research, authorship, and/or publication of this article.
Correction (June 2025):
Supplemental Material
Notes
References
Supplementary Material
Please find the following supplemental material available below.
For Open Access articles published under a Creative Commons License, all supplemental material carries the same license as the article it is associated with.
For non-Open Access articles published, all supplemental material carries a non-exclusive license, and permission requests for re-use of supplemental material or any part of supplemental material shall be sent directly to the copyright owner as specified in the copyright notice associated with the article.