
Abstract
“Electability” received considerable attention during the 2020 Democratic primary campaign, with some critics claiming that the term was code for sexism. From a rational choice perspective, “electability” could affect voting in multiple ways, including via expected utility; previous scholarship suggests that many voters consider it as such. Yet this scholarship ignores the role that salience plays in decision making, and is silent on which sorts of candidate might benefit from the effects of priming electability. To address these issues, we conducted a survey experiment during the 2020 primary season, measuring Democratic primary voters’ preferences for candidates, electability estimates, and candidate rankings. Our experiment manipulated salience by randomizing the order in which preferences and electability were elicited. We show that electability salience caused a substantial increase in the probability that a respondent made decisions based only on electability.
Pundits, activists, and voters paid considerable attention to “electability” during the 2020 Democratic presidential primary campaign. 1 This debate focused primarily on which candidates were most likely to beat incumbent Donald Trump in the general election. But a secondary debate emerged about whether such considerations should affect voters’ decisions. 2 “Electability” could also be a valid consideration, when viewed from a rational choice perspective. Acting rationally according to this perspective entails taking both preferences and electability into account, as in expected utility theory, whereas voting decisions based solely on one’s preferences for candidates—without regard for election outcomes—are considered myopic. Decisions based only on which candidates are deemed to have the highest probability of winning the general election are deemed myopic as well. Discussion about electability could be important, therefore, if it encourages voters to act rationally, in line with expected utility. From this point of view, the danger is that such discussion could encourage voters to (irrationally) make decisions based on electability alone. Reassuringly, scholars have indeed found that, in past elections, most primary voters made decisions consistent with expected utility (Abramowitz, 1989; Abramson et al., 1992; Stone et al., 1992).
Yet this scholarship on electability has three important limitations. First, the evidence comes from elections in the 1980s. Changes in American politics over the last four decades may have altered voter decision making, as it has in the relationship between ideology and objective electability (Utych, 2020). Second, previous scholarship implicitly assumes that decision making is dispositional, imperturbable by environmental factors like media content. Voter decision making, however, is also situational, so electability salience can affect subsequent choices, consistent with priming (Berger et al., 2008). Third, if this priming hypothesis is correct, it becomes an empirical question which sort of candidates might benefit from the effect.
To address these questions, we conducted a survey experiment during the 2020 primary season. The survey measured Democratic primary voters’ preferences for candidates, electability estimates, and candidate rankings. Taking these perceptions as given, our focus is on the role of electability in the voting calculus and the effect of increasing its salience. We experimentally manipulated electability salience by randomizing the order in which preferences and electability were elicited. We then classified each respondent’s decision-making type—whether they appeared to make choices based on preferences only, electability only, or expected utility—and estimated the effects of the ordering manipulation on both these types and candidate rankings.
We found that most participants in our experiment took electability into account. We classified 20% of respondents as making vote choices based only on electability and about 40% as making choices based on expected utility. Increasing electability salience—eliciting it just before rankings—caused a 10 percentage point increase in the probability that a respondent made decisions based only on electability, with a similar drop in the probability that a voter made choices based on preferences alone, and no change in the proportion who made (rational) decisions based on expected utility. That our manipulation had an effect at all is potentially surprising given that electability was already a much-discussed and heightened consideration among Democratic elites and activists, particularly following Hillary Clinton’s loss in 2016 (Masket, 2020). We conclude that raising the salience of electability did not work to make participants more rational.
Electability and voter decision making
Following the previous literature (Abramowitz, 1989; Abramson et al., 1992; Stone et al., 1992), we distinguish between two key inputs to vote choice: preferences and electability. These correspond to primitives in formal theories of choice under uncertainty. Formally, we define preferences over outcomes, represented by u C , the utility for candidate C in the event that C wins both the primary and the general elections. Preferences are general and may vary from voter to voter, depending on different mixes of issues, ideology, candidate quality, etc. Similarly, we define electability as p C , the subjective belief that, if C were the party nominee, they would win the general election. As with preferences, beliefs are general and may be accurate or biased. We take both of these inputs as given.
Given these rudiments, we distinguish three types of decision making. First, voters make decisions based on preferences only if u C > u D entails that she would rank C over D. This type corresponds to “sincere” voting in the primary, myopically ignoring the general. Second, voters make decisions based on electability only if p C > p D entails ranking C over D. This type indicates a single-minded focused on choosing a candidate to win the general election. Third, voters make decisions based on expected utility if p C u C + (1 − p C )u T > p D u D + (1 − p D )u T entails ranking C over D, where u T represents the voter’s preferences for the opposing party candidate. This type is characterized as “sophisticated” or “rational.” While the first two involve a single input and are therefore cognitively simple to implement, the third requires weighing preferences and electability, and considering preferences for the opponent, making it more cognitively taxing.
Several studies of voting behavior in the 1984 and 1988 elections compared sincere and sophisticated voting models and found support for decision making consistent with the expected utility type. Stone et al. (1992) find evidence favoring the expected utility model for a sample of 1984 Iowa Democratic caucus voters and state convention delegates. Abramowitz (1989) distinguishes between electability and “viability” (beliefs about winning the nomination), finding that the expected utility model outperformed both preferences-only and an alternative “bandwagon” model focused on viability, based on 1988 Super Tuesday exit poll data from Dekalb County, Georgia. Abramson et al. (1992) also analyze Super Tuesday voters using ANES data, and conclude that voting behavior was consistent with a sophisticated voter model, using viability as beliefs.
Applying these results straightforwardly, we might conjecture that most voters rely on expected utility. Such application, however, tacitly assumes that voters’ decision making is wholly dispositional, despite evidence from political psychology to the contrary. Decision making is characterized by both dispositional and situational concerns, based on which considerations are available when they make choices (Tversky and Kahneman, 1973). Availability is affected by frequency of emphasis, for example, in media mentions of crime (Iyengar and Kinder, 1987), and by recency, for example, in evaluations of incumbent performance (Huber et al., 2012). Voters for whom electability is more available are therefore more likely to take electability into account when making decisions. In formal terms, such voters are more likely to present as electability only types.
Recent experimental research has explored the effects of manipulating electability salience on voter decisions. Rickershauser and Aldrich (2007) find that providing information about electability in the 2004 Democratic primary increased positive evaluations of candidates who were depicted as electable. Simas (2017) finds that providing information about hypothetical House candidates’ electability increases voters’ likelihood of voting for the candidate who the poll suggests is most electable. While both studies relied on convenience samples, and neither linked its findings to the potential for bias, both suggest that manipulating electability salience has downstream effects.
There is also good reason to expect that there will be a specific, gender-related effect of electability salience because of strategic discrimination (Bateson 2020). The logic of strategic discrimination suggests that individual primary voters may prefer not to vote for women candidates, not because the voters themselves are personally opposed to electing women, but because they fear that women candidates will be less likely to win in the general election. Rather than owing to first-order misogyny, such individuals may reason that other voters would be misogynist, and therefore less likely to vote for the woman nominee. In our context, we expect that the logic of strategic discrimination will become more available as a cognitive resource to participants when it has been made salient more recently.
Questionnaire, measurement, and data
On January 15–16, 2020, we fielded an online survey of Democratic party identifiers. 3 We asked respondents about seven candidates for the Democratic presidential nomination who were leading in polling averages at the time: Joe Biden, Michael Bloomberg, Pete Buttigieg, Amy Klobuchar, Bernie Sanders, Elizabeth Warren, and Andrew Yang.
Respondents registered preferences (u C ) using a slider to indicate how much they would “prefer for each candidate to become President” on a scale from 0 to 100. We explicitly used the word “preference” (rather than “feelings”) and asked that respondents “ignore their chances of winning.” To facilitate a meaningful interval scale, we explain that “placing candidates farther apart indicates a larger difference in preference than candidates you put closer together” and instruct that “if two candidates are equally preferred, give them the same number.” We first ask respondents to rate Donald Trump, then randomize the order of the Democratic candidates and an attention check (asking to drag the slider to 27).
To measure electability (p C ), we asked respondents to “indicate each candidate’s likelihood of winning against Trump in terms of a percentage chance out of 100.” We provide guidance that “0 means will certainly lose to Trump,” “50 means complete toss up,” and “100 means will certainly defeat Trump,” and explicitly instruct them to ignore their preferences (“ignoring who you want to win”). We randomize the order of candidates, again including an attention check (asking them to drag the slider to 88).
We manipulate electability salience by randomizing the order of elicitation for preference and electability, separating the two with a distractor task. Following the second elicitation, respondents completed a second distractor. Finally, we elicited candidate rankings by asking respondents to “rank the candidates in terms of how likely you are to vote for them if they are on the ballot in your state’s Democratic primary or caucus in 2020.” Respondents indicated intentions graphically, by dragging candidates’ names into the desired order. This experimental design is premised on the idea that, because each elicitation task is cognitively challenging, the cognitive content required for the second task will be more available when participants are finally asked to rank candidates.
The survey yields ready measures of both preferences and electability, but we must derive a measure of expected utility. To do so, we combined their observed preferences and electability measures for each candidate with those for Trump. Formally, a voter’s expected utility for candidate C is equal to p C u C + (1 − p C )u T , where u T is their indicated preference for Trump.
We use these measures to classify the types of respondents as preferences only, electability only, or expected utility. To that end, we estimated three separate rank-ordered logit models (Allison and Christakis, 1994) of the (reversed) candidate rankings. Each model corresponds to one type, and includes the single regressor identified with that type. For each model, we calculated (martingale) residuals (Box-Steffensmeier and Jones, 2004), and determined each respondent’s type based on the model that yielded the smallest sum of squared residuals over the seven candidate rankings. 4
We recruited our sample via Lucid, using target quotas to approximate the gender, age, racial, ethnic, educational, and regional characteristics of self-identified Democratic primary voters in the 2016 ANES and registered Democratic voters in the 2018 CCES (see Supplemental Appendix B), ultimately receiving 1211 complete responses. To test covariate balance, we used equivalence testing (Hartman and Hidalgo, 2018), and rejected null hypotheses of differences between treatment conditions for all covariates (Supplemental Appendix C). Our focus is on the effect of elicitation order on the type classifications of respondents. For robustness, we also directly estimated treatment effects as multiplicative interactions of elicitation order on each of the three regressors in a single rank-ordered logit model of rankings. Results are similar to those we present here (Supplemental Appendix D). For analysis, we focus on the subsample of respondents who failed no more than one of our three included attention checks (Berinsky et al., 2014), who did not indicate voting for Trump in 2016, and who rated Trump as their least preferred candidate in our preference elicitation, leaving us with 833 observations. All analyses were also conducted on the full dataset of 1211 respondents (Supplemental Appendix E), and we indicate all instances in which the datasets yielded different inferences.
Results
Summary of results by candidate.

The table displays overall average rankings of candidates, which are interpretable as Borda counts, along the percentage of participants in each treatment condition that listed each candidate as their first choice. The final column reports the differences in percentages by treatment for each candidate, along with two-sided p-values based on pairwise t-tests.
Turning to the effect of salience on participant types, we find that electability factors into the vote choices of most respondents (59%), either on its own (21%) or via expected utility (38%). Although previous research suggests that pluralities of voters’ behavior conformed to expected utility in primary elections from the 1980s, we find instead that a plurality are preferences-only types (42%), suggesting changes in behavior over the past four decades.
Figure 1 displays a ternary plot of average types in each treatment condition, as estimated with a multinomial logistic regression of types on Electability Last, which equals 1 in that condition and 0 otherwise. We used the model to calculate mean predicted probabilities for each condition, estimating uncertainty with 1000 bootstraps over respondents. Comparing conditions, we see that the mean type is significantly closer to the electability-only vertex (top) in the “Electability Last” condition than in the “Preferences Last” condition. The figure displays a ternary plot of the mean types in each treatment condition. Each vertex of the triangle indicates a distribution composed entirely of one type, and the center of the triangles indicates a completely mixed distribution. When electability is elicited last, the distribution tends toward the (top) electability vertex.
Figure 2 depicts the effects of electability salience on the prevalence of each type. When electability is elicited last, the probability a respondent is an electability-only type increases by 12 percentage points relative to when preferences are elicited last (95% interval = [6, 18], p = 0.002). Concomitantly, the probability a respondent is a preferences-only type declines by 10 percentage points when electability is elicited last ([−17, − 4], p < 0.001). There is no significant difference in the probabilities of an expected utility type across conditions. We conclude that electability salience increases the probability that voters rely on it exclusively in decision making, without making them more rational. The result is robust to forgoing our measure of voters’ types, and instead directly regressing candidate rankings on measures of preferences, electability, expected utility, and the interactions of each with Electability Last (Supplemental Appendix D). The figure displays estimated average effects of elicitation order on the predicted probabilities of types. When preferences are elicited last, there is a statistically significant increase in the probability of a respondent being classified as a preferences type, with a concomitant change in the probability of being an electability type when it is elicited last.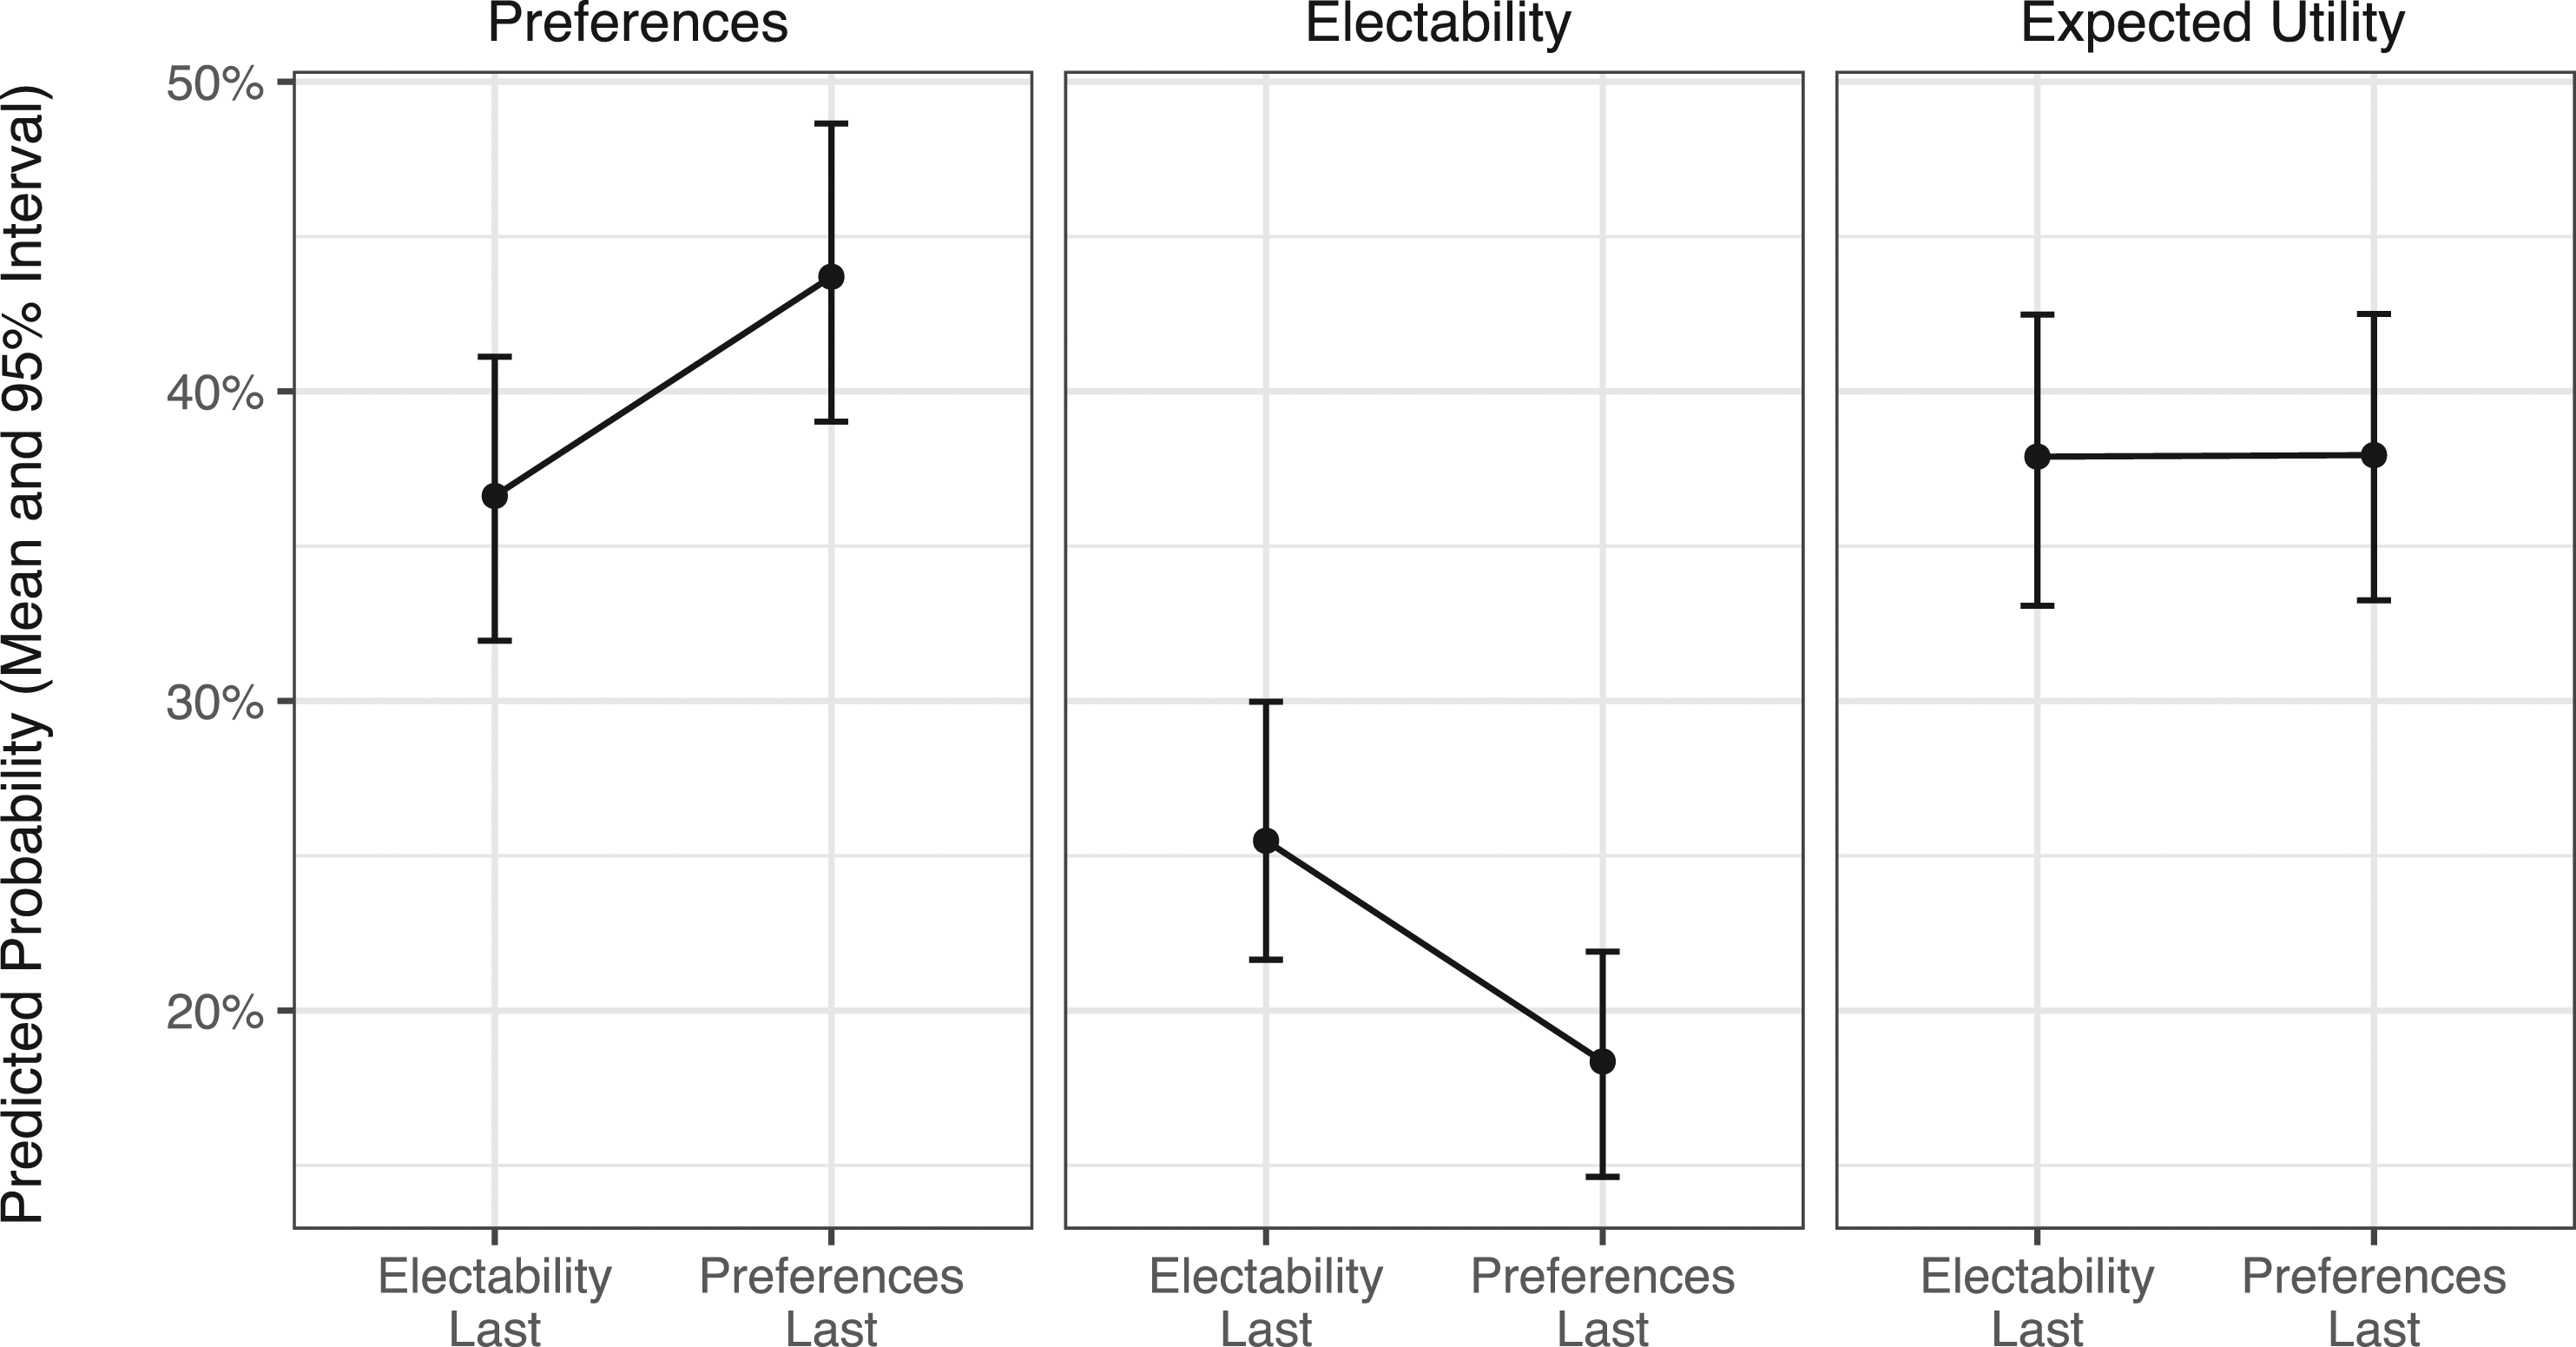
Finally, we examine whether electability salience benefits men candidates. Overall, comparing men and women candidates, the former were rated 4 points more preferred and 7 points more electable (both on 0–100 scales), and men were placed 0.3 ranks more highly. To test the effect of salience, we estimate a linear model, regressing reversed candidate rankings on Electability Last, an indicator for whether the candidate was a man, and their interaction. Reversing rankings means that positive changes correspond to better rankings in the “Electability Last” condition than in the “Preferences-Only” condition. We use this model to estimate the effect of Electability Last for each gender, and estimate uncertainty with 1000 bootstrap resamples over respondents.
Electability salience appears to have produced a net benefit to men. These findings are illustrated in Figure 3, which presents the estimated average effect on rankings by gender. On average, men saw their rankings increase by 0.07 [0.01, 0.13] on the ranking scale (1–7), while the women candidates saw theirs decline by −0.18 [−0.32, − 0.02]. These changes are not large, but the difference in effects is statistically significant (p = 0.02). The result is similar in sign and magnitude, but statistically insignificant when we include respondents who failed multiple attention checks, who supported Trump in 2016, or who did not rank Trump as their least preferred candidate (Supplemental Appendix E). To further explore the potential for variation between candidates, we fit a version of the regression model used to generate Figure 3, but rather than including a dummy variable for Women, we included interaction terms of elicitation order with each candidate. We excluded the constituent term for elicitation order, which means that we effectively produced conditional average treatment effects for each candidate, rather than a comparison of each candidate against some arbitrary reference choice. As with Figure 3, results are interpretable on the scale of rankings. We found that these effects were negative for both women and positive for all men except for Buttigieg.
6
This analysis partially confirms that electability salience had negative effects on rankings for women as opposed to men, though it also suggests a more nuanced conclusion. The figure displays the estimated average effects of eliciting electability last on the (reversed) rankings of men candidates as compared to women, with 95% intervals. Electability salience appears to benefit men candidates at the expense of women.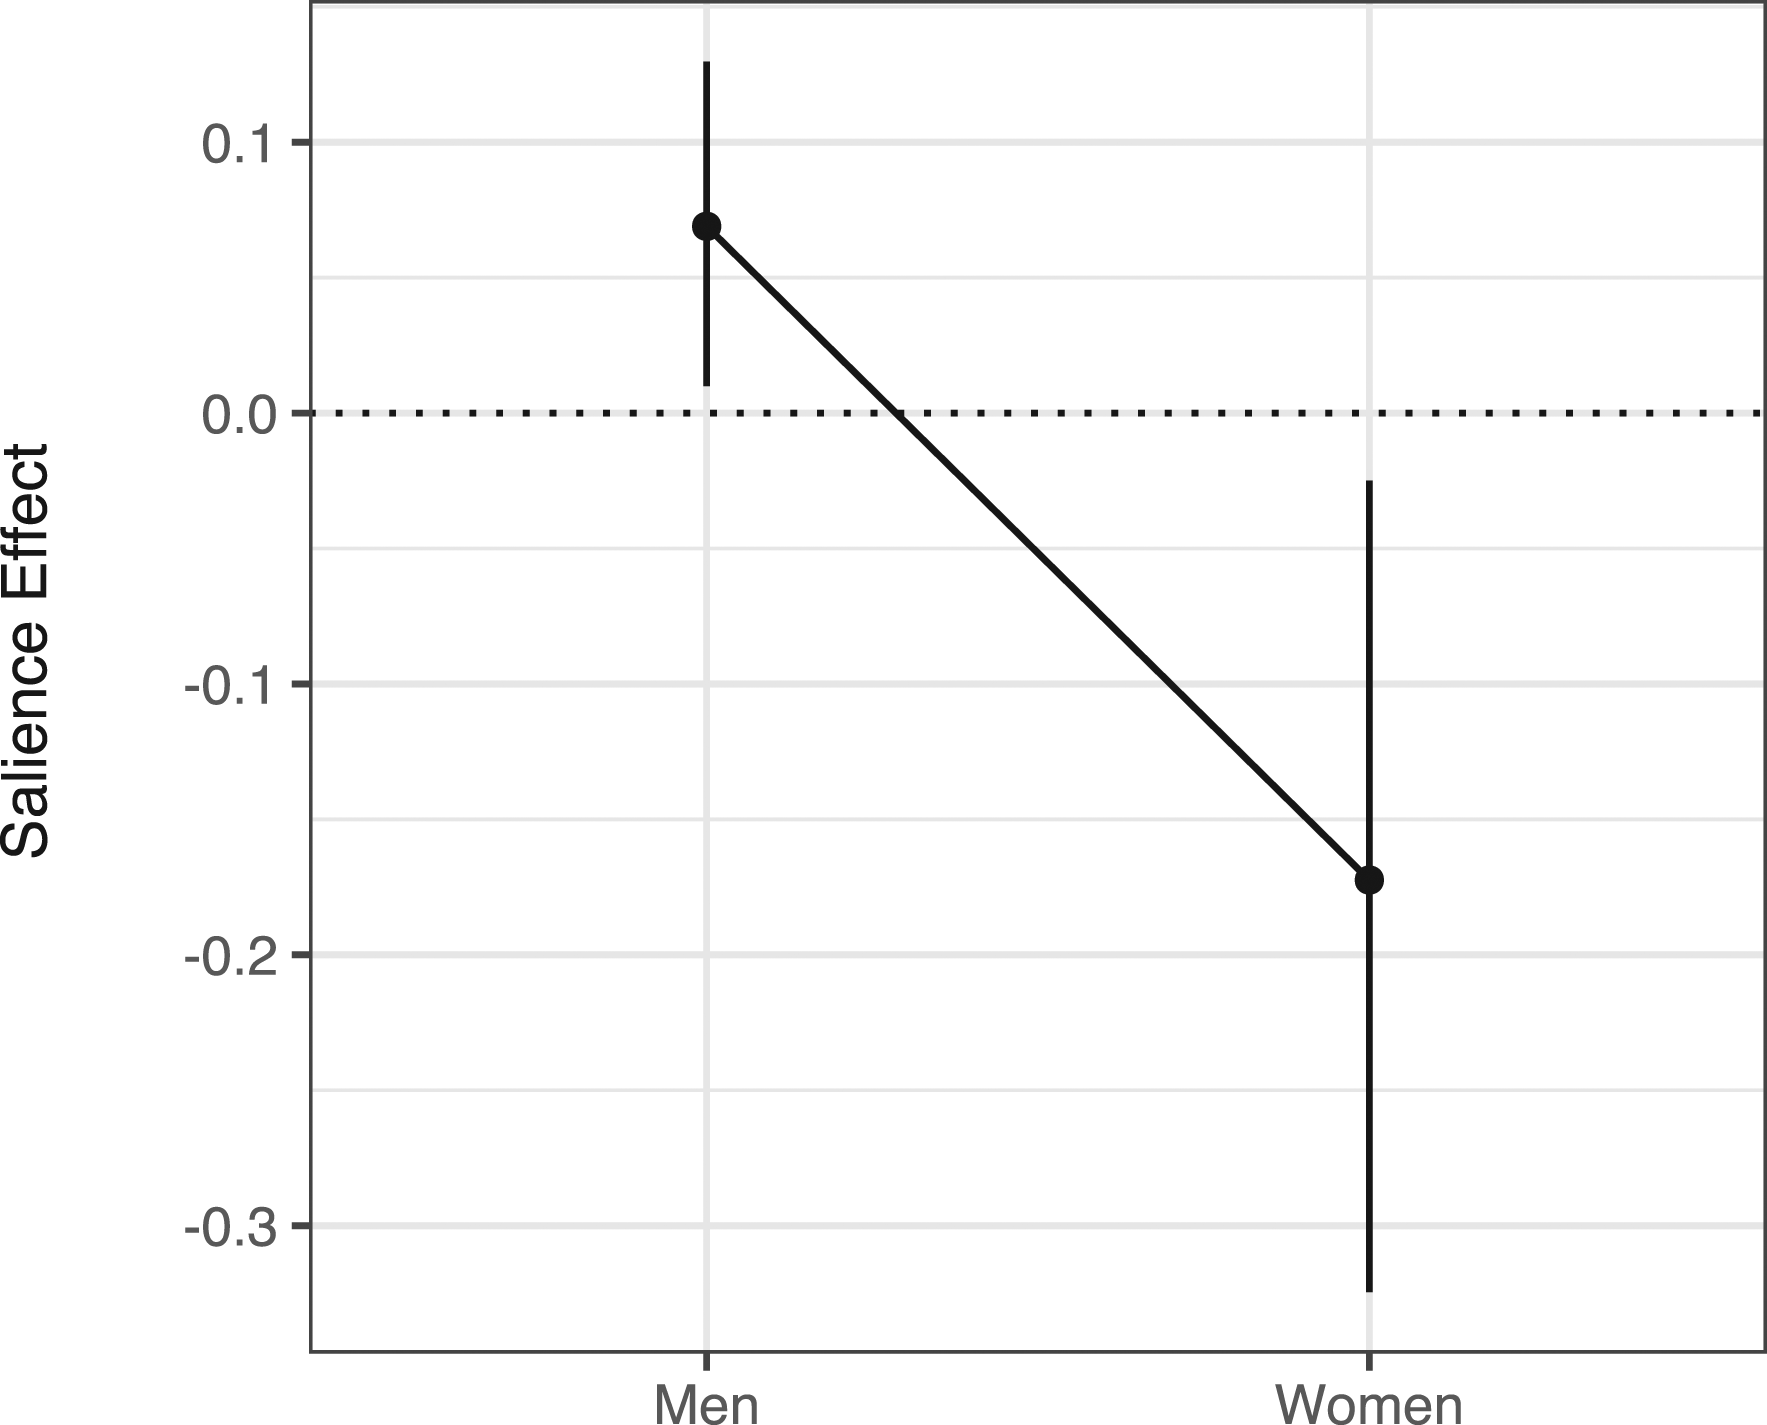
Conclusion
We study the effects of electability salience on voter decision making and candidate ranking. Overall, we find that the effect of electability salience on aggregate vote choices is driven primarily by changes among low-ranked candidates. Further, we show that, unlike in studies of primary voting in the 1980s, a plurality of respondents in our sample made decisions consistent with a preferences-only rule, rather than expected utility. Moreover, while electability salience increased the chances that a respondent made decisions based on electability alone, it did not have a perceptible effect on whether a voter behaves rationally (i.e., consistent with expected utility theory). Finally, we observe evidence consistent with the idea that electability salience caused respondents to rank men candidates more highly, at the expense of women. This effect may result from a compound of differences in both preferences and electability perceptions, as respondents rated women candidates as both less preferred and less electable than their competitors on average, with the gap in electability larger than that for preferences. The finding is consistent with the case against “electability” made by critics during the 2020 primary season.
Notwithstanding the clarity and coherence of these findings, our study has at least four important limitations. First, we lack the ability to characterize whether perceptions of electability were accurate, or whether, in some cases, for example, because of media discussion, electability salience may improve those perceptions. Second, our study is silent on the origins of beliefs about electability. Those origins are important because perceptions of electability could be objective and yet remain unfair, for example, if they are based on accurate estimates of other voters’ biases (Bateson, 2020; Green et al., 2021). Third, we used actual candidates in the 2020 Democratic presidential primary. As usual, there is a tradeoff between using actual and hypothetical candidates. Our use of actual candidates is advantageous in that it provides a difficult test, given that, in many cases, respondents may have already-formed preferences and beliefs, meaning that electability salience has a high barrier to cross if it is to have an effect. However, this design choice also means that there are only two women candidates in the study, meaning that it is difficult to generalize our results illustrating the effect of electability on women candidates’ prospects. For example, had we run a similar experiment in the 2016 Democratic presidential primary, with Clinton and Sanders, we may have observed the opposite effect. Fourth, our study does not permit us to identify which individuals are most influenced by electability salience, nor does it reveal the mechanisms by which campaigns can raise or lower it. Future work should focus on addressing each of these limitations.
Nevertheless, our findings are consistent with the idea that mere discussion of electability in mass and social media has the potential to alter voter decisions. Even in the (perhaps unlikely) best case scenario, in which voters’ perceptions track objective information, electability salience shifts voters from a myopic focus on one dimension to another—from preference to electability—and is insufficient to motivate voters to use the more rational and cognitively complex decision rule. It remains possible that such discussion might encourage voters to seek out information that could improve their beliefs about candidates’ objective electability, though such improvements would not necessarily reduce disparities in descriptive representation. Whether voters seek more information, whether their beliefs become more accurate, and whether such beliefs conduce toward further inequality are important questions for further inquiry.
Supplemental Material
Supplemental material - Electability salience can bias voting decisions
Supplemental material for Electability salience can bias voting decisions by William Minozzi and Jonathan Woon in Research & Politics
Footnotes
Acknowledgements
The authors thank Kaitlin Engelbrecht, Jon Green, and Abby Kielty for helpful feedback.
Declaration of conflicting interests
The author(s) declared no potential conflicts of interest with respect to the research, authorship, and/or publication of this article.
Funding
The author(s) received no financial support for the research, authorship, and/or publication of this article.
Correction (June 2025):
Supplemental material
Notes
References
Supplementary Material
Please find the following supplemental material available below.
For Open Access articles published under a Creative Commons License, all supplemental material carries the same license as the article it is associated with.
For non-Open Access articles published, all supplemental material carries a non-exclusive license, and permission requests for re-use of supplemental material or any part of supplemental material shall be sent directly to the copyright owner as specified in the copyright notice associated with the article.