
Abstract
Photo identification (ID) laws are often passed on the premise that they will prevent voter fraud and/or reduce perceptions of electoral fraud. The impact of ID laws on perceptions of electoral fraud remains unsettled and is complicated by widespread confusion about current voting requirements. In the 2017 Virginia election, we fielded an experiment, with an advocacy organization, evaluating the effects of the organization’s outreach campaign. We randomized which registered voters were mailed one of three informational postcards. After the election, we surveyed subjects about electoral integrity and their knowledge about election laws. We find that providing registrants with information on the state’s photo ID requirements is associated with a reduction in perceptions of fraud and increased knowledge about voting requirements.
Inroduction
The US Supreme Court decision in Crawford v. Marion County Election Board, 553 U.S. 181 (2008) rested partly on the rationale that possible burdens from photo identification (ID) laws should be balanced against actual and perceived reductions in electoral fraud. There is scant evidence of systematic, in-person voter fraud in US elections (e.g., Cottrell et al., 2018; Levitt, 2007), but whether (and how much) photo ID requirements reduce perceptions of voter fraud remains an open question. Perceived voter fraud in states with strict voter ID laws is generally comparable to states without strict ID laws (Cantoni and Pons, 2019; Stewart et al., 2016), which suggests that ID laws have little impact on views of electoral fraud. However, the public is routinely uninformed about their states’ voter ID requirements (Stewart et al., 2016). The widespread lack of knowledge about voter ID laws advances the possibility that perceptions of election fraud could shift as the public becomes more knowledgeable about their state’s voting restrictions.
We experimentally evaluated the relationship between expanding knowledge about photo ID requirements and views about the pervasiveness of electoral fraud in the 2017 Virginia election. We partnered with the League of Women Voters (LWV) to design and deliver informational postcards detailing the state’s photo ID requirement. We obtained a sample of registered voters who were randomly assigned either to a no-contact control group or one of three treatment groups to whom single, informational postcards were mailed prior to the election. We surveyed subjects after the election to assess their views on the pervasiveness of electoral fraud in the 2017 election and their knowledge about the state’s voting requirements. The postcard mailers appear to have reduced (but did not eliminate) perceived voter fraud and increased overall knowledge about voting procedures among subjects who were randomly assigned to a treatment group.
We proceed as follows. In the next section we briefly summarize the literature on this topic and develop our theoretical expectations. We then describe our experimental procedures and present the results of our study. We conclude by considering the implications, acknowledging limitations, and offering ideas about potential extensions of this research.
Background and expectations
Proponents of voter ID requirements often justify ID restrictions on the grounds that ID laws protect against voter fraud and promote the integrity of elections (Mazo, 2018). However, these purported benefits are rebutted by critics who point to the lack of evidence that systematic in-person voter fraud exists (e.g., Cottrell et al., 2018; Levitt, 2007). Even though in-person voter fraud is a rare occurrence, large percentages of Americans believe that voter fraud is common. This is especially true among Republicans who are more likely than Democrats to believe that voter fraud is widespread (Atkeson et al., 2014a; Bowler and Donovan, 2016; Gronke et al., 2019; Wilson and Brewer, 2013). These partisan divisions appear to extend to the elite level as well (Bowler and Donovan, 2016), as evidenced by the passage of more rigorous ID restrictions in states where Republicans controlled the legislatures at the time of enactment (Biggers and Hanmer, 2017; Hale and McNeal, 2010).
The potential relationship between voter ID laws and reduced perceptions of electoral fraud has primarily been assessed by comparing public opinion across states with differing laws. The comparisons suggest that ID laws generally fail to reduce perceptions of electoral fraud, as perceived levels of voting fraud are similar between states with and without strict ID laws (Ansolabehere, 2009; Cantoni and Pons, 2019; Stewart et al., 2016). Even within states that have voter ID requirements, the direct experience of individuals who recall a poll worker requesting they present an ID is generally not associated with elevated confidence in the integrity of the election relative to individuals who did not report showing an ID (Ansolabehere and Persily, 2007). However, ID laws are not uniformly understood or implemented by poll workers (Atkeson et al., 2014b), and some groups of voters tend to face more scrutiny at the polls (Atkeson et al., 2010); additionally, individuals who recall being asked for an ID may differ from those who do not recall an ID request.
The failure to detect differences in public opinion about electoral fraud between states with and without various ID requirements could be attributed to widespread confusion about ID requirements. Moreover, many Americans are uninformed (or even misinformed) about their state’s ID requirements (Jones, 2016; Stewart et al., 2016). A 2015 survey, for example, revealed that, among survey respondents who lived in a state that did not require any documentation to vote, less than one-third was knowledgeable of that fact. Respondents who lived in states with strict photo ID requirements were somewhat more informed, with only 57% correctly answering that their state required a photo ID at the polls (Stewart et al., 2016). The lack of knowledge about ID laws aside, most Americans profess a belief that voter ID laws reduce and prevent electoral fraud (Atkeson et al. 2014a; Stewart et al., 2016). If the public actually believes that voter ID laws reduce electoral fraud, then raising awareness about the existence of ID requirements should reduce how much electoral fraud they believe occurs in their state. We test this hypothesis by designing and implementing a randomized field experiment described in the next section.
Experimental design
We examine the potential relationship between informing registered voters about photo ID laws and their views about voter fraud by conducting a randomized experiment in the context of the 2017 Virginia election. In 2017, Virginia had a strict photo ID mandate requiring all individuals who intended to cast a ballot in person to present a valid photo ID. We worked with the LWV to produce and distribute educational postcards designed to inform the public about the ID requirements. Following the election, we conducted a telephone survey measuring both perceptions of electoral fraud and knowledge about the state’s ID requirements among experimental subjects. Our experiment was designed as follows. We obtained a random sample of 28,000 registered voters drawn from the official, Virginia voter file. Because we planned to collect outcome measures by a telephone survey following the election, eligibility was limited to registered voters with a known landline phone number and restricted to one registered voter per household. To create groups that were closely balanced in terms of pre-treatment characteristics, we used block randomization (blocking on age group, gender, 2013 turnout, and 2016 turnout) to assign experimental subjects to one of four conditions. Subjects were randomly assigned to either a no-contact control group or to one of three treatment groups that were sent an informational postcard (described below).
Our outcome measures were collected by conducting a brief, automated telephone survey using interactive voice response technology. The post-election survey was fielded during November 8–13, 2017. The survey probed respondents about perceptions of electoral fraud, knowledge about Virginia voting requirements, basic demographics, and other topics (full questionnaire is in the Online Supplemental Appendix). All 28,000 subjects were called for the survey. Both nonresponse and breakoffs are generally higher for automated phone surveys without live callers (Tourangeau et al., 2002), which was true for our survey. 1 A total of 1090 individuals (3.89%) answered our main substantive question on perceptions of electoral fraud, but only 431 of them (1.54%) reported demographic characteristics (age group and gender) that matched their corresponding records in the voter file. 2 Accordingly, our analyses focus on this sample of subjects. Unsurprisingly, these 431 individuals tended to be older and to have voted at higher rates in recent elections than the full sample of 28,000 registered voters in the field experiment, which is often the case when conducting political surveys. 3
Overall, among the complete, original sample, 1.40% of subjects randomly assigned to the control group and 1.59% of individuals randomly assigned to a treatment group were successfully surveyed. The response rate is slightly higher among subjects assigned to the treatment groups, however the difference is not statistically significant (p = 0.28, two-tailed). An examination of the demographic characteristics of survey participants reveals minor and insignificant differences between the treatment and controls groups. A balance Table is included in the Online Supplemental Appendix. Further, an F-test of the significance of available pre-treatment covariates on treatment assignment is insignificant (F(10, 420) = 0.85; p = 0.58), confirming balance across experimental conditions among survey respondents.
Postcard treatments
We partnered with the LWV to design and distribute postcards modeled after mailers used in earlier ID experiments (see Citrin et al., 2014). The postcards featured an American flag background overlaid with informational text about voting in the upcoming election. The LWV logo appeared on each card (images are in the Online Supplemental Appendix). Individuals received one of three different versions. Each postcard displayed the following:
The second version expanded on the above information by also detailing the process of casting a provisional ballot if the individual arrives at their polling location without an acceptable form of photo ID. The third version included all of the information on the second version and additional details that “some studies show ID requirements disproportionately affect women, young people, the elderly, and communities of color.” The various versions of the postcards were intended primarily to evaluate if frames highlighting the disproportionate impact of ID laws on certain demographic groups boosted turnout. 4 When evaluating the impact on perceptions of voter fraud, we consider the postcards together since each contained the relevant informational elements.
Results
Our key outcome measures assess perceptions of election fraud as well as knowledge about voting procedures in the 2017 Virginia election. Specifically, survey participants were asked, “Which of the following best describes your opinion of the November 2017 election in Virginia? Do you think no fraudulent votes were cast, not that many fraudulent votes were cast, some fraudulent votes were cast, or many fraudulent votes were cast?” This variable is coded, from “1” to “4,” where “1” represents “no” and “4” represents “many” fraudulent votes were cast. Overall, a plurality (43%) of respondents believed that no fraudulent votes were cast, 21% reported not that many fraudulent votes were cast, 23% reported some fraudulent votes were cast, and 13% reported many fraudulent votes were cast in the 2017 Virginia election. Both means (Panel A) and distributions (Panel B) of responses by experimental condition are depicted visually in Figure 1. Panel A shows that the mean rating on this scale was lower for the treatment group (mean (M) = 2.01, standard error (SE) = 0.06) than for the control group (M = 2.18, SE = 0.12), suggesting that perceptions of fraud were, as expected, somewhat lower for subjects exposed to our treatment, but the difference is not statistically significant at traditional levels (p < 0.17, two-tailed). Panel B also reveals some compelling differences in the distributions of responses across experimental conditions. While comparable numbers of subjects assigned to treatment and control conditions believed “no” (44% and 42%, respectively) or “many” (12% and 15%, respectively) fraudulent votes were cast (the two extreme positions), comparatively more subjects in the treatment group (23%) believed “not that many” fraudulent votes were cast, relative to subjects in the control group (13%), and comparatively more subjects in the control condition (30%) responded they perceived that “some” fraudulent votes were cast, compared to subjects who were treated (21%). In fact, subjects randomly assigned to a treatment group reported that “no” or “not that many” fraudulent votes were cast (the two response categories that denote lower levels of electoral fraud perceptions) more frequently than individuals randomly assigned to the control group, with differences of 2 and 10 percentage points, respectively. The control group, on the other hand, reported that “some” or “many” fraudulent votes were cast (the two response categories that denote higher levels of electoral fraud perceptions) more often than subjects assigned to the treatment groups. A Chi-square (χ2) test reveals that the difference in the overall distributions across experimental conditions approaches statistical significance (χ2 (3) 6.6592 p = 0.084).
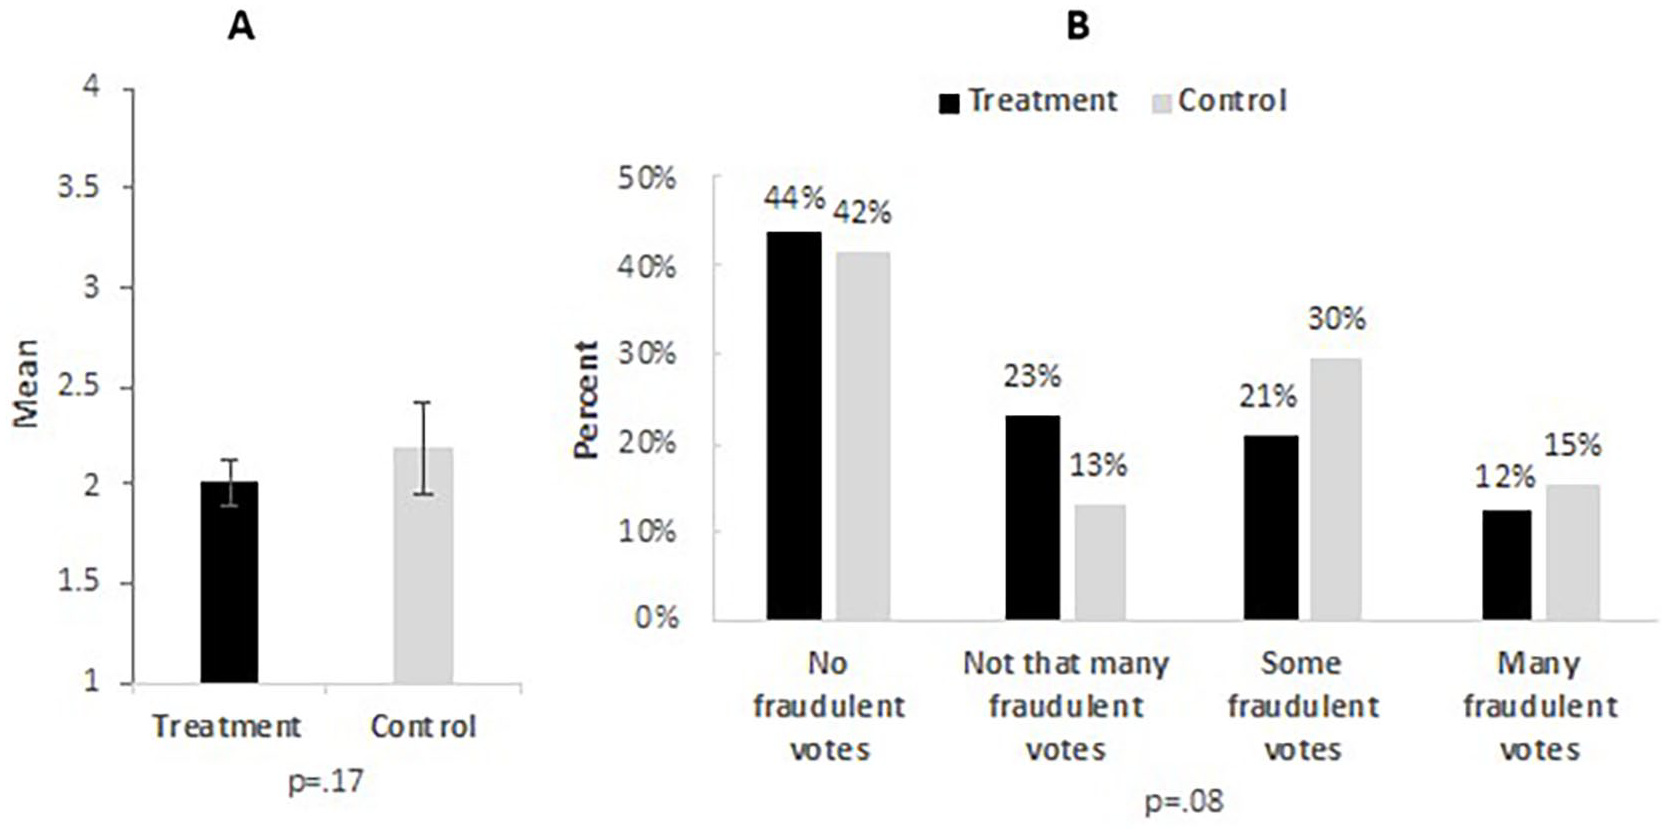
Perceptions of fraudulent votes cast in the 2017 election.
We further investigate the possibility that the outreach campaign may reduce perceptions of the prevalence of voter fraud in elections using an ordered logistic regression model. We regress the ordinal measure of voter fraud prevalence on an indicator variable for assignment to a treatment group, both with and without pre-treatment covariates to account for imbalances due to chance. All pre-treatment covariates were obtained from a nationally-reputable vendor that provided the voter file and included party affiliation, age, gender, turnout in the previous gubernatorial election, turnout in the previous presidential election, and turnout in the 2017 primary. The regression results are displayed in Table 1. The evidence suggests that informational mailers informing registered voters of the state’s photo ID law reduced perceptions of voter fraud among our experimental subjects, with statistically significant effects for the covariate-adjusted model.
Perceptions of voter fraud prevalence in the 2017 Virginia election.

Note: each cell contains the coefficient with the standard error in parentheses from an ordered logistic regression model. The question wording is “Which of the following best describes your opinion of the November 2017 election in Virginia? Do you think no fraudulent votes were cast (1), not that many fraudulent votes were cast (2), some fraudulent votes were cast (3), or many fraudulent votes were cast (4)?”, and the question was asked to all respondents. p-values are two-tailed. *p < 0.05.
We use the covariate-adjusted model to estimate the marginal treatment effects to contextualize the impact of the ID information on perceptions of voter fraud. On average, registered voters who were randomly assigned to a treatment group were 9.5 percentage points more likely than registered voters assigned to the control group to report that no fraudulent votes were cast in the 2017 election (p = 0.02). The difference across conditions for the “not that many fraudulent votes” category was slim, with individuals assigned to the treatment group being more likely to select this category by 0.2 percentage points on average. Assignment to a treatment group is also associated with a decreased likelihood of indicating that some or many fraudulent votes were cast. On average, registered voters assigned to a treatment group were 4.1 (p = 0.02) and 5.7 (p = 0.03) percentage points less likely to indicate that some or many fraudulent votes were cast, respectively. Overall, these estimates suggest that the photo ID information reduced perceptions of electoral fraud among treated survey subjects compared to their counterparts in the control group.
Knowledge about voting requirements
Our survey also included a manipulation check to gauge knowledge about information that was provided on two of the postcards. These mailers noted, “If you arrive at your polling place without an acceptable form of photo ID, you will be given the opportunity to cast a provisional ballot that will be counted if a copy of your photo ID is delivered via fax, email, in-person submission, or through USPS [United States postal Service] or commercial delivery service to the voter registration office.” The final, substantive survey item asked, “Do you happen to know what happens if voters in Virginia attempt to vote but they do not have an acceptable form of photo ID? Are voters without an acceptable form of photo ID not allowed to cast a ballot of any kind, or are they allowed to cast a provisional ballot? Press 1 if ‘Voters without an acceptable form of photo ID are not allowed to cast a ballot of any kind’ (coded as 0). Press 2, if ‘Voters without an acceptable form of photo ID are allowed to cast a provisional ballot’ (coded as 1). Press 3 if you ‘don’t know’ (coded as 0)”. Almost half (48%) of the survey participants correctly answered this question. We test whether the relevant treatments increased knowledge about provisional ballots by estimating a linear probability model in which the dependent variable equals “1” for subjects who answered correctly, and “0” for individuals who did not. 5
Subjects who were randomly assigned to receive either of the two postcard treatments that included the relevant information about casting a provisional ballot are collapsed together into a single group; similarly, we combine subjects in the no-contact control group and those assigned to the postcard condition that did not detail the provisional ballot process into a separate group. Our analyses, reported in Table 2, suggest that subjects who were randomly assigned to receive a postcard treatment that provided factual information about casting provisional ballots were significantly more likely to report accurate knowledge about provisional ballots compared to subjects who were not assigned to receive this information. In fact, the estimates imply that the experimental treatments boosted the rate of correct responses by about 11 or 12 percentage points, on average, for these experimental subjects. Furthermore, respondents who answered the knowledge item correctly reported perceiving significantly less voter fraud in the 2017 election than respondents who reported either not knowing or selected the incorrect response option. This finding implies that becoming more knowledgeable about voting procedures is likely a mechanism for reducing perceptions of voting fraud, with a difference in means on the electoral fraud perceptions item of 0.21 (SE 0 = 0.10, p < 0.05, two-tailed).
Knowledge about voting requirements.

Note: each cell contains the coefficient with the standard error in parentheses from an ordinary least squares regression model. The question wording is “Do you happen to know what happens if voters in Virginia attempt to vote but they do not have an acceptable form of photo ID? Are voters without an acceptable form of photo ID not allowed to cast a ballot of any kind, or are they allowed to cast a provisional ballot? Press 1 if ‘Voters without an acceptable form of photo ID are not allowed to cast a ballot of any kind’ (coded as 0) Press 2, if ‘Voters without an acceptable form of photo ID are allowed to cast a provisional ballot’ (coded as 1). Press 3 if you ‘don’t know’ (coded as 0)”. p-values are two-tailed. *p < 0.05.
Discussion
Critics of voter ID laws contend that there are many reasons to be concerned about these restrictions. Some assert that these laws are designed to disenfranchise minority or other voters, and several studies find evidence that voter ID requirements target minority populations or are implemented inequitably (e.g., Atkeson et al., 2014b; Stein et al., 2020). On the other side, proponents, including former president Donald Trump, claim that voter ID restrictions reduce election fraud—or at least the perception of electoral fraud—and bolster election security and voter confidence in American democracy (Edge and Holstege, 2016).
In this study, we examine the relationship between awareness of photo ID requirements and perceived election fraud. The randomized field experiment we describe suggests that informing registered Virginia voters that the state required a valid, photo ID to vote at the polls likely reduced perceptions of electoral fraud. This is the first, known study to survey individuals about their views of election fraud following the implementation of randomized, field interventions in which some subjects were assigned to receive educational information about the ID requirement. Our findings provide support for the notion that photo ID restrictions can reduce perceptions of voter fraud when the public learns about these restrictions. The results also stand in contrast to previous studies that have failed to find a link between strict photo ID requirements and actual or perceived electoral fraud (Cantoni and Pons, 2019), suggesting, at a minimum, that this remains an open question warranting subsequent scholarly scrutiny.
Nevertheless, lower levels of perceived voter fraud among American voters resulting from awareness of ID law adoption is noteworthy, despite the fact that evidence of widespread, in-person, voter fraud is exceedingly rare in US elections (Christensen and Schutlz, 2013; Goel et al., 2020). In fact, a comprehensive study of allegations of election and voter fraud in all 50 states from 2000–2012 uncovered only 2068 such allegations out of more than one billion ballots estimated to have been cast during this time period, implying thast the rate of alleged cases of voter fraud per ballot cast was no higher than 0.00021% and leading the authors to conclude that, “while fraud has occurred, the rate is infinitesimal” (Kahn and Carson, 2012). Even if voter fraud is rare, however, perceptions about electoral fraud are important for both confidence in election outcomes and democracy writ large.
Notwithstanding the results we report, we recognize several limitations. We note, for example, that the study relied upon automated telephone surveys, which exclude wireless-only individuals. Subsequent replications and extensions of this work would need to determine whether the findings generalize to broader populations. For instance, registered voters with landline phones differ from wireless-only individuals in both unknown and known ways (e.g., individuals with landlines, on average, are older and vote at higher rates). Future studies can also investigate whether these findings persist in other states and among national samples. Nonetheless, identifying a possible link between photo ID laws and perceptions of electoral fraud is important as the existence of ID laws has been justified partly on the grounds that they have the potential to reduce the risk of perceived voter fraud. Documenting such a relationship between ID requirements and perceptions of voter fraud adds another dimension along which to fully evaluate the effects of ID requirements.
Supplemental Material
sj-docx-1-rap-10.1177_20531680211030435 – Supplemental material for Photo identification laws and perceptions of electoral fraud
Supplemental material, sj-docx-1-rap-10.1177_20531680211030435 for Photo identification laws and perceptions of electoral fraud by Kyle Endres and Costas Panagopoulos in Research & Politics
Footnotes
Acknowledgements
We thank the League of Women Voters for their support and partnership. This experiment was approved by the Institutional Review Board at Fordham University. Earlier versions of this manuscript were presented at the 2018 Election Sciences, Reform, and Administration Conference and the 2018 Annual Meeting of the American Political Science Association; we appreciate the helpful feedback from our discussants and participants at both conferences.
Correction (June 2025):
Declaration of conflicting interests
The authors declared no potential conflicts of interest with respect to the research, authorship, and/or publication of this article.
Funding
The authors disclosed receipt of the following financial support for the research, authorship, and/or publication of this article: This work was funded by the MIT Election Data + Science Lab’s New Initiatives in Election Sciences Grant.
Supplemental Material
Online Appendix
The Online Appendix is available at: http://journals.sagepub.com/doi/suppl/10.1177/20531680211030435. The replication files are available at: ![]()
Notes
Carnegie Corporation of New York Grant
This publication was made possible (in part) by a grant from the Carnegie Corporation of New York. The statements made and views expressed are solely the responsibility of the author.
References
Supplementary Material
Please find the following supplemental material available below.
For Open Access articles published under a Creative Commons License, all supplemental material carries the same license as the article it is associated with.
For non-Open Access articles published, all supplemental material carries a non-exclusive license, and permission requests for re-use of supplemental material or any part of supplemental material shall be sent directly to the copyright owner as specified in the copyright notice associated with the article.