
Abstract
The economic voting literature disagrees over the exogeneity of economic perceptions on individual electoral behavior. One side argues that economic perceptions are driven by partisan dispositions, which then calls into question the substantive importance of this factor in assessing electoral behavior. A second side argues that voters rationally assess the economy and accurately use this information to inform their electoral behavior. This article addresses this disagreement by disentangling economic perceptions from partisan dispositions. Using data from the American National Election Study from 1968 to 2016, we link objective macroeconomic indicators to individual economic perceptions, and then assess its explanatory power on vote choice in US presidential elections. The results indicate that objective economic perceptions have a substantive impact on support for incumbent candidates. Moreover, the estimated effect sizes are consistent with previous research estimating the relative importance of party identification and economic perceptions on vote choice.
Introduction
For well over three decades, researchers have consistently debated the concept of “economic voting.” A recent count shows this research has spawned over six hundred articles and books (Lewis-Beck and Stegmaier, 2019). At a basic level, the hypothesized causal mechanism is consistent across the literature: the economy has an impact on how citizens vote. This concept has been widely studied in the context of the United States (Ansolabehere et al., 2014; Campbell et al., 1960: ch.14; Kiewiet, 1983; Lacy and Christenson, 2017) and also comparatively (Evans and Andersen, 2006; Duch and Stevenson, 2008; Nadeau et al., 2013). Within this literature, there has been consistent debate over how accurately we can assess the economy’s effect on individual vote choice. This has largely revolved around questions of endogeniety of individual economic perceptions. Specifically, are individual economic perceptions an actual reflection of economic conditions (meaning individuals are aware of the national economic situation and responding accordingly), or are these perceptions being shaped by other forces (namely partisanship)?
Take the standard American National Election Study (ANES) retrospective sociotropic question as an example: “Would you say that over the past year, the nation’s economy has gotten better, stayed the same, or gotten worse?” One camp argues that in many cases, the public is viewing this question through a partisan frame, or at the least, if they do view the economy accurately, they attribute blame differently (Anderson, 2007; Evans and Andersen, 2006; van der Eijk et al., 2007; Wlezien et al., 1997). In essence, this camp argues that economic perceptions are actually endogenous to political behavior and preferences. A second camp argues that the public is quite capable of accurately assessing economic conditions and that much of the problem with endogeneity is rooted in modeling issues (Lewis-Beck, 2006; Lewis-Beck et al., 2008). In regard to the the ANES retrospective question, they contend the public is accurately making an assessment and then using this assessment to inform their electoral preferences.
This article attempts to offer additional insight into this debate around the endogeneity issue of economic perceptions. The basic question, then, is can we create a measure of economic perceptions that avoids the partisan bias argued for by the first camp? Essentially, how do we disentangle the two? We are certainly not the first to try. Attempts have been made using a variety of means, including instrumental variable models (Hansford and Gomez, 2015; Lewis-Beck et al., 2008), and even experimental models (Simonovits, 2015). In our attempt, we begin with the efforts of Lewis-Beck et al. (2013) who presented a model for economic perceptions that simply consisted of changes in gross domestic product (GDP), the consumer price index (CPI), and the S&P 500. In their analysis, they showed a strong link between these three objective economic indicators and sociotropic retrospective evaluations. We use this as our starting point to create a predicted objective sociotropic retrospective measure. Given the truly exogenous nature of this variable, we then assess how accurately it predicts vote choice.
Using ANES data from 1968 to 2016, we hope to provide an unbiased and exogenous economic perception measure and assess the explanatory power of such a measure. The contributions promise to be numerous. First, we update the link between the real economy and economic perceptions, beginning with the study by Lewis-Beck et al. (2013), but expanding the years of analysis and, most importantly, directly assessing the connection between economic perceptions and voter preferences. Specifically, we disentangle the sociotropic retrospective perception from other exogenous variables to assess how significant economic perception is when separated from partisan influences. Ultimately, we create a map between the real economy, economic perceptions, and the vote, and assess how accurate this map is.
The endogeneity problem
Given the vast literature on economic voting, it is surprising that the endogeneity argument around economic perceptions persists. The bulk of the economic voting literature relies on the theory that economic perceptions influence vote choice (Dassonneville and Lewis-Beck, 2019; Lewis-Beck and Paldam, 2000; Lewis-Beck and Stegmaier, 2019). It is in the foundations of these economic perceptions that the endogeneity disagreement begins. One side contends that economic perceptions are an outgrowth of our partisan dispositions (Anderson, 2007; Evans and Andersen, 2006; van der Eijk et al., 2007; Wlezien et al., 1997). For example, if the president is a Democrat, Republicans will see the economy as worse and Democrats will see the economy as better, on average. This is not due to actual economic conditions and rationally updating attitudes based on information, but to partisan filtering and motivated reasoning (Bisgaard, 2015; Schaffner and Roche, 2016). Evans and Andersen (2006) use a structural equation model to assess the impact economic perceptions and partisanship have on vote choice. Their research noted that prior partisanship played a significant role in predicting economic perceptions; this led to their conclusion that economic perceptions are not exogenous. More recent work by Schaffner and Roche (2016) noted that partisanship shaped how individuals perceived unemployment numbers in the United States in 2012 (with Republicans significantly more likely to report a higher unemployment rate than Democrats).
The other side contends that economic perceptions are rational assessments based on actual economic conditions (Fraile and Lewis-Beck, 2010, 2014; Lewis-Beck et al., 2013; Nadeau and Lewis-Beck, 2001). The argument here acknowledges the significant explanatory power of partisanship and partisan filtering, but also contends that individuals have the capability to make accurate assessments despite the heavy influence of partisanship. In essence, it is not all about partisanship. For example, Lewis-Beck and colleagues (2013) looked at American national election data from 1968 to 2008 and demonstrated that a parsimonious model of GDP, CPI, and the S&P 500 does extremely well in explaining individual perceptions of the economy. Nadeau et al. (2013) analyzed election survey data from 10 Western European countries. They showed economic perceptions are strongly shaped by the objective economy uniformly across this collection of advanced democracies. Moreover, these perceptions influence vote choice, as voters reward governments for good economic conditions and punish them when the economy is bad. In a comparative analysis of the 2008 and 2011 Spanish elections Fraile and Lewis-Beck (2014) showed that when accounting for possible sources of endogeneity (ideology), economic perceptions maintain an important role in voting.
This debate revolves around the question of whether we can disentangle partisanship from economic perceptions, hence the endogeneity problem. The current literature is in disagreement on whether the two are essentially fused or if they can be broken apart. We use this disagreement as the foundation of our analysis. If we can fix this endogeneity problem by disentangling economic perceptions from partisanship, we can then accurately assess the true explanatory effect of economic perceptions.
Voter perception of economic conditions
We began on our path by linking individual economic perceptions of the state of the “real” or observable national economy as measured by aggregate economic statistics (Stevenson and Duch, 2013). To estimate voters’ perceptions of the economy, as well as the effect of their evaluations on the incumbent candidate in US presidential elections, we use survey data from the pooled ANES. While the ANES has multiple perceived economic condition variables, we use the sociotropic retrospective question on the national economy. This question is selected for two reasons: firstly, we wanted to link exogenous economic conditions to voters’ perceptions about the national economy. Secondly, retrospective evaluation of the national economy is a stronger predictor of candidate preferences than other economic questions, such as pocketbook evaluations (Lacy and Christenson, 2017). The national retrospective question asks individuals whether within the past year the economy has improved, stayed the same, or worsened. We dichotomize the retrospective variable into whether the economy is getting worse versus staying the same or getting better. This is because in the United States, economic growth runs for sustained periods of time compared with recessions, so if an individual says the economy has not changed, this is a positive reflection of the economy (Lewis-Beck et al., 2013). 1 We use national election data from 1968 to 2016 (excluding the years 1970, 1974, 1978, and 2006 where data were not available).
To track performance of the US economy we calculate change in GDP in the first three quarters of each election year. At the national level, economic perceptions and changes in GDP generally move in the same direction. Figure 1 plots the national percentage of individuals who think the economy is getting worse against the percentage change in GDP. The correlation coefficient is r = −0.73, indicating, at the aggregate level, voters’ perceptions track real changes in economic conditions quite well.

Change in GDP versus percentage of voters that believe the economy is getting worse. Pearson correlation coefficient, r = −0.73.
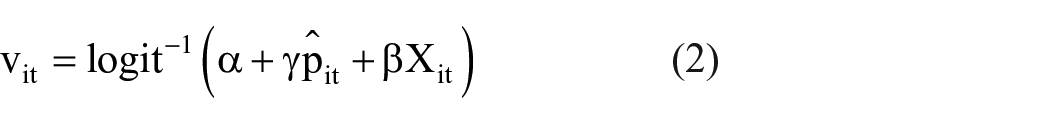
We are ultimately interested in the relationship between economic conditions and candidate support at the individual level. Thus, we now specify a model relating individual voters’ perceptions of economic conditions to demographic and exogenous economic variables. Let pit = 1 if individual i in year t thinks the economy is getting worse and 0 otherwise. We defined Xit as a matrix of individual characteristics, and Zt as a collection of economic indicators: percent change in the CPI, percent change in the S&P 500, and the percent change in GDP. 2 These variables are meant to characterize the objective state of the US economy at a given point in time, and have been used in previous economic voting models (Dassonneville and Lewis-Beck, 2014; Stevenson and Duch, 2013). As pit is binary, we specify the following logistic model:

The economic perceptions section of Table 1 (Models 1–3) presents the results from three model specifications with increasing complexity. Model 1 is an economic model that only includes macroeconomic indicators. Despite its simplicity, it confirms the results from Figure 1, but at the individual level: voters’ retrospective evaluations of the national economy track real changes in the US economy. All three economic variables are statistically significant and the model correctly predicts 72% of the observations. Models 2 and 3 add additional controls for party identification and demographic variables that may influence perceptions of the national economy. 3 Party identification has a negative sign, indicating individuals are less likely to perceive the economy as getting worse if they are in the same party as the president. However, adding this additional control does not significantly improve the overall fit. Model 3 adds demographic and individual economic variables, such as unemployment status, personal income, and personal financial situation. Unsurprisingly, an individual’s personal economic situation plays a role in their overall perception of the economy: an individual who is unemployed and has poor finances is more likely to have a negative perception of macroeconomic conditions. Across all three specifications the macroeconomic variable coefficients are quite stable, varying little across models. This supports the findings of Lewis-Beck et al. (2013) that the sociotropic retrospective economic perception measure is clearly shaped by objective economic conditions.
Relationship between voter perception of the economy and national economic indicators (Models 1–3). Individual objective sociotropic economic evaluation and vote choice (Models 4–6). Errors are clustered by election year. Source: American National Election Study (www.electionstudies.org), weighted data.
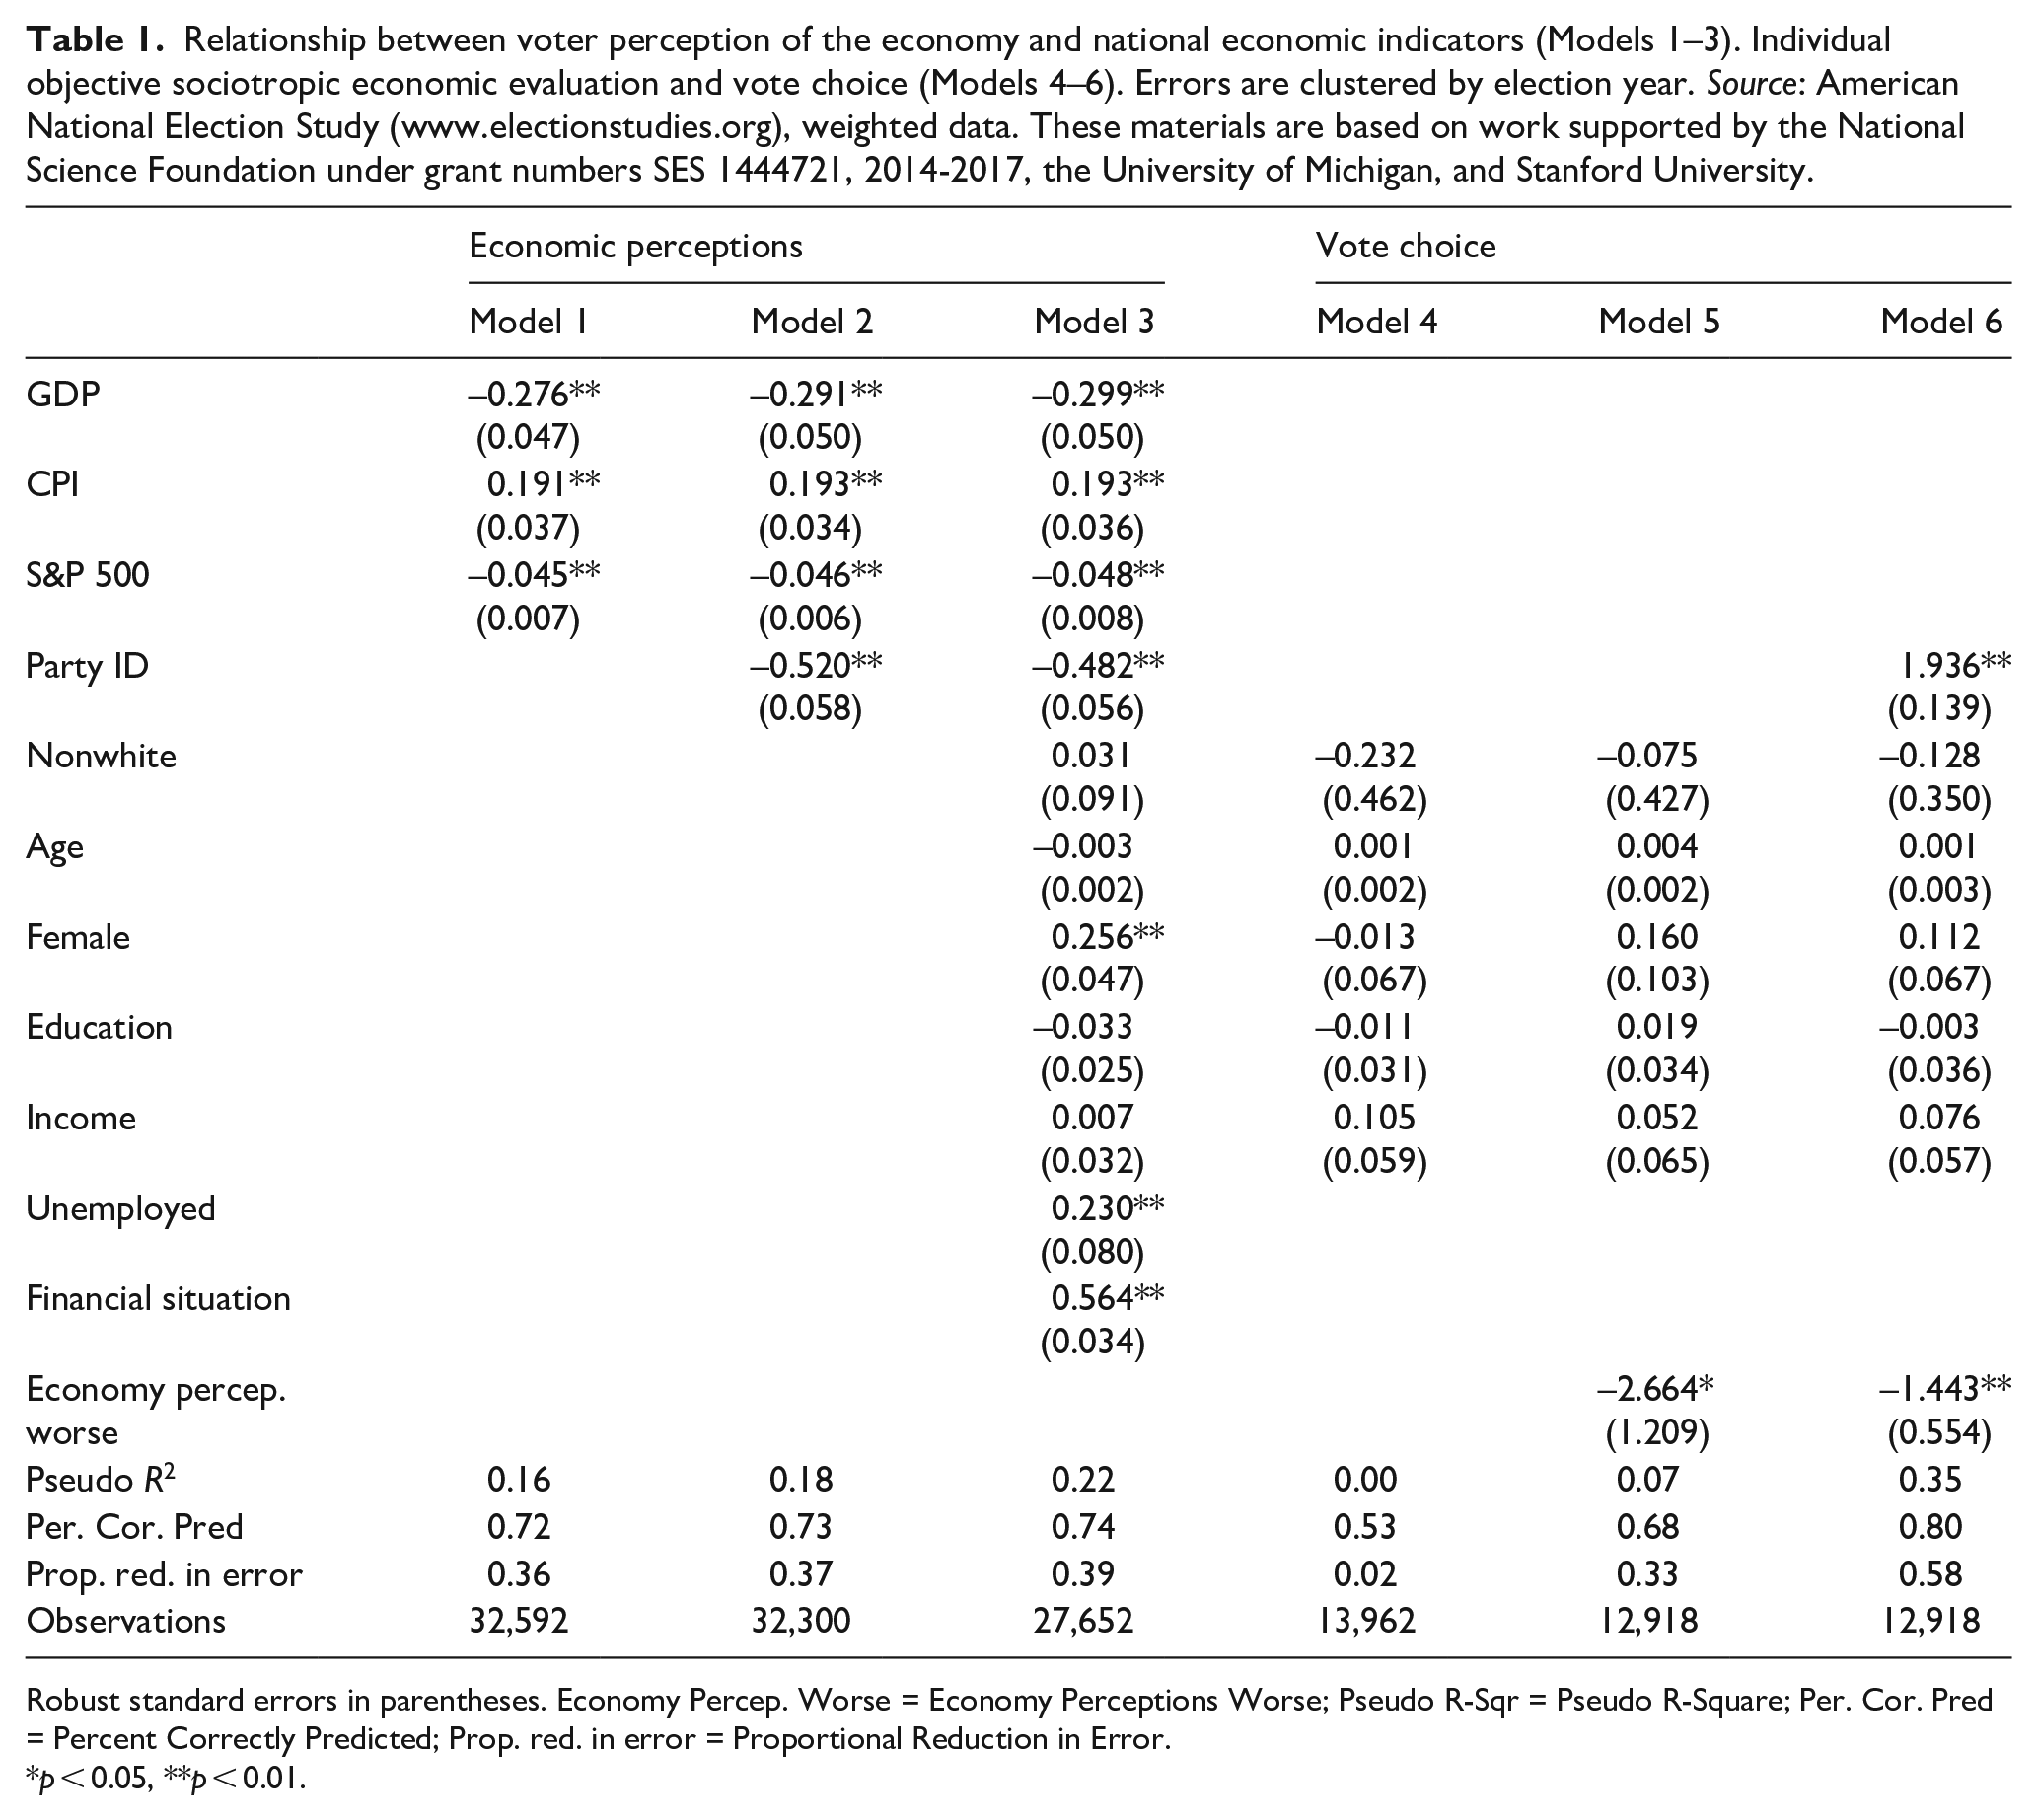
Robust standard errors in parentheses. Economy Percep. Worse = Economy Perceptions Worse; Pseudo R-Sqr = Pseudo R-Square; Per. Cor. Pred = Percent Correctly Predicted; Prop. red. in error = Proportional Reduction in Error.
p < 0.05, **p < 0.01.
Economic conditions on presidential incumbent support
Given the results presented in Table 1, demonstrating that objective economic reality can influence voters’ economic perception, the logical next step, which Lewis-Beck et al. (2013) did not take, would be to assess the impact of that objective economic perception on vote choice itself. To do so we turned to ANES data on the US presidential elections, starting in 1968 in order to be consistent with previous research on national economic conditions and voting (Fiorina, 1981: 29; Kiewiet, 1983: 97). 4 The final year in our sample is the 2016 presidential election. We define vit = 1 if individual i votes for the incumbent in election year t, and 0 otherwise. On the right-hand side of the model we include our estimated sociotropic measure, pˆit, from equation (1). This is the predicted evaluation of the economy using objective economic measures, party identification, and demographic controls. The following logistic model is specified:
Overall, the percent of individuals who vote for the incumbent, our dependent variable, is 52%, consistent with a slight incumbency advantage. Model 4, which only includes socioeconomic variables, explains little variation in voter preference: it correctly predicts 51% of vote choice, roughly the same percent correct had vit been predicted using the mean (Table 1). Model 5 adds the economic perceptions variable, which is highly significant in the model. To ease interpretation of the model coefficients we calculate the average marginal effect (AME) for the primary variable of interest, objective economic perceptions (Williams, 2012). The estimate is –0.58 (0.20), indicating the probability of voting for the incumbent decreases by almost 60 percentage points if a voter believes the economy is getting worse rather than staying the same or getting better. Model 5 remains underspecified, as party identification is known to have a significant effect on vote choice, so we incorporate this variable in Model 6.
Model 6 produces the largest reduction in error. We are able to correctly predict 81% of vote choice, the highest of the three models. The economic perceptions variable is still significant, although its AME is reduced to –0.20 (0.08). Similar to other research, party identification is the strongest predictor of vote choice (Lacy and Christenson, 2017). The AME for party identification is 0.28 (0.01), higher than our economic perceptions variable. However, economic perceptions based on economic reality still drives voter behavior. Therefore, the map from real economic conditions, to voter perceptions, to vote choice is confirmed: voters’ evaluation of the economy is real and they punish or reward the incumbent candidate based on these conditions.
Discussion
With this article, we joined the ongoing debate over the endogeneity problem surrounding economic perceptions and voter preferences. The central problem we aimed to address was whether we could create a viable objective measure of economic perceptions that would avoid the question of endogeneity. Then, with this new exogenous measure, we assessed its explanatory power in relation to the dominant explanation in the literature, partisanship. If we found an exogenous measure of economic voting lacking in explanatory power, the results would support those arguing for the endogenous nature of economic voting. However, if we found an exogenous measure of economic voting to have significant explanatory power, our results would support those arguing that economic voting can stand on its own. Using a two-stage model, we connected real aggregate macroeconomic conditions to voter perceptions of the economy, and ultimately voter behavior in US presidential elections. Our results indicate that objective economic measures (in this case GDP, CPI, and S&P 500) are linked to subjective economic perceptions. We then showed that a measure of economic perceptions made up of these objective economic indicators, along with certain controls, does quite well at helping to explain vote choice. It does not explain vote choice as well as partisanship, but nonetheless played a significant role.
To that end, we believe this research helps to clarify the existing knowledge around the influence of economic voting on vote choice. It also speaks to both sides of the endogeneity argument. To those arguing economic perceptions are endogenous to factors like partisanship (Anderson, 2007; van der Eijk et al., 2007; Wlezien et al., 1997), we acknowledge that when controlling for partisanship, economic perceptions play a lesser role in explaining vote preferences. However, at the same time, while economic perceptions are less influential when controlling for partisanship, they are still significant and substantial. In our final model, the ratio of the party identification and economic perception effect size was 1.40 (i.e., 0.28/0.20). This is consistent with results from Lewis-Beck et al. (2008: Table 1C, 86) who constructed exogenous measures of economic perceptions and party identification to model vote choice. Using ANES panel data, they estimated a party identification to economic perception ratio of 1.15. This is slightly lower, but we were unable to exogenize party identification, which is likely to have inflated the magnitude of our ratio. Further support for our assessments can be found in a recent article by Anderson (2020), which found both a partisan and economic link to vote choice with Canadian Election Study data from 1988 to 2014. Our findings pair nicely with these findings from Anderson (2020) and demonstrate the applicability of this concept is not confined to the United States.
This research also appears timely in the wake of both media and academic assessments that question whether our older models work in a more polarized America. Especially, in the context of the 2016 election and possibly in the 2020 election, there have been claims that other factors, such as race relations, are significant drivers of vote choice. We certainly do not challenge the notion that other factors can be significant in driving vote choice. Each election is unique and issue salience varies from election to election. At the same time, our updated model (including 2016) demonstrates the stability and continuity of economic influence on vote choice. We encourage continued research around the link between a more polarized electorate and the traditional explanations for vote choice (such as economics and partisanship). Outstanding research has recently emeged that helps dissect these relationships (e.g., Green and McElwee, 2019; Reny et al., 2019) but more work is needed.
As decades of research have noted (and debated), economic factors and individual perceptions of these factors matter in leader evaluations and vote choice. Individuals do make a link between their perceptions of the economy and the actual economy, and while partisanship may muddle that link to some degree, it does not completely corrupt it. As already mentioned, using ANES cross-sectional data is likely to have exaggerated the impact of party identification. Future research using panel data would allow us to get a more precise estimate of the party–economy coefficient ratio. In addition, we could extend our model to explore temporal and individual-level heterogeneity linking economic perceptions and voting behavior along the lines of work undertaken by Park (2019).
Supplemental Material
sj-do-1-rap-10.1177_2053168020972811 – Supplemental material for Economic perceptions and voting behavior in US presidential elections
Supplemental material, sj-do-1-rap-10.1177_2053168020972811 for Economic perceptions and voting behavior in US presidential elections by Colin Lewis-Beck and Nicholas F. Martini in Research & Politics
Supplemental Material
sj-do-2-rap-10.1177_2053168020972811 – Supplemental material for Economic perceptions and voting behavior in US presidential elections
Supplemental material, sj-do-2-rap-10.1177_2053168020972811 for Economic perceptions and voting behavior in US presidential elections by Colin Lewis-Beck and Nicholas F. Martini in Research & Politics
Footnotes
Declaration of conflicting interests
The author(s) declared no potential conflicts of interest with respect to the research, authorship, and/or publication of this article.
Funding
The author(s) received no financial support for the research, authorship, and/or publication of this article.
Supplemental materials
The supplemental files are available at http://journals.sagepub.com/doi/suppl/10.1177/2053168020972811. economic measures, party identificaThe replication files are available at https://dataverse.harvard.edu/dataset.xhtml?persistentId=doi%3A10.7910%2FDVN%2FKQONWV&version=DRAFT
Notes
References
Supplementary Material
Please find the following supplemental material available below.
For Open Access articles published under a Creative Commons License, all supplemental material carries the same license as the article it is associated with.
For non-Open Access articles published, all supplemental material carries a non-exclusive license, and permission requests for re-use of supplemental material or any part of supplemental material shall be sent directly to the copyright owner as specified in the copyright notice associated with the article.