
Abstract
This article presents a new, monthly updated dataset on organized violence—the Uppsala Conflict Data Program Candidate Events Dataset. It contains recent observations of candidate events, a majority of which are eventually included in the Uppsala Conflict Data Program Georeferenced Event Dataset as part of its annual update after a careful vetting process. We describe the definitions, sources and procedures employed to code the candidate events, and a set of issues that emerge when coding data on organized violence in near-real time. Together, the Uppsala Conflict Data Program Candidate and Georeferenced Event Datasets minimize an inherent trade-off between update speed and quality control. Having monthly updated conflict data is advantageous for users needing near-real time monitoring of violent situations and aiming to anticipate future developments. To demonstrate this, we show that including them in a conflict forecasting system yields distinct improvements in terms of predictive performance: Average precision increases by 20–40% relative to using the Uppsala Conflict Data Program Georeferenced Event Dataset only. We also show that to ensure quality and consistency, revisiting the initial coding making use of sources that become available later is absolutely necessary.
Outline and motivation
This article presents a new dataset based on Uppsala Conflict Data Program Georeferenced Event Dataset (UCDP GED), but published at a monthly release cycle. The UCDP Candidate Events Dataset (UCDP Candidate) makes available monthly releases of candidate events data with not more than a month’s lag for all of Africa. 1 The UCDP GED is a leading data source in conflict research. Annually updated, geocoded, and based on careful scrutiny of multiple sources by human analysts, this dataset on organized violence delivers an unrivalled combination of detail and consistency. One disadvantage of the UCDP GED, however, is that it is only available as annual updates, up to 18 months after the recorded events occur. This is due to the time-intensive necessity to consult multiple sources to ensure that events meet the rigorous criteria of its definitions.
Policymakers need accurate, up-to-date data on on-the-ground situations in order to design and implement policies. Frequently released data are needed for policy design—to determine where to implement programs without the risk that they are undermined by armed violence, and for policy implementation—to monitor risks to program staff and participants. UCDP Candidate allows organizations to monitor monthly the spread of violence in order to assess the risk that it moves into areas of operations. The data are also useful for policymakers who need to understand patterns of ongoing violence as part of a broader mandate. For example, organizations interested in civilian protection and human rights need reliable global violence data. Many organizations currently generate policy on the basis of available news and other reports, but do so in an ad hoc manner.
By providing recent data, UCDP Candidate offers a systematic, reliable solution to parsing and understanding the vast amount of conflict information available in the public sphere. It also allows the general public, journalists, and educators to better contextualize ongoing events and trends in organized violence. The close relationship between the two datasets means the monthly updates can be linked explicitly to the vast body of research using UCDP GED. Likewise, the academic field of conflict research benefits; scholars studying the dynamics of ongoing conflicts can leverage much more up-do-date analysis when using their research to inform policy debates.
The two datasets fulfil complementary functions. The annual quality control check ensures that the data are as accurate as possible. This focus on high quality is important for researchers and policymakers requiring high levels of precision for analysis, and who are not working in real-time environments. The UCDP Candidate sacrifices this additional quality control check to provide timely, up-to-date data that are useful for those working on early warning and prediction as well as policymakers needing timely indications of unrest to facilitate program implementation. These data still must pass UCDP’s initial quality check, and thus are of higher quality than many non-UCDP alternatives. In this article we demonstrate empirically the utility of the two datasets for each objective. To demonstrate the usefulness of monthly updates, we show in the following that including UCDP Candidate data in a conflict forecasting system significantly improves predictive performance relative to using the UCDP GED only. To show why the second quality check is vital to the improved accuracy of the UCDP GED, we also present an analysis of how the data change during the annual cleanup at the end-of-the-year scrutiny, underscoring its absolute necessity in retaining high data quality. This two-stage process optimizes the trade-off between timeliness and quality.
The UCDP Candidate Events Dataset
The UCDP Candidate includes the three types of organized violence covered by the UCDP: state-based armed conflict (Gleditsch et al., 2002), one-sided violence (Eck and Hultman, 2007), and non-state conflict (Sundberg et al., 2012). As in the UCDP GED, the unit of analysis is the ‘event’. An event is defined as: [the] incidence of the use of armed force by an organized actor against another organized actor, or against civilians, resulting in at least 1 direct death in either the best, low or high estimate categories at a specific location and for a specific temporal duration (Sundberg and Melander, 2013: 524).
The combination of UCDP GED and UCDP Candidate form a complementary pair with separate update schedules and different geographic coverages. UCDP GED is fully consistent with UCDP’s traditional annual output, and has complete global coverage. At the time of writing, the final data cover the 1989–2018 period. These data are updated along with the annual UCDP update.
UCDP Candidate is currently restricted to Africa and updated monthly. As of late March 2020, data through February 2020 are available. The candidate data are preliminary in the sense described in the next section, and are replaced with corrected and completed data at every annual release of the UCDP GED. Hence, the candidate component only covers the most recent 4 to 18 months. Figure 1 shows the events recorded for 2018–2020. The upper-left panel shows all events for all years, the other panels the events for 2018, 2019, and January 2020.

Spatial distribution of the UCDP Candidate Dataset. First panel includes the entire extent of the dataset (January 2018 – January 2020); second panel includes data for 2018; third panel data for 2019; final panel includes data for January 2020. The size of each circle is proportional to the recorded number of fatalities while the color indicates the type of violence.
UCDP Candidate strengthens the suite of UCDP datasets as an alternative and complement to Armed Conflict Location and Event Data (ACLED) project (Raleigh et al., 2010) and other real-time data collection efforts. The UCDP aims to extend monthly coding for the UCDP Candidate to the Middle East in 2020, and to gradually expand to global coverage.
Evaluating the benefits of timeliness through a forecasting application
UCDP Candidate has been developed to increase the UCDP data family’s usefulness for those who depend on the real-time monitoring of violent events. A formalized approach to evaluate and quantify the benefits of the new data is to use them in a forecasting application. We base this on the ViEWS forecasting model (Hegre et al., 2019), aggregating UCDP Candidate to the grid structure in PRIO-GRID version 2.0 (Tollefsen et al., 2012) as the dependent variable. 2 We estimate a forecasting model with and without the contribution of UCDP Candidate. We then use this model to forecast armed conflict occurrence into the future, and compare the quality of the predictions using standard measures.
To evaluate forecasts against known events measured with high accuracy we use the final UCDP GED as data for actual conflict observations, not the candidate events. We set the forecasting (test/evaluation) window to October–December 2018, the last months for which we have definitive actuals (UCDP GED 19.1; Pettersson et al., 2019). We set up the exercise as if we were producing forecasts in one of the months September–November 2018, exposing the models only to data available at that point in time. We compare performance for four scenarios for data availability. In the baseline no-candidate scenario (NCD) we train and predict using only GED 18.1 (data until December 2017). For the setup making use of UCDP Candidate, we test three scenarios: real-time candidate-data scenario (CD-1), where UCDP Candidate data are available in ‘real time’ at the final date of the month so that one can predict one month ahead; 3 3-month candidate-data scenario (CD-3), where UCDP Candidate data are available with a two-month delay so we have to predict three months into the future); 4 6-month candidate-data scenario (CD-6), where UCDP Candidate data are only available 6 months before the forecasting horizon.
Methodologically, we use a relatively simple setup. We train a single model for each of the scenarios previously mentioned, using the ViEWS ‘one-step ahead’ procedure (Hegre et al., 2019) where models are constructed by taking predictors from a number of months into the past of the outcome and training them against current outcomes (we refer to this process as shifting). This allows using current predictors to predict future months. For each of the scenarios we shift predictors as many months as required by the data available in each scenario (1 month for CD-1, 3 months for CD-3, 6 months for CD-6, and 12 months for NCD). We employ a random forest classifier, using 500 trees, and predict the pseudo-probability of any armed conflict (defined as at least 1 battle related death) in the targeted cell-month.
Since we want to investigate the extent to which access to UCDP Candidate data improves predictive performance, our model primarily focuses on conflict history variables, and includes only a small number of structural predictors. We include a complete 12-month set of conflict history variables (state-based, non-state and one-sided), 5 i.e. for each cell we include a count of events as well as an estimate of fatality estimates for each of the 1 to 12 months in the past for the cell itself, for the immediate neighbors of the cell and for the immediate neighbors of the neighbors. 6 We also include cumulative fatality counts and event counts for the previously mentioned variables. For structural variables, we include a small selection of the best predictors from other ViEWS themes—terrain usage, distance to capital, to oil and diamond deposits, local gross domestic product, local population and travel time to the nearest city (Hegre et al. 2019).
Figure 2 shows the receiver operator characteristic (ROC) curve and the precision recall (PR) curve. Table 1 shows a set of common measures of predictive performance across the four scenarios: AUROC—the area under ROC curve; AUPR—the area under the PR curve, and the Brier score. 7 All metrics suggest substantial improvement from the NCD to all CD scenarios. In terms of AUROC, the three CD scenarios perform much better than the NCD scenario (AUROC of 0.970 vs. 0.918). AUPR of the three CD scenarios exceed 0.33 as compared to 0.278. Inclusion of 6-month-old candidate data improves prediction in the PR domain by 20%, the more realistic scenario with 3-month-old candidate data improves prediction by nearly 32%, whereas inclusion of fully real-time data would improve prediction by almost 39%. These differences in metrics are not due to chance—the columns labeled p are using bootstrapped samples to show that the probability that the three CD scenarios perform better than the NCD scenario is approaching 1 (see Online Appendix A-4 for details on how we estimate uncertainty).

Performance ROC and PR) plots for Random Forest models including the three scenarios with UCDP Candidate data (CD1, CD3, CD6) in red, and without (NCD, in blue).
Performance of the three Candidate Events scenarios relative to the No Candidate Data scenario.
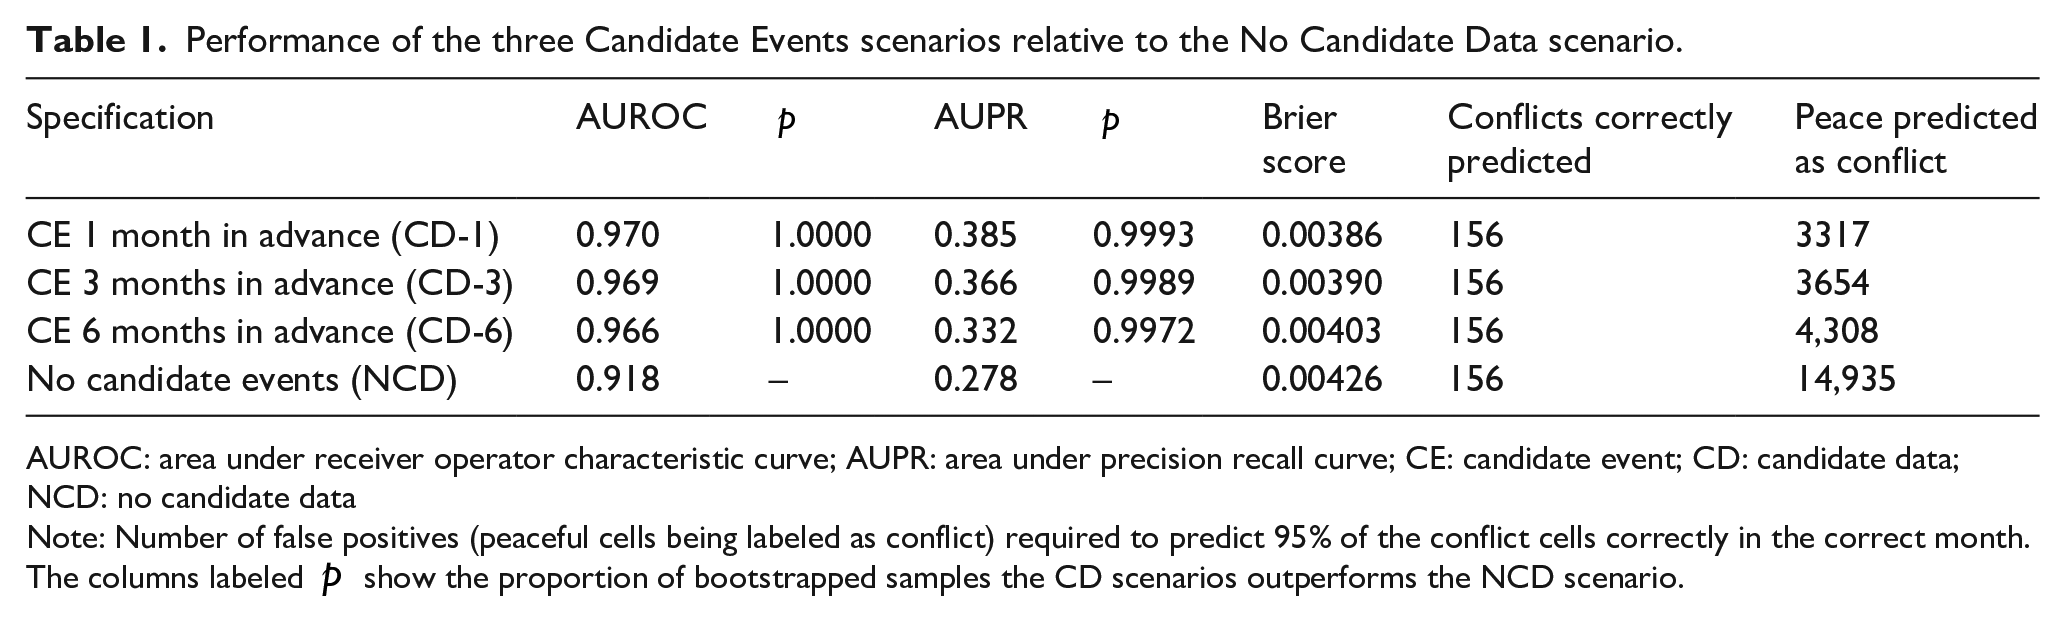
AUROC: area under receiver operator characteristic curve; AUPR: area under precision recall curve; CE: candidate event; CD: candidate data; NCD: no candidate data
Note: Number of false positives (peaceful cells being labeled as conflict) required to predict 95% of the conflict cells correctly in the correct month. The columns labeled
To illustrate what these metrics mean in substantive terms, it is instructive to focus on a specified threshold for recall (Table 1). Assume we require that the model achieves 95% recall—that the model is able to correctly identify 156 out of all 163 true conflicts in our evaluation period. In CD-1, we would have to accept 3317 false alarms to achieve this—3317 peaceful cells have to be labeled as being in conflict. In CD-3 and CD-6, just a slightly lower number of false positives is required (3654 and 4308, respectively). In the NCD scenario, we need to label almost 3.5 times as many false positives, 14,935. Having access to UCDP Candidate allows sharpening prediction by over 3.5 times at this level of recall.
Figure 3 shows the differences between predictions and actuals in space in the models with UCDP Candidate data and the model without UCDP Candidate data. Overprediction is in blue (reality was more peaceful than predicted), underprediction in red (reality was more conflictual than predicted), perfect prediction is gray. Intensity shows the difference between actuals and predictions—the more intense the color, the worse the prediction. Both actuals and probabilities are accumulations over the three months, with cumulative probabilities computed using the compound probability formula on the negative case:

Difference between predictions and actuals. Both actuals and predictions are cumulative and cover October to December 2018. Blue represents over-predicting conflict; red represents under-predicting conflict. Under-predicting was considered 10 times more problematic as over-predicting, using the same cost rules as Hegre et al. (2019). In order to reduce the penalty for near misses (predicting in adjacent cells), a 3x3 convolution (taking the mean conflict of a 3x3 window around each cell) was applied to the actuals.
It is evident that models including UCDP Candidate data fare much better than models not including such data; the model using only UCDP GED 18.1 (the NCD scenario) almost completely fails to predict the Cameroon conflict and the resurgence of conflict in Mozambique, and substantially under-predicts the conflicts in Western Sahel (Mali, Mauritania). The main reason for this is the availability of up-to-date data. Conflict in the immediate past is the best predictor for conflict in the future (Hegre et al., 2019). The 12-month delay in data availability in the NCD scenario is a clear handicap versus the 1-, 3-, and even 6-month delays allowed by introducing UCDP Candidates. 9 This improvement in predictive performance is also a useful quantitative indicator of how important up-to-date data are in less formal decision-making processes.
Differences between UCDP Candidate and UCDP GED
The aim of the UCDP Candidate is mainly to provide the research community and policymakers with timely data. The UCDP GED in contrast aims to provide accurate annual data as a basis for long term trends and robust statistical analysis. Although collected with slightly different aims, the UCDP Candidate has the same structure as the annually updated UCDP GED.
While the coding procedure aims at making the monthly candidate data as close in content to the final UCDP GED as possible, there are some differences. The first relates to timeliness: at the candidate stage, the UCDP retrieves relevant articles from sources that are available within a couple of weeks after the event (for methodology and sources, see Högbladh, 2019). UCDP Candidate also departs from UCDP GED by including events that do not, ‘in their aggregated form, constitute the UCDP’s country-year datasets’ (Sundberg and Melander, 2013: 525). It includes events carried out within conflict dyads that do not satisfy the 25 battle-related deaths in a calendar year criterion used as a threshold for inclusion by the UCDP. Since the UCDP identifies the stated incompatibilities by new groups on an annual basis, this criterion is also relaxed for the UCDP Candidate events. Moreover, the strict requirements regarding actor attribution are relaxed if coders find it likely events will be included in the final UCDP GED at the end of the year. The decision whether to include a report in the UCDP Candidate data is taken by the UCDP coder and project manager in charge of data collection.
A slight majority of the candidate events are immediately flagged as ‘clear’ events. These are highly likely to be included in the yearly UCDP GED provided the conflict eventually passes the 25 battle-related death threshold. The remainder are flagged for further investigation before being included in UCDP GED. All events where relaxed definitions and coding criteria have been employed are marked with a special ‘code status’ and subject to the thorough scrutiny required for inclusion in the annual UCDP GED update. This checking process can lead to any candidate event being retained, discarded, or revised. Figure 4 lists the check categories and illustrates their distribution.

A graphical comparison between the UCDP Candidate and UCDP GED, Africa, 2018. Each square represents four UCDP events present either in UCDP Candidate, in UCDP GED, or in both; each larger block represents 100 events. More details are provided in Online Appendix Table A-1.
Although monthly coding is enormously valuable for near-real-time monitoring of conflicts, a high-quality dataset can only be finalized after additional scrutiny. To document the extent of overlap, Figure 4 summarizes a side-by-side comparison of UCDP Candidate and UCDP GED 19.1 (Pettersson et al. 2019) spanning all of 2018 in Africa. 10 More than half of the candidate events were changed in some manner before reaching the final status. There is a real trade-off between accuracy and timeliness. About a quarter of the UCDP Candidate events were subsequently deleted. Most of these were flagged as ‘check dyad’ as the coder was uncertain about the actors involved. Before being transferred to UCDP GED in the annual update, 1040 events—50 % of the retained ones—were revised. Most were flagged as check dyad or deaths. Finally, 679 events were added after consulting additional sources. We are not able to discern any clear patterns to these changes, suggesting that the UCDP Candidate is an unbiased anticipation of the final UCDP GED. It is clear that the quality gain from producing a final UCDP GED data is considerable relative to what can be coded within a couple of weeks after the events.
Conclusions
In this article, we have introduced a dataset designed to complement the UCDP GED (Sundberg and Melander, 2013; Pettersson et al., 2019) by allowing a more rapid update schedule. The UCDP Candidate dataset allows scholars, journalists, policymakers, and other observers of current conflict situations access to data produced according to the same general guidelines in near-real time. We have demonstrated the usefulness of these timely data by showing how much an early-warning system improves with acccess to them. Average precision then increases by 20–40%. Or equivalently, for a given number of correctly predicted conflicts, the number of false positives drops by 70–80% with the new data.
UCDP Candidate also promises other advances in conflict research. With them, forecasting systems can be evaluated for true predictive performance a few months after the forecasts are published, speeding up model development considerably. Our analysis of how candidate events recorded within a couple of weeks of the violence differ from the final version of events after the data have gone through a second quality control check, is also instructive. We have shown that the careful scrutiny in the UCDP annual update leads to quite substantial changes from the information immediately available. It is clear that the annual screening of data routinely carried out in UCDP GED is essential to produce an overview of conflict situations that is maximally consistent, accurate, and reliable. Taken together, the UCDP Candidate and UCDP GED provide a comprehensive package of data, each tailored to maximize a different objective. With the release of the new UCDP Candidate, users prioritizing timeliness now have a high-quality alternative for real time conflict monitoring.
Footnotes
Acknowledgements
The authors would like to thank the editor, the anonymous reviewers, as well as Magnus Öberg, Frederick Hoyles, Naima Mouhleb and participants in the research seminar at the Department of Peace and Conflict Research, Uppsala University, for comments and assistance. For more information on the projects see views.pcr.uu.se and ucdp.uu.se.
Declaration of conflicting interests
The author(s) declared no potential conflicts of interest with respect to the research, authorship, and/or publication of this article.
Funding
The author(s) disclosed receipt of the following financial support for the research, authorship, and/or publication of this article: The research was funded by the European Research Council, project H2020-ERC-2015-AdG 694640 (ViEWS) and Uppsala University. The simulations were performed on resources provided by the Swedish National Infrastructure for Computing (SNIC) at Uppsala Multidisciplinary Center for Advanced Computational Science (UPPMAX).
Notes
Carnegie Corporation of New York Grant
The open access article processing charge (APC) for this article was waived due to a grant awarded to Research & Politics from Carnegie Corporation of New York under its ‘Bridging the Gap’ initiative.