
Abstract
The standing committees of the European Parliament perform crucial policy-making functions and, accordingly, the question of how they are composed assumes great relevance. Unlike previous studies, which primarily looked at committee assignments from the perspective of individual MEPs, we assess the representativeness of entire committees by comparing their preference distributions with those we find in the plenary on the left/right and pro/anti EU dimension. For our analysis, we combine new data on committee memberships in the ninth European Parliament with data on policy preferences of national parties from the Chapel Hill Expert Survey. In order to assess committee representativeness, we calculate the extent to which the preference distributions of committees and the plenary overlap. We show that committee representativeness is a function of committee popularity and power. Committee popularity provides party groups with a larger pool of applicants to choose from and since popular committees are often also quite large, the formation of representative committees is facilitated. Moreover, the party groups of the European Parliament have stronger incentives to form balanced committee contingents for powerful committees, resulting in higher committee representativeness. However, this latter finding is qualified by two outliers and we only find the hypothesized relationship to hold on the pro/anti EU dimension.
Keywords
Introduction
The committees of the European Parliament (EP) perform crucial functions for the collective benefit of the institution (Yordanova, 2013). By facilitating specialization and coordination, they contribute significantly to the efficiency of the EP’s legislative business. Moreover, committees select teams of legislators who ultimately represent the EP in inter-institutional negotiations (Obholzer et al., 2019) and often strongly pre-determine the policy position the EP will later adopt in plenary. All of these important tasks imply that the question of how the committees of the EP are composed assumes great relevance. While we know that committee memberships are distributed proportionally among the party groups of the EP (see, e.g., McElroy, 2006), the fact that these party groups are composed of different national parties with sometimes rather heterogeneous preferences implies the potential for biased committee compositions.
In this contribution, we assess the extent to which such biases exist in the committee system of the 9th EP, combining new data on committee memberships with existing data on the policy positions of national parties collected in the Chapel Hill Expert Survey (CHES) (Polk et al., 2017). Focusing on the general left/right and the pro/anti EU dimension (Hix et al., 2007), we propose a new measure for committee representativeness which is based on the overlap of the preference distributions we find at the committee and the plenary level. Based on this conceptual approach, we hypothesize that the representativeness of a committee should be influenced by the committee’s popularity and power. If membership in a committee appears attractive for many Members of the EP (MEPs) and their respective national party delegations, the party group leadership is better able to select a committee contingent that closely reflects the party group’s preferences than if the committee is less attractive and fewer applicants compete for the committee assignments. Moreover, more popular committees are usually also larger, further facilitating committee representativeness. In addition, we hypothesize that varying degrees of committee power should provide varying incentives to ensure representativeness. By making sure that their committee contingents in powerful committees are representative of the party group median, party groups try to avoid agency drift and, by implication, increase the overall representativeness of the committee. Our empirical analysis suggests, however, that the effect of committee popularity is somewhat clearer than the effect of committee power and that the relationship is robust for the pro/anti EU dimension only. These findings imply that some committees tend to reflect the preferences of the plenary regarding European integration more closely than others. These unequal patterns of representativeness could have ramifications for how different committees operate when dealing with legislative proposals by the European Commission and for the time they require to arrive at their decisions.
Committee assignments in the European Parliament
EP research often focuses on the committee level, as parliamentary committees play a central role for the institution’s legislative organization and, by implication, for the way the institution behaves politically. Drawing from congressional theories of legislative organization (e.g. Cox and McCubbins, 2007; Krehbiel, 1991; Shepsle and Weingast, 1987), existing research has identified several factors that affect the chances of individual MEPs to end up on certain committees. McElroy (2006) showed that seat distributions are very similar at the committee and the plenary level, both regarding the national backgrounds of the MEPs and their party group membership. In her study, McElroy (2006) also tested committee representativeness using the MEPs’ voting behaviour in plenary as a proxy for their policy preferences and concluded that committees are generally highly representative of the plenary. However, the study also showed that MEPs who had previously served on a committee and have relevant professional expertise or interest group ties are more likely to serve on certain committees. Likewise, Yordanova (2009) has shown that professional expertise, relevant ties to interest groups and committee incumbency all influence the committee assignments of MEPs. Based on a comparative analysis of voting behaviour, Whitaker (2005) concluded that national party delegations strive to uphold higher levels of representativeness on committees that wield legislative power. Whitaker (2019) also recently demonstrated that MEPs are quite often successful in securing their preferred committee assignments.
All of these studies mostly focus on committee assignments from the perspective of the individual MEP. However, we know only very little about the extent to which the aggregation of individual assignment decisions also impacts on the preference distribution of the entire committee. McElroy (2006) compared the means and medians of EP committees with those of the plenary and found no meaningful deviations. However, as we will demonstrate, identical means and medians can result from vastly different preference distributions. We therefore consider it more appropriate to conceptualize committee representativeness as the extent to which the preference distributions of the plenary and the committee overlap (see ‘Dependent variable’ section, below).
Theorizing the interplay of committee popularity, power and representativeness
In a recent contribution, Whitaker (2019) highlighted that the committees of the EP vary substantially in terms of popularity. While membership of some committees such as Foreign Affairs (AFET) and Economic and Monetary Affairs (ECON) is considered highly prestigious, membership of other committees such as Petitions (PETI) or Development (DEVE) does not appear to be very attractive for most MEPs. This implies that the competition for membership varies across committees. And as Whitaker (2019: 173) has shown, MEPs tend to be more successful in securing their desired committee memberships in less popular committees. This is arguably due to the fact that MEPs face less competition for membership in these committees.
In many instances, committee popularity results from committee power. MEPs tend to favour membership in committees that have stronger legislative impact (Whitaker, 2019). A notable exception to this pattern is the AFET committee, whose legislative power is negligible, but membership is nevertheless broadly considered highly prestigious. Accordingly, committee popularity and committee power are closely linked and we claim that both lead to higher committee representativeness through different routes (Figure 1).
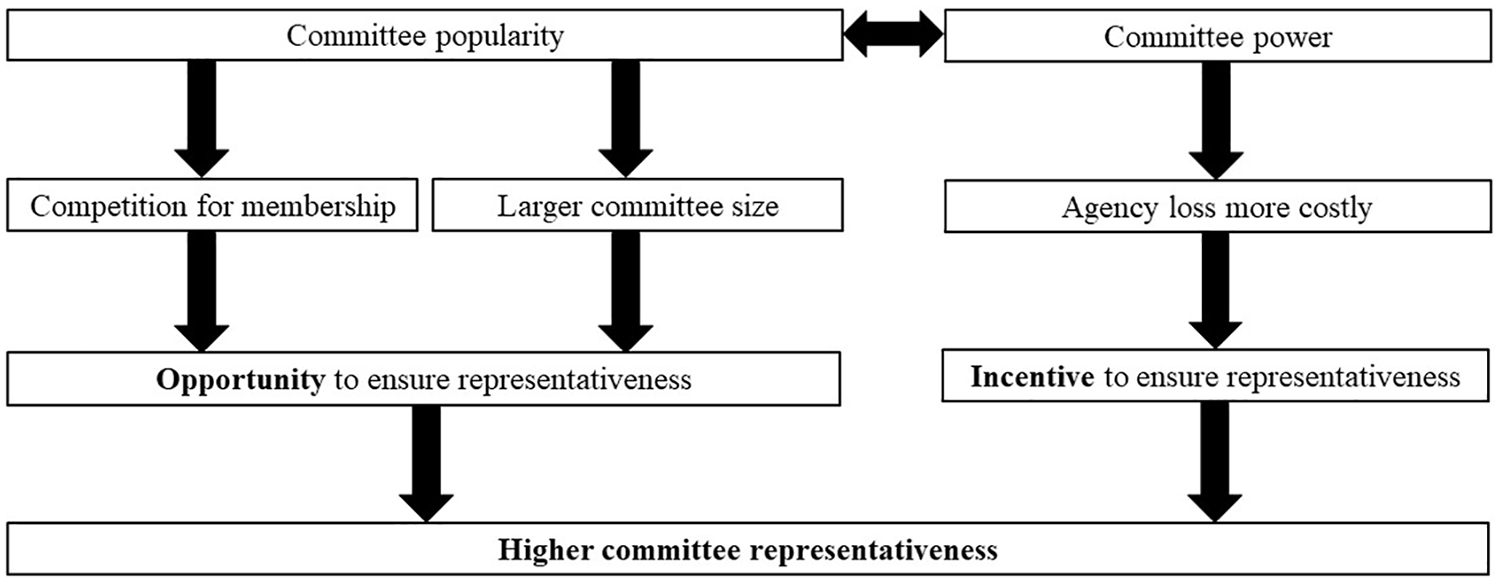
A model for committee representativeness in the EP.
First, committee popularity increases competition for membership among MEPs, which creates the opportunity for the party group leadership to select the group’s committee contingent from a larger pool of applicants. Yet, committee popularity also varies across national party delegations (NPDs), which attach varying degrees of salience to different committees (Whitaker, 2011). If many NPDs within a party group consider membership in a committee important, the party group leadership will find it necessary to accommodate as many of these wishes as possible. In such situations of high demand for committee membership, forming a biased committee contingent would create severe conflict within the party group. Accordingly, we should expect party groups to form more balanced committee delegations whenever demand for membership is high among both MEPs and their respective NPDs.
This ability of party groups to create balanced contingents is further enhanced by the fact that popular committees are also larger (Whitaker, 2019: 169). Accordingly, committee popularity urges the EP to increase committee size, which in turn enables party groups to form more representative committee delegations. Committee power, in turn, primarily affects the potential costs associated with agency loss for the party groups. Therefore, in committees with substantial legislative impact, party groups have a stronger incentive to put together committee contingents that reflect the party group line than in committees with lower legislative impact. We argue that committee representativeness jointly results from the opportunity structures created by the committee’s popularity and the incentive structures created by the committee’s power.
Our main theoretical expectation thus reads as follows:
Research hypothesis: More popular and more powerful committees are more representative of the plenary on key dimensions of political conflict than less popular and less powerful committees.
Data and methods
Our analysis relies on a dataset that combines full committee memberships in the 9th EP with data on policy positions of the MEPs’ national political parties from the CHES (Polk et al., 2017). We test our main hypothesis for the general left/right dimension, ranging from 0 (extreme left) to 10 (extreme right) and the pro/anti EU dimension, ranging from 1 (strongly opposed to European integration) to 7 (strongly in favour).
Dependent variable
With regard to these two dimensions, we measure committee representativeness by calculating the overlap between the committees’ density distributions and the plenary’s density distribution. Since the area under the density function always adds up to 1, the size of the intersected area of two density functions can be interpreted meaningfully. For the calculation, we used the overlapping package in R (Pastore, 2018). To illustrate the benefits of our approach, we randomly generated two distributions with the same mean, median and standard deviation (Figure 2). The first distribution was forced into a bimodal shape, while the second distribution is normally distributed.

Simulation of two distributions with the same mean, median and standard deviation.
Although we can observe vastly different shapes, the distributions would be considered perfectly representative of each other if we only relied on measures of central tendency. The overlap of the distributions better captures the relevant differences. For the given distributions, the overlap would amount to 0.6 which intuitively aligns with the visual representation of the distributions as being not very representative of one another. While committee and plenary may eventually arrive at the same policy decision in this example, the process leading up to the decision will likely differ depending on whether decreasing overlap comes along with higher or lower polarization. If committee polarization is high (i.e. if the committee is the dark grey distribution in Figure 2), we should expect more intense political conflict and more prolonged searches for compromise solutions. If committee polarization is low (i.e. if the committee is the light grey distribution in Figure 2), policy-making might become more consensual and thus more efficient. While we consider these hypotheses important, we only focus on the analysis of preference overlap in this article, leaving the analysis of accompanying polarization patterns to future research.
In order to calculate the overlap between each committee and the plenary, we created a dataset containing the full committee memberships of each MEP in the 9th EP. Each MEP was assigned the position of their respective national party on the left/right and pro/anti EU dimension respectively based on CHES data (Polk et al., 2017). We consider national party positions more useful for the purpose of our analysis than NOMINATE scores. First, party positions are not derived from observed preferences and, second, we can also get them for the many MEPs that have no established voting record. Furthermore, existing research shows that MEPs often follow their national party in EP votes (Hix, 2002), which suggests that national party positions can be considered proxies for MEP policy positions. If national party positions were not available for a given MEP, we assigned these MEPs the mean position of their European party group. Since this coding decision could theoretically bias our findings towards higher representativeness, we also ran our analysis without the missing MEPs (see the appendix in the supplementary material online). Based on the distributions of national party positions in the committees and the plenary, we calculated the overlap for each dimension giving us two main dependent variables: the overlap between committee and plenary on the left/right dimension and on the pro/anti EU dimension (in percentage points). The average overlap of the committees is 79.15% on the pro/anti EU dimension (standard deviation: 3.91%) and 88.10% on the left/right dimension (standard deviation: 2.75%). Descriptive statistics for all committees can be found in the appendix in the supplementary material online.
Independent variables
In order to measure committee power, we adopted the categorization of Yordanova (2009), who distinguished committees as more or less powerful based on their respective influence on co-decision legislation and the EU budget. For the popularity variable, we relied on the survey of Whitaker (2019), in which he asked MEPs to name their most preferred committee. We use both the percentage of mentions per committee and the resulting ordinal ranking of committees as indicators of committee popularity.
Methodological approach
In our empirical analysis, we rely on two complementary strategies. First, we inspect deviations from representativeness in a descriptive manner. Second, we estimate the relationships between committee popularity, power and representativeness with ordinary least squares (OLS) regressions. Furthermore, we assess the influence of individual committees on the estimated coefficients, demonstrating that our main findings are not heavily influenced by outliers. In our analysis, we only consider full members of the committee. While substitute members may participate in committee meetings and enjoy speaking rights, they may only take part in committee votes when the full member is absent.
Results
Figure 3 illustrates our measurement approach. It compares the distribution of preferences on the pro/anti EU dimension in two committees (AFET and Fisheries (PECH)) with the one we find at the plenary level. Beyond the clear pro-EU bias of the EP plenary, we find that this bias is not reflected in all committees to the same extent. The overlap in the AFET committee amounts to roughly 86%, whereas the overlap in PECH is only 70%, which implies that MEPs from less Europhile national parties are overrepresented in PECH. While both figures appear high, it should be kept in mind that there is a certain amount of ‘unavoidable’ overlap that results from the strict observance of seat proportionality at the party group level.

Representativeness of AFET and PECH on the pro/anti EU dimension.
Figure 4 shows how representativeness varies across EP committees and illustrates the extent to which more powerful and less powerful committees differ from each other.

Committee power and representativeness.
The scatterplot reveals that the 10 committees classified as less powerful occupy about the same range as the more powerful committees on the left/right dimension. On the pro/anti EU dimension, in contrast, we find that powerful committees tend to be more representative than less powerful committees, with the notable exceptions of Legal Affairs (JURI) and AFET. While JURI’s overlap with the plenary is much lower than expected, the representativeness of the AFET committee is very high given its limited legislative powers. However, these two outliers aside, the data suggest that powerful committees tend to be more representative of the plenary as far as their aggregated preferences on the pro/anti EU dimension are concerned than less powerful committees.
In Figure 5, we plot the representativeness of each committee against its popularity. The figure indicates that committee popularity and committee representativeness are associated and again, the relationship appears most clearly for the pro/anti EU dimension. The plot suggests that AFET seems to draw its representativeness from the fact that membership in the committee is in high demand, allowing (and forcing) party groups to put together representative committee contingents. Among the least representative committees on the pro/anti EU dimension, we find four committees which were also among the least popular in Whitaker’s survey (Whitaker, 2019): PECH, JURI, Petitions (PETI) and Budgetary Control (CONT). It is remarkable that three of these committees belong to the group of ‘neutralized committees’ (PECH, PETI and CONT), in which membership does not preclude membership in other committees. The neutralization of membership in these committees is a result of the comparably little power these committees wield. While their limited power can thus potentially explain their relatively low representativeness, our data suggest that the JURI membership deviates quite strongly from the plenary on the pro/anti EU dimension despite the committee’s relatively strong role under the ordinary legislative procedure. We suspect that the rather low popularity of the JURI committee among MEPs stems from the highly technical nature of the policy proposals the committee typically deals with. Moreover, JURI and AFET serve as prime examples of the fact that committee popularity is related to committee size. While AFET has 71 members, JURI only has 25. Accordingly, even though JURI is more powerful than AFET in legislative terms, its much smaller size entails a much lower degree of representativeness. Overall, the correlation between our measure for committee popularity and committee size is r = .91, clearly suggesting that demand and supply of committee memberships are strongly related. Accordingly, committee size is a consequence of committee popularity (Whitaker, 2019), and hence not a proper independent variable on its own.

Committee popularity and representativeness.
Table 1 displays coefficients of an OLS regression testing our hypothesis. Since we only have 20 cases, we only estimate one parameter per regression and also test the extent to which our coefficients are sensitive to the exclusion of individual committees. In accordance with our descriptive evidence, we find that neither committee popularity nor power helps us to explain deviations in committee representativeness on the left/right dimension (Models I–III). However, committee popularity increases committee representativeness significantly on the pro/anti EU dimension (Model IV). Every percentage point increase in popularity is associated with an increase in overlap on the pro/anti EU dimension of .54 percentage points. The effect also holds if we use an ordinal ranking of committee popularity resulting from Whitaker’s survey (Model V, note that higher values indicate lower popularity). Overall, we estimate the overlap on the pro/anti EU dimension to decrease by roughly 6 percentage points (roughly 1.5 standard deviations of the dependent variable) between the most popular and the least popular committee. While these effects do not appear large, the intercept indicates that there is a rather high baseline representativeness. Accordingly, we should interpret the coefficient against the background that committees can impossibly become completely unrepresentative in part due to the proportionality principle at the party group level. Finally, model VI does not show a significant relationship between committee power and representativeness on the pro/anti EU dimension. As explained above, this is mainly due to the two outlying cases of JURI and AFET. If we exclude only one of these two cases, the relationship turns significant. In order to test the stability of these findings, Figures 6 and 7 display the estimated coefficients for different subsamples, employing the logic of a jackknife ‘leave-one-out’ procedure. Figure 6 shows that the significance of committee popularity is not heavily affected by individual committees. Only the exclusion of AFET impacts on the significance of the association (p = .067). Figure 7 demonstrates that the exclusion of JURI and AFET impacts on the power estimate. Excluding AFET results in p = .054, excluding JURI results in p = .045.
Ordinary least squares regression.

Note: *p<0.1; ** p<0.05; *** p<0.01; dependent variable: overlap between preference distributions of committees and the plenary on the left/right dimension and the pro/anti EU dimension (in percent).

Committee popularity and representativeness (Model IV, pro/anti EU).

Committee power and representativeness (Model VI, pro/anti EU).
Conclusion
In this article, we investigated committee representativeness in the 9th EP. We proposed a novel approach to assess representativeness based on the overlap of the preference density functions and showed that committee representativeness on the pro/anti EU dimension is related to committee popularity and power. When the pool of applicants increases and committees consequently increase in size, party groups are enabled to form more representative committee contingents. Likewise, party groups have stronger incentives to form representative committee contingents if committees are very powerful. The only exceptions regarding this latter relationship are the committees AFET and JURI. We did not find any of these patterns on the left/right dimension, however. There might be several reasons for this: first, as Hix et al. (2018) demonstrated, the left/right dimension has reduced in importance over the past years and political conflict in the EP is increasingly structured around preferences on European integration. Second, we suspect that the left/right dimension might be too general to capture the dimensionality of policy conflict at the EP committee level, which is why we encourage future research to investigate patterns of (un)representativeness with more policy-specific preference distributions. Finally, previous research has shown that measuring the left/right dimension with national party positions is challenging in a pan-European context, as the meaning of the dimension likely varies between Eastern and Western Europe (Bressanelli, 2012).
The article demonstrated that while the proportionality rule operating at the party group level ensures high degrees of representativeness at the committee level of the EP, the fact that the EP’s party groups consist of national parties with different ideological profiles implies that deviations from perfect representativeness necessarily occur. Our analysis suggests that the extent of these deviations varies across policy areas, depending on the popularity of these policy areas among legislators and the legislative power of the committees that deal with them. This could point to varying potential for agency loss for the plenary across the EP’s committee system.
Our analysis has some important limitations. First, the study is only based on a rather low number of cases. Given our low number of observations, however, the effects we find are quite robust. Second, future research will need to test the causal mechanisms at work more rigorously by taking a closer look at the selection procedure within the party groups. This relates both to varying degrees of centralization in the seat allocation process and the investigation of whether and how committee popularity varies at the party group level. Third, our analysis only considered two rather general conflict dimensions. However, it is well conceivable that more substantive policy dimensions also have a role to play when committees are formed, for example the environment dimension for ENVI. We consider this line of research a logical extension from our analysis. Finally, future research should look into the important question of whether decreasing representativeness typically comes along with increasing polarization.
Supplemental Material
Online_Appendix_v3 – Supplemental material for Are popular and powerful committees more representative? Evidence from the ninth European Parliament
Supplemental material, Online_Appendix_v3 for Are popular and powerful committees more representative? Evidence from the ninth European Parliament by Steffen Hurka and Constantin Kaplaner in Research & Politics
Footnotes
Acknowledgements
We would like to thank the anonymous reviewers and all participants at the #EP2019@UDE conference in Duisburg for their comments. Our special thanks go to the two associate editors Ariadna Ripoll Servent and Nils Ringe for their excellent work, as well as to Michael Kaeding and Stefan Haußner, who initiated and compiled this special issue for the 2019 European elections.
Declaration of conflicting interests
The author(s) declared no potential conflicts of interest with respect to the research, authorship, and/or publication of this article.
Funding
The author(s) received no financial support for the research, authorship, and/or publication of this article.
Supplementary materials
Carnegie Corporation of New York Grant
This publication was made possible (in part) by a grant from the Carnegie Corporation of New York. The statements made and views expressed are solely the responsibility of the author.
References
Supplementary Material
Please find the following supplemental material available below.
For Open Access articles published under a Creative Commons License, all supplemental material carries the same license as the article it is associated with.
For non-Open Access articles published, all supplemental material carries a non-exclusive license, and permission requests for re-use of supplemental material or any part of supplemental material shall be sent directly to the copyright owner as specified in the copyright notice associated with the article.