
Abstract
Many studies have found that European parties change their policy positions in response to changes in public opinion. This is both theoretically and normatively appealing, suggesting that European party politics operates in a way that is consistent with spatial models. Nonetheless, virtually all previous studies are based on a single, uni-dimensional measure of public opinion: left–right self-placement from the Eurobarometer surveys. This measure has a number of flaws, including the fact that political conflict in Europe now occurs across multiple issue dimensions beyond the classic divide on state involvement in the economy. We used new measures of Europeans’ ideological positions across four different issue dimensions and 26 countries from 1981–2016, together with data on parties’ policy positions from their manifestos, to re-evaluate findings on responsiveness. Across many different model specifications, samples and outcome measures, we found virtually no evidence that European political parties respond to public opinion on any issue dimension. Our findings suggest that scholars may require better measures of party positions, more nuanced theories of responsiveness (for example to sub-groups, or across longer time horizons), or may need to refocus their attention towards responsiveness via policy outcomes rather than parties’ policy commitments.
Introduction
The responsiveness of parties to public opinion is generally seen as a prerequisite for the functioning of modern liberal democracies. There are two ways that responsiveness can occur: indirectly, through electoral turnover, or directly, by parties adjusting their policies in line with changes in public opinion (Stimson et al., 1995). A growing literature on the strategic behaviour of political parties argues that parties do indeed follow this direct mechanism (Adams, 2012). Many studies have demonstrated that political parties react to shifts in public opinion (Adams et al., 2004), that they respond differently to different segments of the electorate (Adams and Ezrow, 2009; Homola, 2019), and that mainstream parties’ responses differ from those of niche parties (Adams et al., 2006; Bischof and Wagner, 2017). This literature on the dynamic adjustment of political parties has made an important contribution in linking formal spatial models to empirical evidence on the behaviour of real-world political parties.
In this article, we re-evaluate parties’ policy responsiveness, applying a novel measure of public opinion. Empirical analyses of this question so far have largely relied on measuring public opinion using left–right self-placement extracted from surveys to derive a cross-national measure of public opinion. However, as noted in this literature itself, this approach comes with a number of problems.
The first is a lack of data, because self-placement is measured from the Eurobarometer survey. Figure 1 in the Online Appendix shows how mean left–right placement has evolved in 25 European countries that have appeared in this paper since 1980. As non-EU countries are not covered by the Eurobarometer, many countries have data for less than half of the period, and two countries that feature in this paper – Norway and Switzerland – do not feature at all in the Eurobarometer data. This lack of coverage is one of the reasons why classic papers on policy responsiveness in Europe such as Adams et al. (2004, 2006) in fact cover only 8 of these 27 countries.
Second, it is uni-dimensional. Political conflict in Europe no longer occurs along one left–right dimension. In addition to traditional conflict over state involvement in the economy, there are now one or possibly two more dimensions that include questions of the basic organising principles of society such as gender equality or immigration (Caughey et al., 2019; Inglehart, 1990; Kriesi et al., 2006). In this sense, left–right self-identification can at best capture one dimension of dynamic representation. Since many people are ‘cross-pressured’ – economically conservative but socially liberal – and then often label themselves as centrist, despite holding very non-centrist opinions (Treier and Hillygus, 2009), left–right self-placement may fail to capture any dimension accurately.
Third, many respondents do not know what policies are associated with ‘left’ and ‘right’, meaning that the measure is strongly influenced by partisanship and identification with partisan groups (Klingemann, 1979; Knutsen, 1997; Medina, 2013). 1 Self-described centrists also often choose centrist responses because they simply do not understand what the survey question is asking them (Knutsen, 1998; Rodon, 2015). Because of this and the issue of ‘cross-pressure’, over-time variation in mean left–right self-placements is implausibly low (see Figure 1 in the Online Appendix). Many countries’ ideologies, on this measure, have remained virtually unchanged since the 1980s, despite widespread liberalisation of opinions on social issues such as gender equality and LGBT (lesbian, gay, bisexual, and transgender) rights.
Fourth, it is susceptible to differential item functioning. Across countries, citizens interpret the question as being about different issues (Thorisdottir et al., 2007; Bauer et al., 2017). Over time, the increasing multi-dimensionality of politics means that people interpret ‘left’ and ‘right’ differently now than they did in the past (De Vries et al., 2013; Knutsen, 1995). This makes over-time or cross-country comparisons difficult.
Despite these problems, scholars have understandably relied on left–right self-placement as the only available measure of citizens’ ideologies across time and space derived from surveys. Adams et al. (2019) note that with the exception of European integration, it has to date been impossible to test responsiveness across multiple dimensions. Happily, that is no longer the case. Instead of left–right self-placement, we use Caughey et al.’s (2019) measures of ideology. Based on a Bayesian dynamic group-level item response theory model including more than 2.7 million survey responses, they measured ideological positions for four policy dimensions (‘absolute’ economic ideology, ‘relative’ economic ideology – the desire for more or less government spending – social issues, and immigration issues) for 27 European countries from 1981–2016. The issue questions that make up the scales are easier to understand than left–right self-placement, and differential item functioning is less of an issue because the questions have a more universal meaning across time and countries. Their paper contains extensive validations of the measures, including formal tests of construct- and convergent validity, as well as demonstrating face validity. 2
We adopted a definition of responsiveness that is in line with classic empirical studies: that responsiveness can be said to have occurred when parties shift their positions in the same direction as voters’ ideological shifts. 3 We measured parties’ dimension-specific policy positions with data from the Comparative Manifesto Project (CMP/Manifesto Research on Political Representation project) (Volkens et al., 2018). Using these outcome measures together with the new scales for public opinion, we re-examined whether parties generally move their positions in line with public opinion, whether they respond more strongly to harmful opinion shifts (Adams et al., 2004) and whether mainstream parties are more responsive to shifts in public opinion than niche parties (Adams et al., 2006; Bischof and Wagner, 2017). In a series of analyses with varying specifications, we did not find any consistent evidence that parties respond to short-term shifts in public opinion, measured using manifestos. This included subsets for different regions (Western vs. Eastern Europe), different time periods and different parties as well as different outcome scales. These findings have important implications for the literature on party competition as they challenge what has become one of its crucial assumptions: that parties are responsive to public opinion.
Data and methodology
Our analysis includes all countries that have both ideological data and data on party positions from CMP: 26 in all, nearly trebling the number of countries compared with past studies. 4 We were also able to considerably expand the period covered, up to 2017. Most previous studies (with the exception of Bischof and Wagner, 2017) stop in the late 1990s or early 2000s. The contents of the four ideological scales that we used are shown in the third column of Table 1. As we demonstrate in the Online Appendix, our findings are robust to several other specifications of these scales. We measured parties’ ideological positions from the CMP separately for each dimension, using the logit scaling method of Lowe et al. (2011). We created scales that matched the issue content of the ideological scales as closely as possible. The coding categories used from the CMP are shown in the fourth and fifth columns of Table 1. We included all parties that received 1% or more of the vote on average for the elections that they contested in our dataset. We also followed previous studies in excluding parties that represent only a specific region (e.g. those from Catalunya), agrarian parties, and parties that campaign only on single issues, all of whom should not be expected to respond to overall national public opinion.
Ideological scales from Caughey et al. (2019) and corresponding party position measures used from the Comparative Manifesto Project (CMP).

Note: LGBT = lesbian, gay, bisexual, and transgender.
As is standard with CMP data, each of our four scales measured parties’ positions using the balance of right-wing and left-wing ‘quasi-sentences’ in a manifesto. The more positive the score, the more right-wing expressions there are relative to left-wing. The scores ranged from roughly −5 to 5, with standard deviations (SDs) between 1.63 and 2.04 and means close to or slightly below zero, except for relative economic issues where most parties express more pro-spending than anti-spending views. In the Online Appendix, we show that these scales produce sensible distributions by party type. To measure responsiveness, we followed the approach of two previous classic studies – Adams et al. (2004) and Adams et al. (2006) – examining how party positions respond to changes in citizens’ ideological positions, but did so separately for each of the four ideological dimensions. The period covered by each ideological scale is shown in the second column of Table 1; they are available biannually. We matched each party’s domain-specific ideological position from the CMP with the nearest complete observation of its citizens’ ideologies. Thus for an election held in either 2016 or 2017, each party was matched with the ideological score of its country’s citizens for 2015–2016. 5 Each ideological scale had a mean of close to zero and SDs that ranged from 0.77 to 0.91.
In line with past studies, we used OLS regressions where the unit of analysis is each party at each election, clustering standard errors by election. For each of the four issue areas that we considered, the dependent variable was the change in dimension-specific left–right party position (e.g. social issues) since the previous election. The main independent variable of interest was the change in the dimension-specific left–right ideological position of the country’s citizens since the previous election. We also followed Adams et al. (2004, 2006) in including country fixed effects with no overall intercept, as well as controlling for a lag of the dependent variable, a lag of the change in the party’s vote share (i.e. between the previous two elections), and an interaction between the lagged dependent variable and the lagged change in vote share.
We carried out three different tests for responsiveness. The first simply asked whether parties respond to public opinion shifts in general. The second repeated the main test from Adams et al. (2004), asking whether responsiveness is conditioned by the type of public opinion shift: benign or harmful. Testing this involved respecifying public opinion shifts as ‘harmful’ when opinion moved in a direction that should make it harder for that party to be elected, assuming spatial voting (e.g. a left-wing party facing a rightward shift in public opinion), and ‘benign’ in the opposite situation (e.g. a right-wing party facing a rightward shift in opinion). The third repeated the main test from Adams et al. (2006), asking whether responsiveness is conditioned by party type: niche or mainstream. Testing this involved adding a dummy variable for niche parties and an interaction between this dummy and shifts in citizens’ ideologies. All of these additional variables were coded identically to the original papers. For instance, niche parties are parties from the green, communist/socialist and nationalist families.
Results
The results of our three tests are shown in tables 2, 3 and 4. We used the original variable names from Adams et al. (2004, 2006) for ease of comparison. The main variable of interest in Table 2 is public opinion shift: the change in each country’s domain-specific ideological position since the last election. Table 3 distinguishes between harmful and benign shifts in citizens’ ideology. There, harmful public opinion shift equals the change in citizens’ ideology when the change is harmful (as defined above) and zero otherwise, and benign public opinion shift equals the change in citizens’ ideology when the change is benign and zero otherwise. Table 4 distinguishes between niche and mainstream parties: niche equals 1 for niche parties and zero otherwise. In all three tables, previous policy shift refers to the lagged change in party position, and previous change in vote share measures the lagged change in the party’s vote share. Higher values for the dependent variable always indicate the party adopting a more right-wing stance in the given domain and higher values for public opinion shift indicate greater conservatism amongst citizens for the given domain. Positive coefficients for the public opinion shift variables would therefore imply responsiveness.
Tests of general domain-specific responsiveness.

Note: †= absolute economic scale (1); relative economic scale (2); social issues scale (3); immigration scale (4). Standard errors clustered by election. All models include country fixed effects.
p < 0.05.
Tests of domain-specific responsiveness for harmful and benign opinion shifts.

Note: †= absolute economic scale (1); relative economic scale (2); social issues scale (3); immigration scale (4). Standard errors clustered by election. All models include country fixed effects.
**p < 0.05.
Tests of responsiveness for niche and mainstream parties.
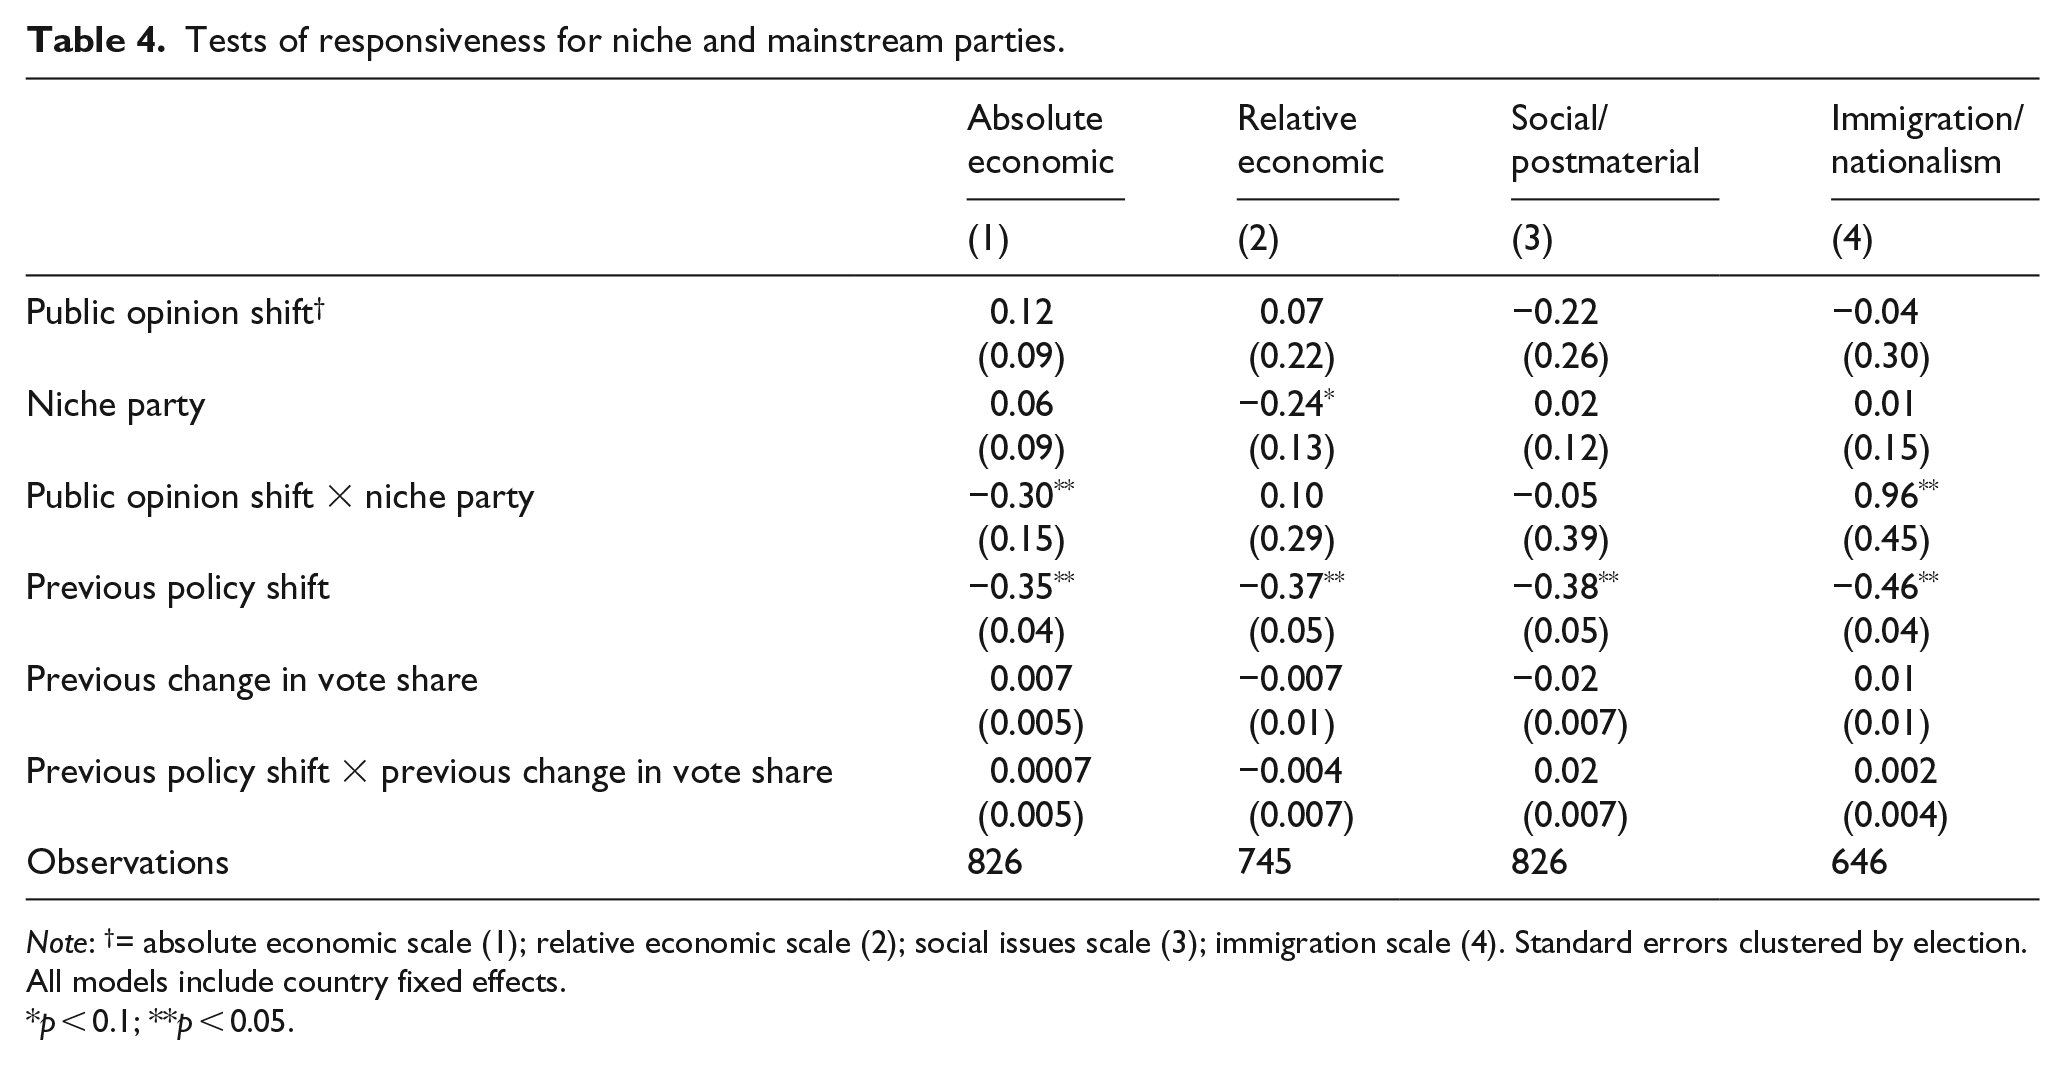
Note: †= absolute economic scale (1); relative economic scale (2); social issues scale (3); immigration scale (4). Standard errors clustered by election. All models include country fixed effects.
p < 0.1; **p < 0.05.
We found virtually no evidence that parties respond to opinion shifts in any of the issue domains, regardless of the type of party or the type of opinion shift. For all four issue areas, there was no evidence of statistically significant responses to ideological change (Table 2, first row), and no evidence of responsiveness to either harmful or benign ideological changes (Table 3, first two rows). The issue was not simply a lack of power to detect an effect. Instead, the estimated coefficients were substantially small and close to zero. Take as an example the largest coefficient on public opinion in Table 2, for immigration/nationalism. The SD of the party position variable for immigration is 2.04 and that of the immigration ideology scale is 0.88. Thus a 1-SD shift of the public to the right on immigration is estimated to be associated with only a 0.1-SD increase in parties’ immigration conservatism.
There was also very little evidence that responsiveness is moderated by type of party (Table 4, first three rows), except that niche parties were estimated to respond virtually one-to-one to changes in voters’ immigration ideologies. This finding is consistent with, for example, far-right parties becoming more opposed to immigration when their citizens become more opposed, and vice-versa for niche parties of the left. Even here however, with so many hypotheses being tested at once without adjustments for multiple testing, one should expect to see an occasional false positive result even in a world where all all effects are truly zero (Benjamini and Hochberg, 1995). Overall, our findings suggest that policy responsiveness to public opinion shifts is at best confined only to a small subset of parties on the single issue of immigration.
The Online Appendix extensively explores the robustness of these results. Our first robustness checks involved changing the sample used. Our results were unchanged both when we restricted attention only to Western European countries 6 and when we used only elections from before 1999, the same period covered by Adams et al. (2004, 2006). Our second set of robustness checks explored several different codings of the dependent variables, full details of which are in the Online Appendix. First, it might be considered questionable whether environmental issues belong in the social/postmaterial category. Lowe et al. (2011), for example, argue that environmental issues are more about economics and should be considered separately. We therefore recoded the party positions on social issues without the inclusion of environmental issues. Second, we explored recoding (a) absolute economic issues using the ‘free market economy’ scale proposed by Lowe et al. (2011); (b) relative economic issues using the ‘state involvement in the economy’ scale proposed by Benoit and Laver (2007); (c) social/postmaterial issues using the ‘social liberal–conservative’ scale proposed by Benoit and Laver (2007); and (d) using the ‘liberal–authoritarian’ scale proposed by Wagner and Meyer (2017). The results were again unchanged in all cases.
Finally, we explored changing the matching between citizens’ ideological positions and party positions. Instead of only using citizens’ ideological positions determined wholly before an election year, we considered ideological positions determined during and potentially after an election year. This means that, for instance, a party whose election occurred in 2015 is matched with the citizens’ ideological position from 2015–2016 instead of 2013–2014. Again, this had no impact on the results.
Discussion
Across many different model specifications, variable codings and samples we found robust evidence that European parties do not respond to shifts in their citizens’ ideological positions – at least as responsiveness has been defined by classic studies, using manifesto data as the outcome measure. 7 The new ideological scales provided by Caughey et al. (2019) enabled us to surmount many of the problems that exist with left–right self-placement data, allowing us to estimate responsiveness across a much wider set of countries and years as well as across multiple issue dimensions, respecting the multi-dimensional nature of contemporary European politics.
Our results suggest that prominent theories of representation in Europe may need to be reconsidered. From a normative perspective this may be worrying. The responsiveness of parties to voters is generally considered to be a cornerstone of democracy. It begs the question of what can explain the lack of responsiveness. We can suggest several possibilities to guide future research. The first is that the theory is correct, but we were unable to confirm it with the available data on party positions. Criticisms of the CMP abound in the literature (e.g. Mikhaylov et al., 2012), and changes in party positions measured by the CMP correlate poorly with other alternative measures purporting to capture the same concept (Adams et al., 2019). As Adams et al. (2019) argue, political scientists may need to rethink their reliance on the CMP and instead explore other measures of parties’ policy commitments. Alternatives include party press releases (Sagarzazu and Klüver, 2017), leaders’ speeches (Hobolt and Klemmensen, 2008) or voting advice applications (Gemenis, 2013).
Another possibility is that responsiveness does occur, but differently than via the framework used in this paper and in classic past studies. Responsiveness may occur more in response to changes in voters’ issue priorities than to their issue opinions (Klüver and Spoon, 2016). Or perhaps parties respond not to the electorate in general, but to sub-constituencies such as citizens who are more engaged with politics (see Adams and Ezrow, 2009), swing voters, groups with higher turnout, or their own party supporters. Testing many of these theories would require estimating multi-dimensional ideological positions for sub-groups, which is feasible using the methodology of Caughey et al. (2019).
Moreover, we looked only at short-term shifts in public opinion and party positions. Normatively, Mair (2009) argued that ‘responsible’ parties need not be responsive to short-term shifts in opinion, making decisions in the interest of the longer-term greater good. None of our results rule out the possibility that parties respond to broad shifts in opinion over longer time horizons than election-to-election. For example, the British Conservative Party made virtually no response to the large-scale liberalisation of public opinion on social and postmaterial issues from the early 1980s until the election of David Cameron as their leader in 2005. He quickly changed the party’s position towards greater support for environmental causes and LGBT rights. This large and sudden change in its position produced long-term congruence between the party’s policy position and public opinion.
Finally, policy positions are far from the only way in which parties can respond to public opinion. Changes in policies themselves are arguably a much more normatively important form of responsiveness, and again this type of responsiveness is not inconsistent with our results. Indeed, Caughey et al. (2019) find that countries do in fact respond to left-wing shifts on relative economic issues by raising the generosity of welfare provision. To us, a greater emphasis on policy responsiveness would represent an important way forward in this literature.
Supplemental Material
1908_Appendix_Representation_Paper_revised – Supplemental material for Not so responsive after all: European parties do not respond to public opinion shifts across multiple issue dimensions
Supplemental material, 1908_Appendix_Representation_Paper_revised for Not so responsive after all: European parties do not respond to public opinion shifts across multiple issue dimensions by Tom O’Grady and Tarik Abou-Chadi in Research & Politics
Footnotes
Declaration of conflicting interests
The author(s) declared no potential conflicts of interest with respect to the research, authorship, and/or publication of this article.
Funding
The author(s) received no financial support for the research, authorship, and/or publication of this article.
Supplementary materials
Notes
Carnegie Corporation of New York Grant
This publication was made possible (in part) by a grant from the Carnegie Corporation of New York. The statements made and views expressed are solely the responsibility of the author.
References
Supplementary Material
Please find the following supplemental material available below.
For Open Access articles published under a Creative Commons License, all supplemental material carries the same license as the article it is associated with.
For non-Open Access articles published, all supplemental material carries a non-exclusive license, and permission requests for re-use of supplemental material or any part of supplemental material shall be sent directly to the copyright owner as specified in the copyright notice associated with the article.