
Abstract
How do political actors value different portfolios? We propose a new approach to measuring portfolio salience by analysing paired comparisons using the Bradley–Terry model. Paired-comparison data are easy to collect using surveys that are user-friendly, rapid, and inexpensive. We implement the approach with serving legislators in Brazil, a particularly difficult case to assess portfolio salience due to the large number of cabinet positions. Our estimates of portfolio values are robust to variations in implementation of the method. Legislators and academics have broadly similar views of the relative worth of cabinet posts. Respondent valuations of portfolios deviate considerably from what would be predicted by objective measures such as budget, policy influence, and opportunities for patronage. Substantively, we show that portfolio salience varies greatly and affects the calculation of formateur advantage and coalescence/proportionality rule measures.
Introduction
Multiparty coalition formation is a longstanding theme in the study of parliamentary democracy and increasingly central in comparative presidentialism. Yet, not all cabinet-status positions are equally important. The long-running research program on “portfolio salience” seeks to assess the relative value of payoffs in cabinet formation.
Measuring portfolio salience is critical to interrogating rival hypotheses about formateur advantage versus proportionality in cabinet formation. While the former predicts that the coalition member recognized as the formateur would attempt to extract a disproportionate payoff (Rubinstein, 1982), empirical analyses tend to support “Gamson’s Law” of proportionality (Browne and Franklin, 1973; Gamson, 1961). This is a classic debate in the parliamentary systems literature (Warwick and Druckman, 2001), but it is especially relevant to presidentialism, wherein the formateur is selected exogenously and ex ante. If a “formateur bonus” is up for grabs, it could imply presidential-party retention of the most valuable cabinet positions. Accounting for portfolio salience might, therefore, reveal a reduction of proportionality (or “coalescence”) in the allocation to coalition partners.
Salience is fundamental to cabinet politics, but its measurement is vexing. It is not obvious whether one should use reputational prestige, policy outputs, or institutional size of the ministry in question. Some portfolios responsible for core policy decisions actually have modest budgets or few personnel, complicating comparisons based on observed characteristics of ministries (Batista, 2017). The revealed preferences of parties may be important, but using this information alone is complicated considering that parties may not always be programmatic or value cabinet positions for policy reasons (Adachi and Watanabe, 2007). Thus, in the wake of seminal work by Laver and Hunt (1992), several variations on expert surveys have been used to gauge portfolio salience. These surveys can be very demanding for respondents, and having experts rate all the extant ministries is often inefficacious. Moreover, there is need of evidence to show that expert judgement coincides with the views of political practitioners.
These earlier efforts inspire the present article, in which we propose the Bradley–Terry (BT) model to analyse pairwise comparisons of cabinet positions. The basic BT model has been applied in many fields, from psychology (to recover “ability” scales from observed pairwise comparisons) to sports journalism (as in the college football rankings popular in the US [New York Times 1979]). Respondents need only choose the more valuable portfolio from a few different pairs of options presented to them.
We test this simplified approach on new data from original surveys of Brazilian politicians and experts. As a paradigmatic case of “coalitional presidentialism,” Brazil has spawned the largest literature on coalition governments outside of parliamentary democracies (Chaisty et al., 2018). The country boasts a large, heterogeneous set of cabinet-level posts, which would seem to make it impractical to ask respondents to rate all of them—an obstacle that, we show, can be overcome by the BT model.
In sum, our contribution is to apply an established method to an elusive problem. This novel application allows for greatly simplified data collection that helps advance our substantive understanding of portfolio allocation via improved measurement of the formateur advantage (Altman, 2000) and of the proportionality of cabinet shares (Amorim Neto, 2002).
Measuring portfolio salience using the BT model
The BT model, originally proposed in Bradley and Terry (1952), is based on contests between alternatives. Decisions may be based on subjective evaluations of properties of the objects made by referees (e.g. taste) or on objective outcomes, such as the score of a football game. In political science, cognate approaches have appeared sporadically, but direct applications of BT remain rare. 1
For each matchup between two cabinet portfolios, our subjects were asked to choose the more valuable one. In our application, the “items” being rated are “ministries” (M), the referees making the decisions are either legislators or experts, and the underlying scale being recovered is referred to as the “worth” or “value” of each item. We are not interested in examining the impact of specific attributes of each item on this choice; our sole goal is to retrieve the underlying relative value for each item.
The BT model is ideally suited for this because it is built on the probability that one item

In its original formulation, this probability of selection is then expressed in terms of exponential functions
In short,
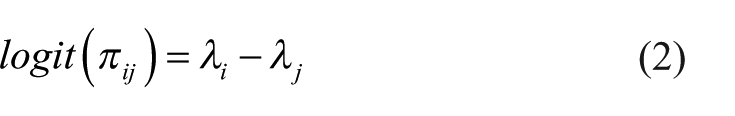
The BT model employs a logit transformation,
2
but alternative functions have been used. As others have noted (Luce et al., 1990), this specification meets the strong stochastic transitivity condition, such that when
This simple specification we employ is referred to as the “unstructured” BT model, but numerous extensions have been proposed, including allowing for rankings of more than two options (Böckenholt, 2001). These extensions are unnecessary to us, as our goal was simply to retrieve the underlying relative valuations of portfolios, keeping the survey instrument as simple as possible.
The data
We fielded two surveys simultaneously in Brazil in 2017, one with 142 legislators in the National Congress (the “elite” survey) and one with experts. In both, we presented pairs of ministries that existed in 2014 and 2015, the last two full years of president Dilma Rousseff’s administration. 3 A total of 37 ministries were rated, 4 which implies the existence of 666 pairwise comparisons. Since it was not feasible to have all participants review all possible matchups, we randomized the items presented to each respondent.
The expert survey was conducted online with 283 members of the Brazilian Political Science Association (ABCP). It solicited demographic data and asked whether respondents considered themselves “experts” in executive–legislative relations or other subfields. In pairwise comparisons, respondents were asked to choose the ministry they thought a typical politician would prefer to obtain for his or her party. 5 Each respondent answered an initial battery of eight comparisons, and most opted to review three additional pairs. Item non-response was minimal, so we treat it as completely random.
Because the BT model uses the transitivity assumption to leverage information from multiple comparisons, we undertook to minimize the number of “lopsided” matchups. Thus, we stratified the portfolios into four tiers based on our own a priori expectations about their reputational value. In eight of the 11 matchups, the two competing portfolios were drawn from a subset of two adjacent tiers, and six of these involved the highest-valued tier. Thus, while portfolios were still randomly drawn, there are more “close” comparisons in our dataset than would have obtained with simple randomization, and more contests involving high-profile ministries. The expert survey generated data from 3101 comparisons; 275 of the possible pairwise 666 contests were never observed, while four contests were observed more than 20 times.
The elite survey was embedded in the Brazilian Legislative Survey (BLS), so space was limited to four pairwise comparisons per respondent. The BLS was implemented using both an online version and a paper questionnaire. In the electronic version, we implemented a randomization scheme almost identical to the one described for the expert survey. On the hard-copy instrument, we created five different sets of four randomly drawn pairwise comparisons, and these were randomly distributed to parliamentarians. 6 Legislators were asked which ministry they would prefer their party held. Some 62 responded online and 80 on paper. The elite data encompass 560 pairwise comparisons, with 221 different matchups occurring at least once.
In both datasets, all 37 portfolios were rated (at least 102 times by experts and at least seven times by practitioners). Items that appear more often have smaller confidence intervals, and estimates from the expert dataset are more precise than those from the elite dataset. Substantively, the elite survey is our preferred source of data, as it reflects the perceptions of individuals who operate directly in the arena of government formation. However, below we present both surveys, not only to gauge robustness and to check the convergence between elite and expert valuation of portfolios, but also to assess the feasibility of applying the BT method to this and other political science measurement tasks.
Survey instruments with pairwise comparisons are impressively user-friendly. Several ABCP colleagues reported to us that the survey was “fun,” which may explain why 273 of the 278 participants opted to continue on past the first eight pairwise comparisons. Median time to completion for the entire expert survey was just over 4 min.
The values of ministerial positions
Our main results were generated by applying the BT model to data from the elite survey. In Table 1, cabinet-level positions are ranked from highest to lowest according to the point estimates of the value of each portfolio. The first column reports our pre-stratification of ministries into four tiers. The following columns report our estimates of
Estimated values of portfolios, elite and expert surveys.
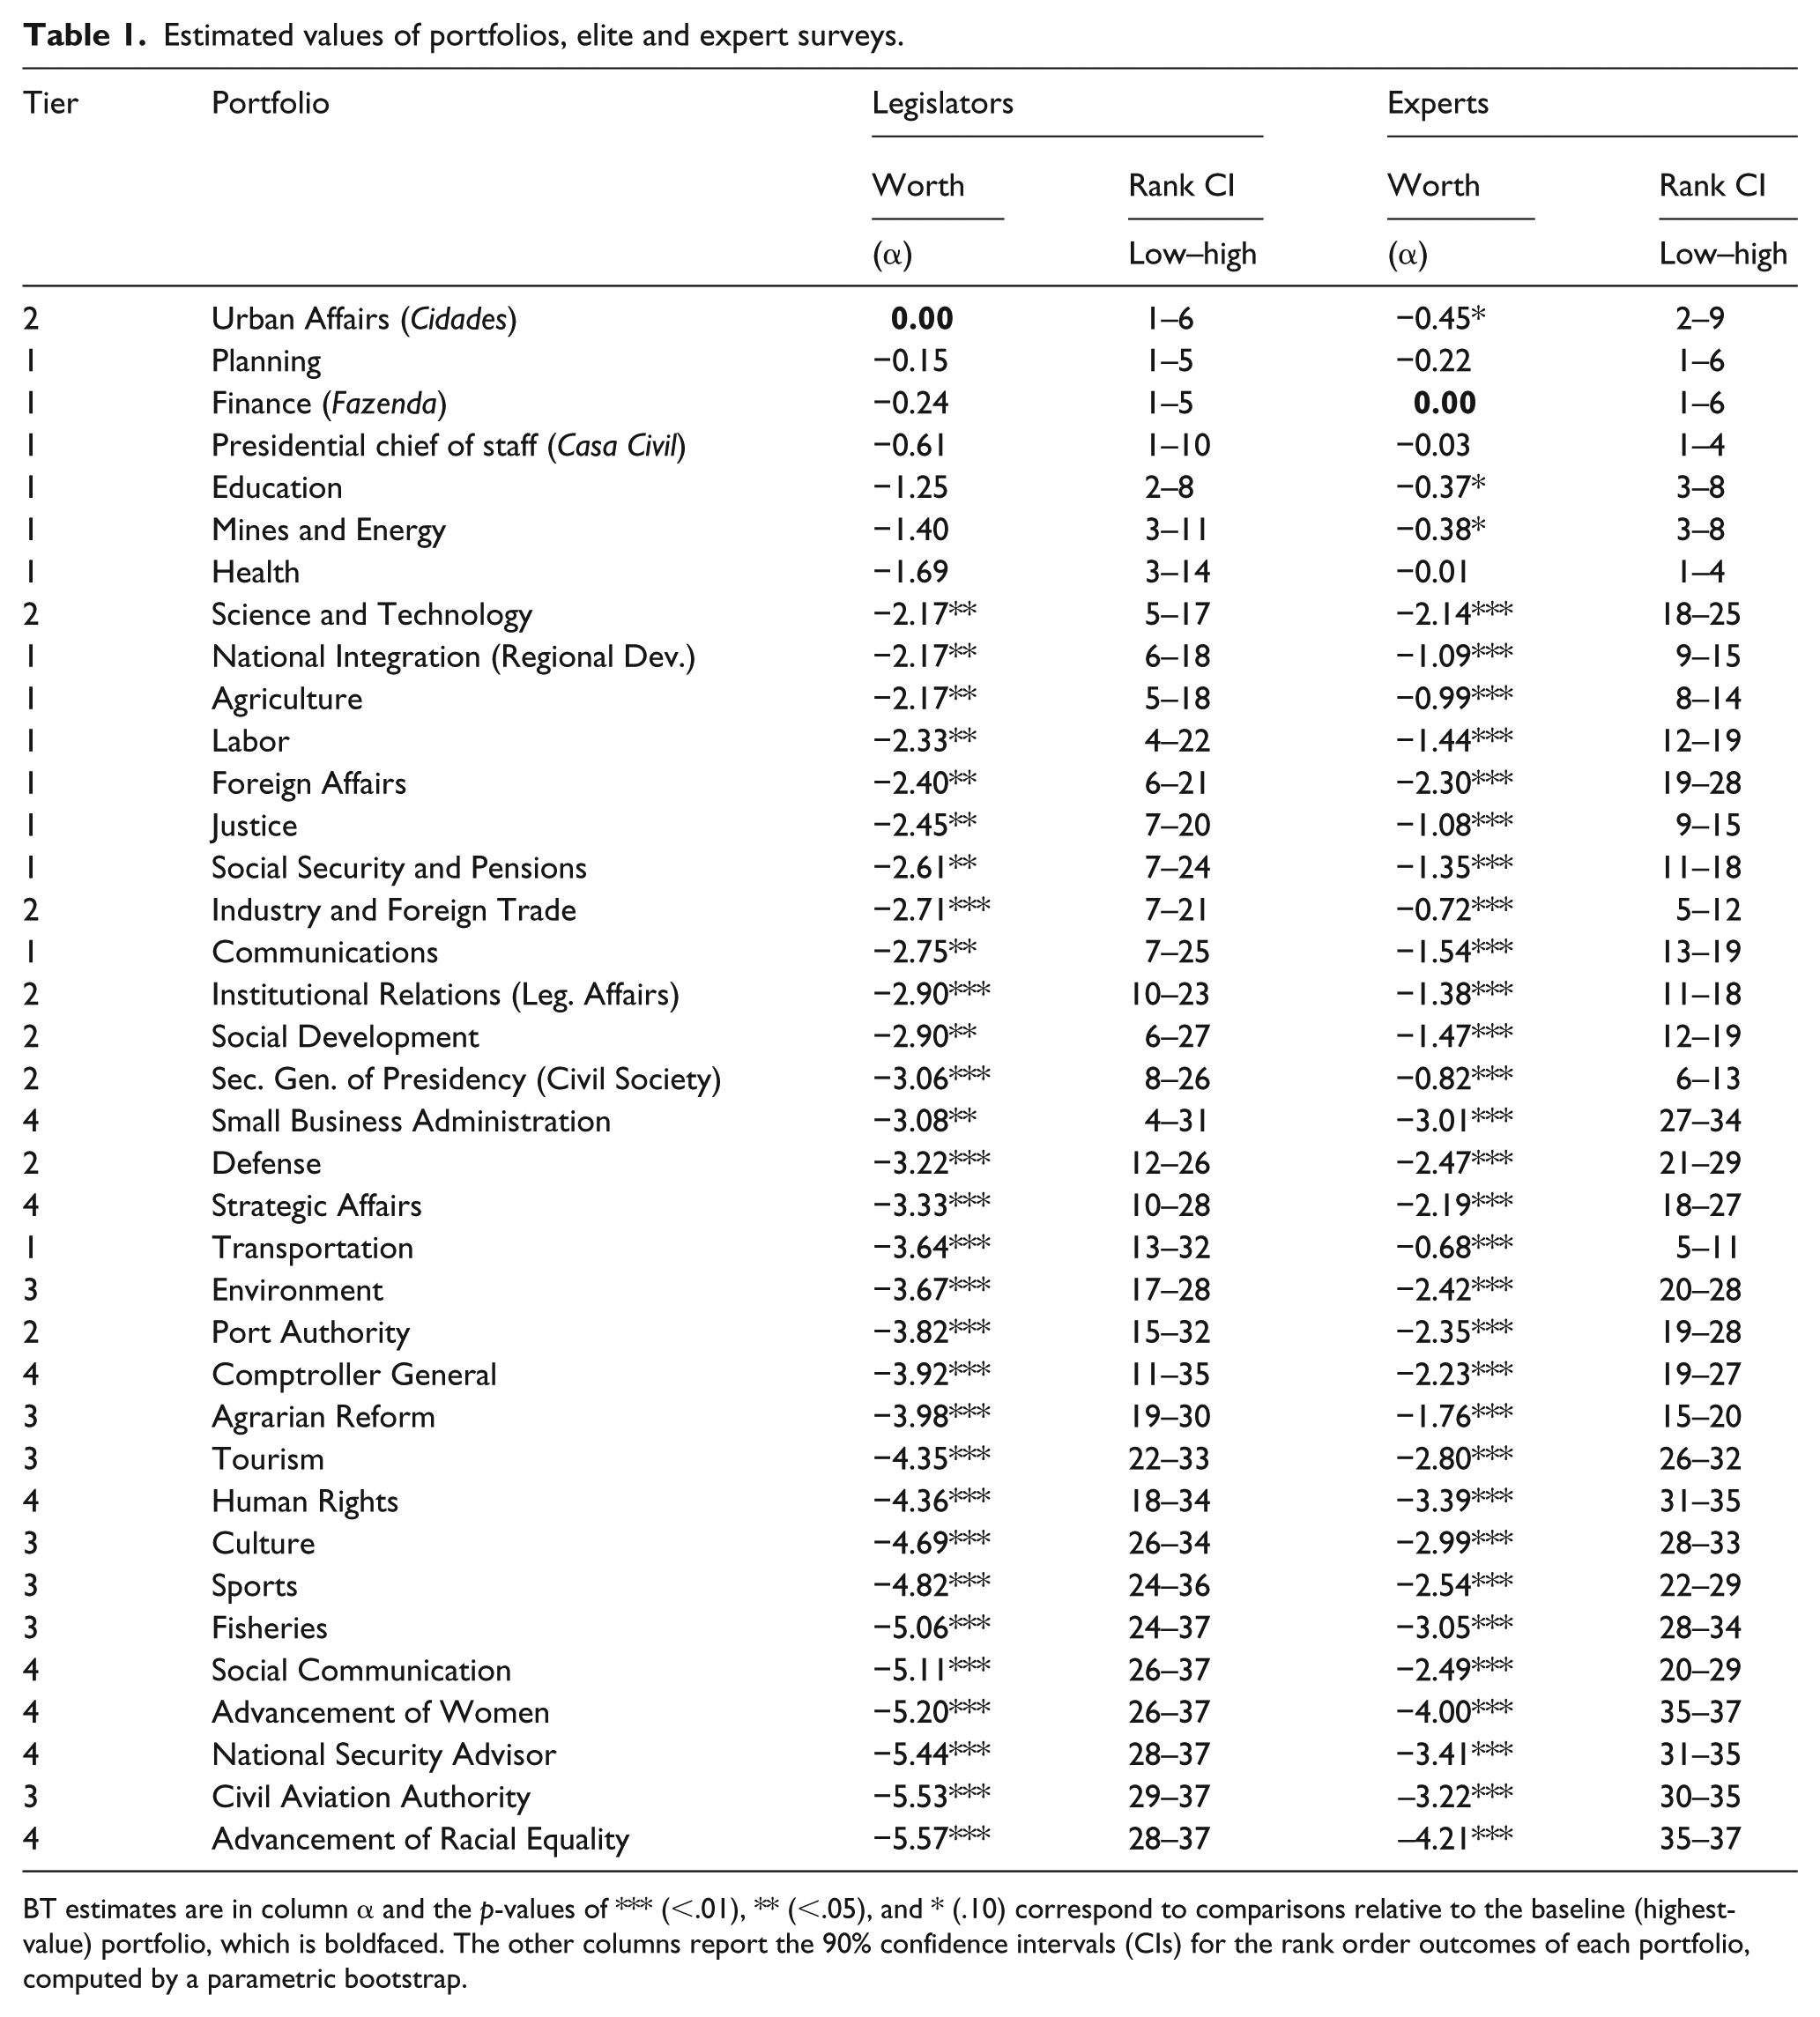
BT estimates are in column α and the p-values of *** (<.01), ** (<.05), and * (.10) correspond to comparisons relative to the baseline (highest-value) portfolio, which is boldfaced. The other columns report the 90% confidence intervals (CIs) for the rank order outcomes of each portfolio, computed by a parametric bootstrap.
Our initial intuitions were not far off from legislators’ opinions. However, there were some important differences, as exemplified by the Ministério das Cidades (Urban Affairs). This portfolio was assigned to the second tier by us but was viewed by legislators as the most valuable ministry. Interestingly, among the top-ranked portfolios, we observe two that are important sources of pork and patronage (Urban Affairs and Education), two that are ostensibly “core policy” ministries with few material goods to distribute but considerable policy influence (Finance and Planning), and one that is the quintessential political coordination portfolio (Casa Civil, the presidential chief of staff). Salience incorporates various influences not easily captured by a common set of observable characteristics, thus reinforcing the importance of a perceptual measure such as the one we propose.
However, it is also the case that the estimates are noisy. The top-ranked portfolio, for instance, cannot be statistically distinguished from the subsequent five. It is not feasible to report p-values for all pairwise comparisons, so we developed and reported bootstrapped confidence intervals for the rank-order of each portfolio. 7 Uncertainty, however, can be resolved with slightly larger datasets. Consider the rightmost columns in Table 1, which report estimates obtained with data from the larger expert survey. The group of ministries that cannot be distinguished from the most valuable one is now reduced to three, and the average standard error is 0.26 compared to 1.13 in the elite survey. Similarly, the maximum width of the rank-order confidence interval is 9 (compared to 27 in the elite survey).
We expected some differences between assessments made by politicians and political scientists, as some portfolios are esteemed by elites for reasons not always apparent to external observers. For example, Urban Affairs controls one of the largest social housing programs in the world (Minha Casa Minha Vida). This program is important not simply because of its raw budget, but also because it liaises with over 5000 mayors and connects them to construction firms. Mines and Energy controls many concessions and is responsible for regulation. While these functions may not appear in objective indicators of importance, they are critically important to interest groups.
Comparison of the two datasets reveals many more similarities than differences. The linear correlation coefficient between the two sets of estimates is
Interestingly, Small Business is once again the most noisily estimated cabinet-level post, and Comptroller General is not far behind. This suggests that much of the uncertainty around these estimates reflects real irresolution among respondents and is not an artifact of the model or dataset.
Figure 1 reinforces our finding of broad similarity between the two surveys. There is agreement about the most valuable ministries, although legislators discriminate within this subset more strongly than do academics. Both sets of referees also identify a sizeable set of bottom-feeding portfolios. From a universe of 37, the scatterplot identifies only four real outliers: Foreign Affairs, Small Business, Transportation, and Science and Technology. Only for the latter two portfolios do the rank confidence intervals not overlap. Expert opinion largely conforms to practitioner judgment.
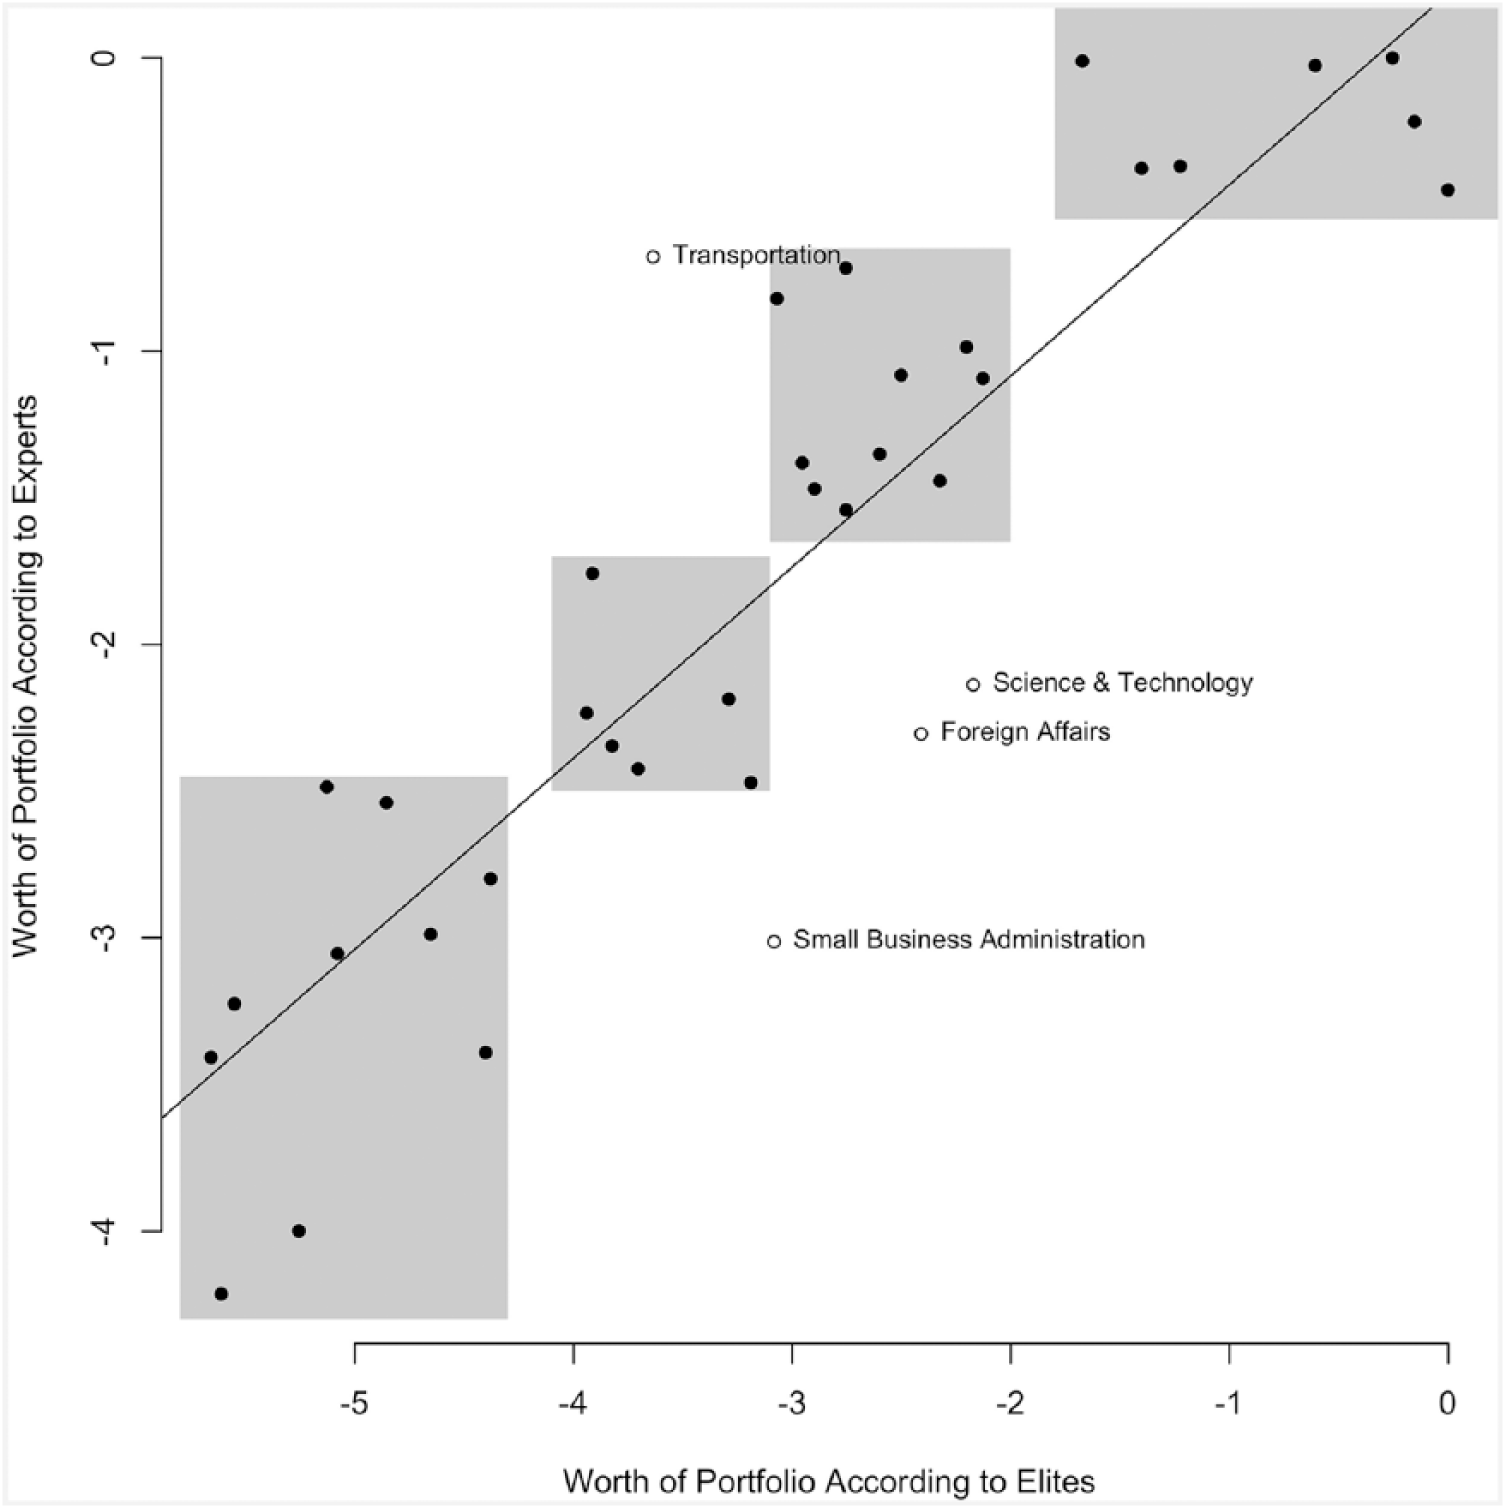
Comparison of elite and expert opinions.
Estimates versus observable measures
Does our approach generate any information we could not obtain observationally? If we could predict salience solely with objective indicators, surveys would be unnecessary. To examine this question, we compiled data on some intuitively important characteristics of Brazilian ministries in 2015, the last year in which all 37 of our portfolios coexisted.
We obtained each ministry’s effective total and investment budget, 8 as well as the total number of political appointments available within each ministry, 9 and the total number of legislative bills authored or co-signed by each ministry in 2015 (our measure of policy influence). Table 2 shows the correlations between the expert- and elite-based BT estimates and each objective indicator. The correlations are strongest when it comes to political appointees, suggesting that a key dimension of portfolio salience is patronage potential. The correlations are slightly weaker for policy influence and, surprisingly, much weaker for the indicators of budgetary impact.
Linear associations between BT estimates and observable indicators for 2015.

Entries are correlation coefficients and respective p-values (***< 0.01, **< .05, and *< .10) between the BT estimates of portfolio worth (drawn from Table 1) and each of the other variables. Appointees is the raw number of discretionary DAS positions (levels 1–6) allocated to the ministry (source: Ministry of Planning); Policy Influence is the number of legislative bills signed by the ministry (source: Library of the Presidency); Total Budget and Investment Budget are the value in Brazilian reais of the authorized total and investment budget of the ministry (source: National Secretary of the Treasury). Predicted Worth scores are the predicted portfolio estimates drawn from a regression model of our BT measure of worth on the four indicators, estimated separately for each survey. See supplemental material for other definitions and sources.
In fact, even if we combine all indicators into a linear predictor by regressing the BT estimates on all observed characteristics, the linear correlation between the predicted worth and our estimates does not rise past 0.6 (implying an R2 of just under 0.4). This suggests that both experts and politicians have information beyond what objective indicators can reveal, and that the desirability of portfolios depends on attributes that vary (qualitatively) across units. Therefore, even if we correctly identify a menu of characteristics that matter, they are unlikely to matter equally for all portfolios. Deductively defining a model to account for this heterogeneity is much harder than simply collecting perceptual data directly from politicians and experts. We suspect that perceptual data already incorporate this elusive cross-unit heterogeneity, and this folk wisdom then informs a series of simple binary choices made in the surveys.
Substantive implications: formateur advantage and proportionality
We return now to how these estimates can be used to inform key debates in the coalition politics literature. Do the formateur bonus and coalescence remain the same once we account for salience? 10 In order to address this question, we computed two variants of monthly indicators of both variables, one unweighted version (that treats each ministry equally) and one in which we weight each ministry based on our BT point estimates.
This comparison requires a non-trivial manipulation of the data because the BT-worth parameters are estimated on an arbitrary scale. Hence, to provide them with a substantive interpretation we rescale the weights so that the most valuable portfolio is worth 10 times the least valuable one. 11
Figure 2 shows the extent to which weighting the cabinet positions affects our indicators of interest. The panel on the right reports the formateur advantage. In a few short periods between 1995 and 2016, reweighting actually generates figures that are statistically different from the unweighted values. 12 Unsurprisingly, the salience-corrected values of the formateur advantage are almost always higher than the unweighted values, a fact that is likely not lost on legislators as they monitor the president’s self-awarded bonus.
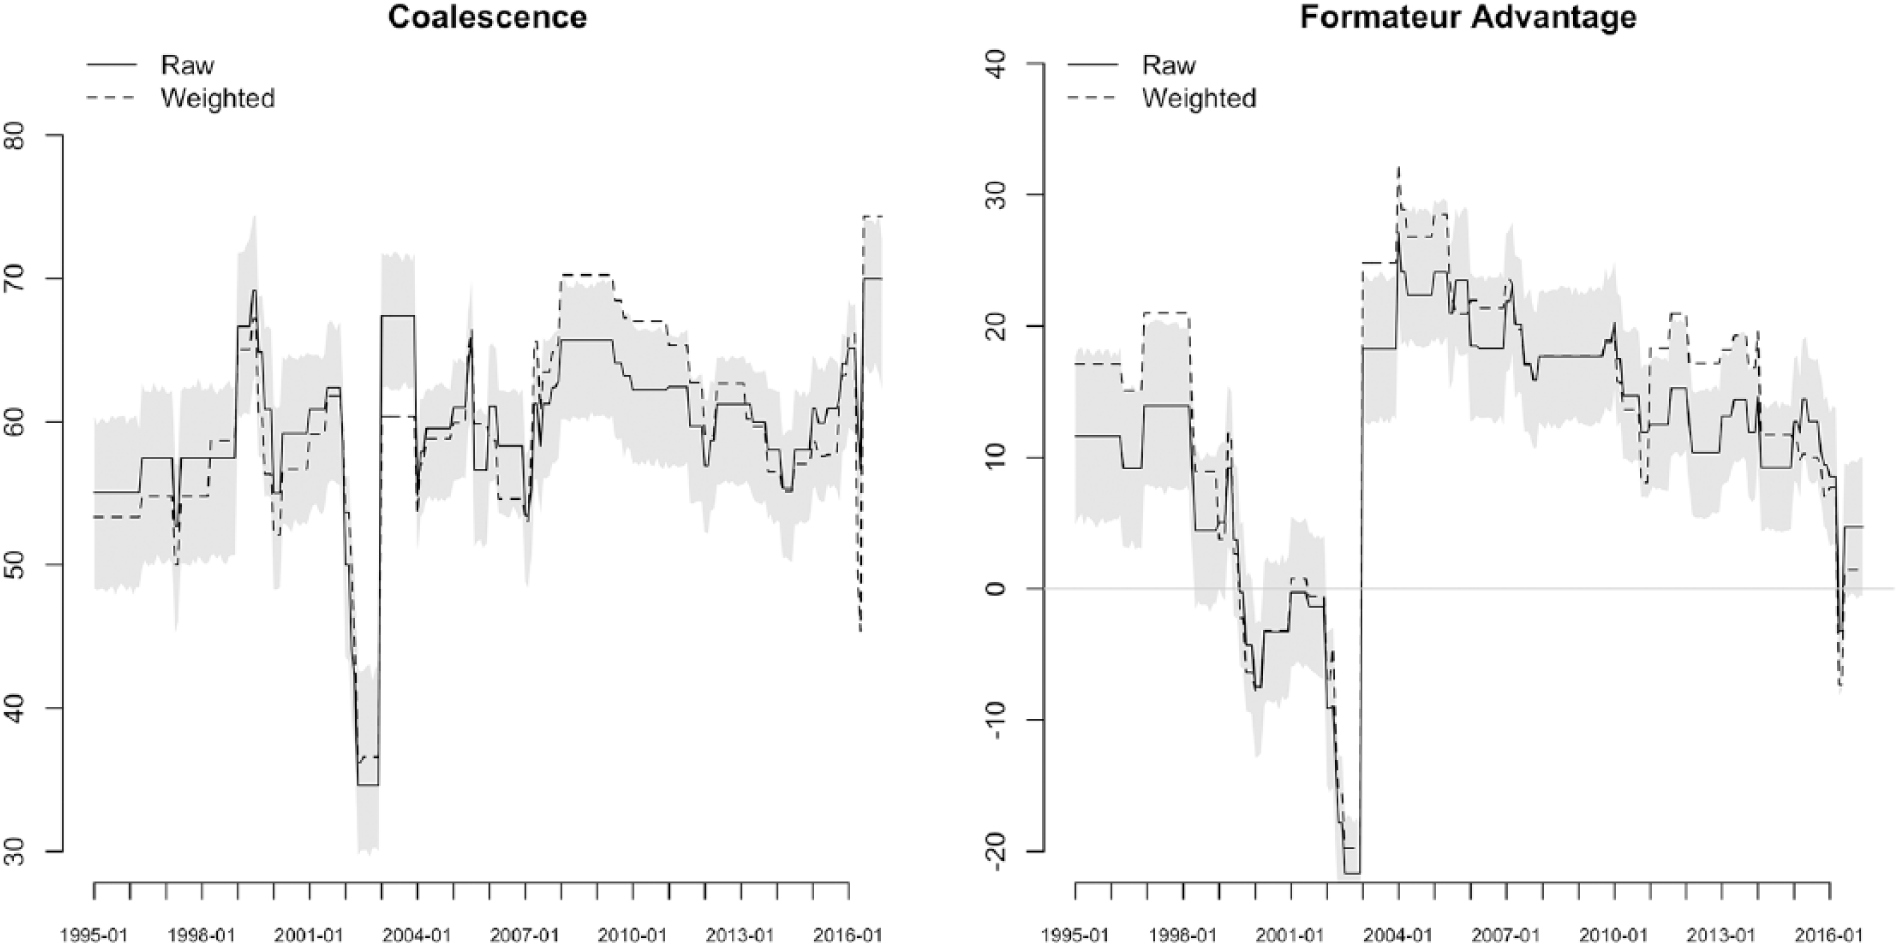
Raw and weighted coalescence and formateur advantage (1995–2016).
Weighted coalescence, in contrast, does deviate from the unweighted version significantly between 2007 and 2013 and at the tail end of the period. This suggests that salience correction does matter, which stands in contrast to results for parliamentary systems (Warwick and Druckman, 2001). Proportionality of portfolio allocation is viewed through a political lens that is absent in standard treatments of coalescence.
Conclusion
We propose a portfolio salience measure estimated by applying the BT model to pairwise comparisons of ministries undertaken by relevant informants (either experts or politicians). A major advantage of this approach is that the relevant data can be collected through simple, brief surveys that present respondents with a series of head-to-head matchups between concrete alternatives.
We show that legislators’ ranking of cabinet posts deviates from what would be predicted by observable characteristics of ministries, revealing “private information” that is not otherwise easily quantifiable. We also show that experts reach very similar conclusions, which means that expert surveys implementing our approach—which tend to be easier to field than surveys with elites—might generate estimates that are “good enough” for most research purposes. In both pools of informants, the “wisdom of the crowds” seems to trump observation of objective indicators. Lastly, we show that portfolio allocation patterns can appear significantly different when adjusted for salience, which is a novelty relative to the parliamentary systems literature.
Supplemental Material
CabinetValuesMethods-v17-Supplementary_Information – Supplemental material for Measuring portfolio salience using the Bradley–Terry model: An illustration with data from Brazil
Supplemental material, CabinetValuesMethods-v17-Supplementary_Information for Measuring portfolio salience using the Bradley–Terry model: An illustration with data from Brazil by Cesar Zucco, Mariana Batista and Timothy J. Power in Research & Politics
Footnotes
Acknowledgements
The authors are grateful to the executive council of the Brazilian Political Science Association for assistance with the expert survey. Octavio Amorim Neto provided helpful comments on an earlier draft.
Declaration of conflicting interests
The author(s) declared no potential conflicts of interest with respect to the research, authorship, and/or publication of this article.
Funding
The author(s) disclosed receipt of the following financial support for the research, authorship, and/or publication of this article: The 8th wave of the Brazilian Legislative Survey was supported by the Brazilian School of Business and Public Administration, Getúlio Vargas Foundation.
Supplemental materials
Notes
Carnegie Corporation of New York Grant
This publication was made possible (in part) by a grant from the Carnegie Corporation of New York. The statements made and views expressed are solely the responsibility of the author.
References
Supplementary Material
Please find the following supplemental material available below.
For Open Access articles published under a Creative Commons License, all supplemental material carries the same license as the article it is associated with.
For non-Open Access articles published, all supplemental material carries a non-exclusive license, and permission requests for re-use of supplemental material or any part of supplemental material shall be sent directly to the copyright owner as specified in the copyright notice associated with the article.