
Abstract
While the literature on tactical voting suggests third parties are not likely to form under first-past-the-post rules, the literature also provides several potential explanations for why third parties have flourished in several first-past-the-post systems, and why voters will support these parties. This research note examines the most popular of these explanations, which holds that voters supporting parties placing third or worse in their district fail to recognize their party is out of the running. Using Canadian Election Study data from three recent elections, the results show that most voters supporting parties placing third or worse in their districts recognize that their parties are not likely to finish first or second. These results suggest more attention should be paid to other potential explanations for third-party voting in first-past-the-post systems.
Previous literature holds that tactical voting inhibits the development of third parties in first-past-the-post (FPTP) systems. Third-party supporters are expected to vote tactically for a less-preferred party with a better chance of winning to avoid casting wasted votes and seeing their least-preferred party win. Despite this, however, a growing body of research notes that party system fragmentation often exceeds the two-party predictions associated with “Duverger’s Law” (see Singer, 2013 and the works cited therein).
Cox (1997: 76–79) provides four sets of explanations for why voters may not vote tactically. One is that voters are focused on the long-term rather than the short-term consequences of their actions. A second is that voters hold their first preferences too intensely and/or are indifferent towards second/lower preferences to vote tactically (e.g. Blais, 2002). A third holds that voters believe one party will win with certainty (in which case there is no reason to vote tactically). A fourth holds that voters’ perceptions of the parties’ chances of winning their district prevent them from voting tactically because they fail to recognize their preferred party is likely to place third or worse. Most recent research seeking to explain support for third parties in FPTP systems focuses on this fourth explanation, concluding that voters often fail to recognize when their most-preferred party is out of the running, and thus do not vote tactically (Blais, 2002; Blais and Turgeon, 2004; Clough, 2007).
While many voters may not recognize which parties are out of the running in their districts, the fact many parties routinely place third or worse in election after election makes it hard to believe that third-party voters consistently misperceive these parties’ chances. This is especially the case for third parties that rarely win seats, whose supporters should recognize they have little chance of winning. If these and other voters supporting third-placed parties cast their votes knowing these parties will not likely win, this would call into question whether third-placed voting is due to the failure of one of the other assumptions required for tactical voting to limit the number of parties to two.
In this research note, I examine violations of the fourth assumption required for tactical voting to occur (i.e. whether voters supporting a party placing third in their district fail to recognize that this party is out of the running) using the case of Canada. Despite using FPTP rules, Canada has a multiparty system not only at the national level, but also at the district level, where multiparty fragmentation is the norm (Johnston and Cutler, 2009). Canadian elections have, historically, centered on the only two parties to have controlled government: the centrist Liberals and the center-right Conservatives. Since 1961, the center-left, social democratic New Democratic Party (NDP) has also contested most districts despite failing to win many seats—often placing third or worse behind the Liberals and Conservatives (with the exception of 2011, in which the NDP’s vote share surpassed the Liberals’ for the first time). More recently, the Green Party has begun contesting most districts across the country. While the NDP and Greens occasionally finish first or second in some districts, the fact significant numbers of voters continue to support these parties in spite of their third-place status in most districts requires explanation. If voters supporting parties placing third (or worse) in their districts do so knowing that these parties are likely to finish third, this would suggest that the impact of voters’ perceptions of viability on third-party voting is more limited than previously thought—and that research examining violations of the other assumptions required for tactical voting to occur is needed to understand why third parties often win non-trivial vote shares in FPTP systems.
Data analysis
To determine whether Canadian voters supporting parties finishing third or worse in their districts recognize that these parties are out of the running, I analyze voter perceptions in districts where the party they voted for placed third or worse, focusing only on respondents facing the choice of voting tactically or not (Alvarez et al., 2006). 1 To this end, I use data from the 2006, 2008, and 2011 Canadian Election Studies. The pre-election waves of these surveys contained questions tapping voters’ perceptions of electoral viability validated by previous research as accurate measures of respondents’ assessments (Blais et al., 2008). Specifically, respondents were first asked which party had the best chance of winning their district, and then asked whether they thought a second party had a chance of winning. Using these questions, I created variables identifying respondents who correctly perceived that the party they voted for was likely to place third or worse—and thus was out of the running—in their districts (relative to those who did not). To rule out the possibility that third-party voting was due to voters perceiving that only one party had a chance of winning, I restrict the analysis to respondents perceiving that at least two parties had a chance of winning their district.
Table 1 presents the percentages of third-party voters correctly perceiving that the party they voted for was out of the running. Clear majorities of both NDP and Green Party voters recognize that these parties have little chance of winning their districts. While a lack of accurate information about the parties’ chances may explain why some voters support parties placing third or worse in their districts, a lack of information cannot explain why clear majorities of these parties’ voters do so. If anyone has inaccurate perceptions of the parties’ chances of winning the district, it is those voting for the Conservatives and Liberals. Though the percentages of voters perceiving each party as out of the running in the district are considerably smaller than the shares of NDP and Green Party voters, the fact remains that non-trivial shares of Liberal and Conservative voters in districts where each party finished third or worse voted for the party despite knowing it was out of the running.
Correct perceptions of party viability among third-party voters in districts where the party placed third or worse, by party voted for.

Entries are the sample-weighted percentages of third-party voters in districts outside Québec where their parties placed third or worse perceiving that the party they voted for was out of the running (with the weighted number of observations in parentheses).
Before concluding that many third-party voters accurately perceived the party they supported as out of the running, we must account for several alternative explanations of voters’ perceptions of parties’ viability. To this end, I merged data from all three elections and estimated a series of logistic regression models predicting whether voters correctly perceived each party as non-viable in districts where the party finished third or worse. I expand the samples used in Table 1 to include those not voting for the party placing third. This allows us to compare the perceptions of voters supporting parties finishing third or worse with the perceptions of other parties’ voters. If third parties succeed in winning votes due to voter misperceptions about their viability, we would expect voters supporting third-placed parties would be considerably less able to perceive them as non-viable than voters supporting one of the top two parties in the district. 2
To rule out potential partisan-motivated reasoning—like “wishful thinking,” when voters over/underestimate a party’s chances because they like/dislike the party—I included feeling thermometers for each party. I also included variables to rule out the possibility that voters may be less able to perceive when parties are non-viable in more competitive districts, defined separately as the competition between first- and second-placed parties in the district, and the competition between each party and the party placing second. Finally, dummy variables are included to account for election-specific differences in the probabilities of voting for each party.
Parameter estimates appear in Table 2. The results show that Liberal and Conservative voters were no less likely to perceive these parties as being out of the running in their districts than other parties’ voters. Even when we assume preference orderings with the minimum possible differences in thermometer scores between the parties to minimize the impact of these variables on perceptions of viability—using the mean scores assigned to the parties by each party’s voters to arrange parties in order of preference 3 —and hold the second/third-party competitiveness score to 0.5 (assuming a third-party’s vote share is half as large as the second-place party), 4 the bottom of Table 2 shows that a majority of all four parties’ voters possessed accurate perceptions. While NDP and Green Party voters were significantly less likely to perceive these parties as out of the running than other parties’ voters, the percentages of NDP/Green voters correctly perceiving each party to be out of the running exceeded those of Liberal and Conservative voters.
Logistic regression estimates of voters’ perceptions of whether parties are out of the running.
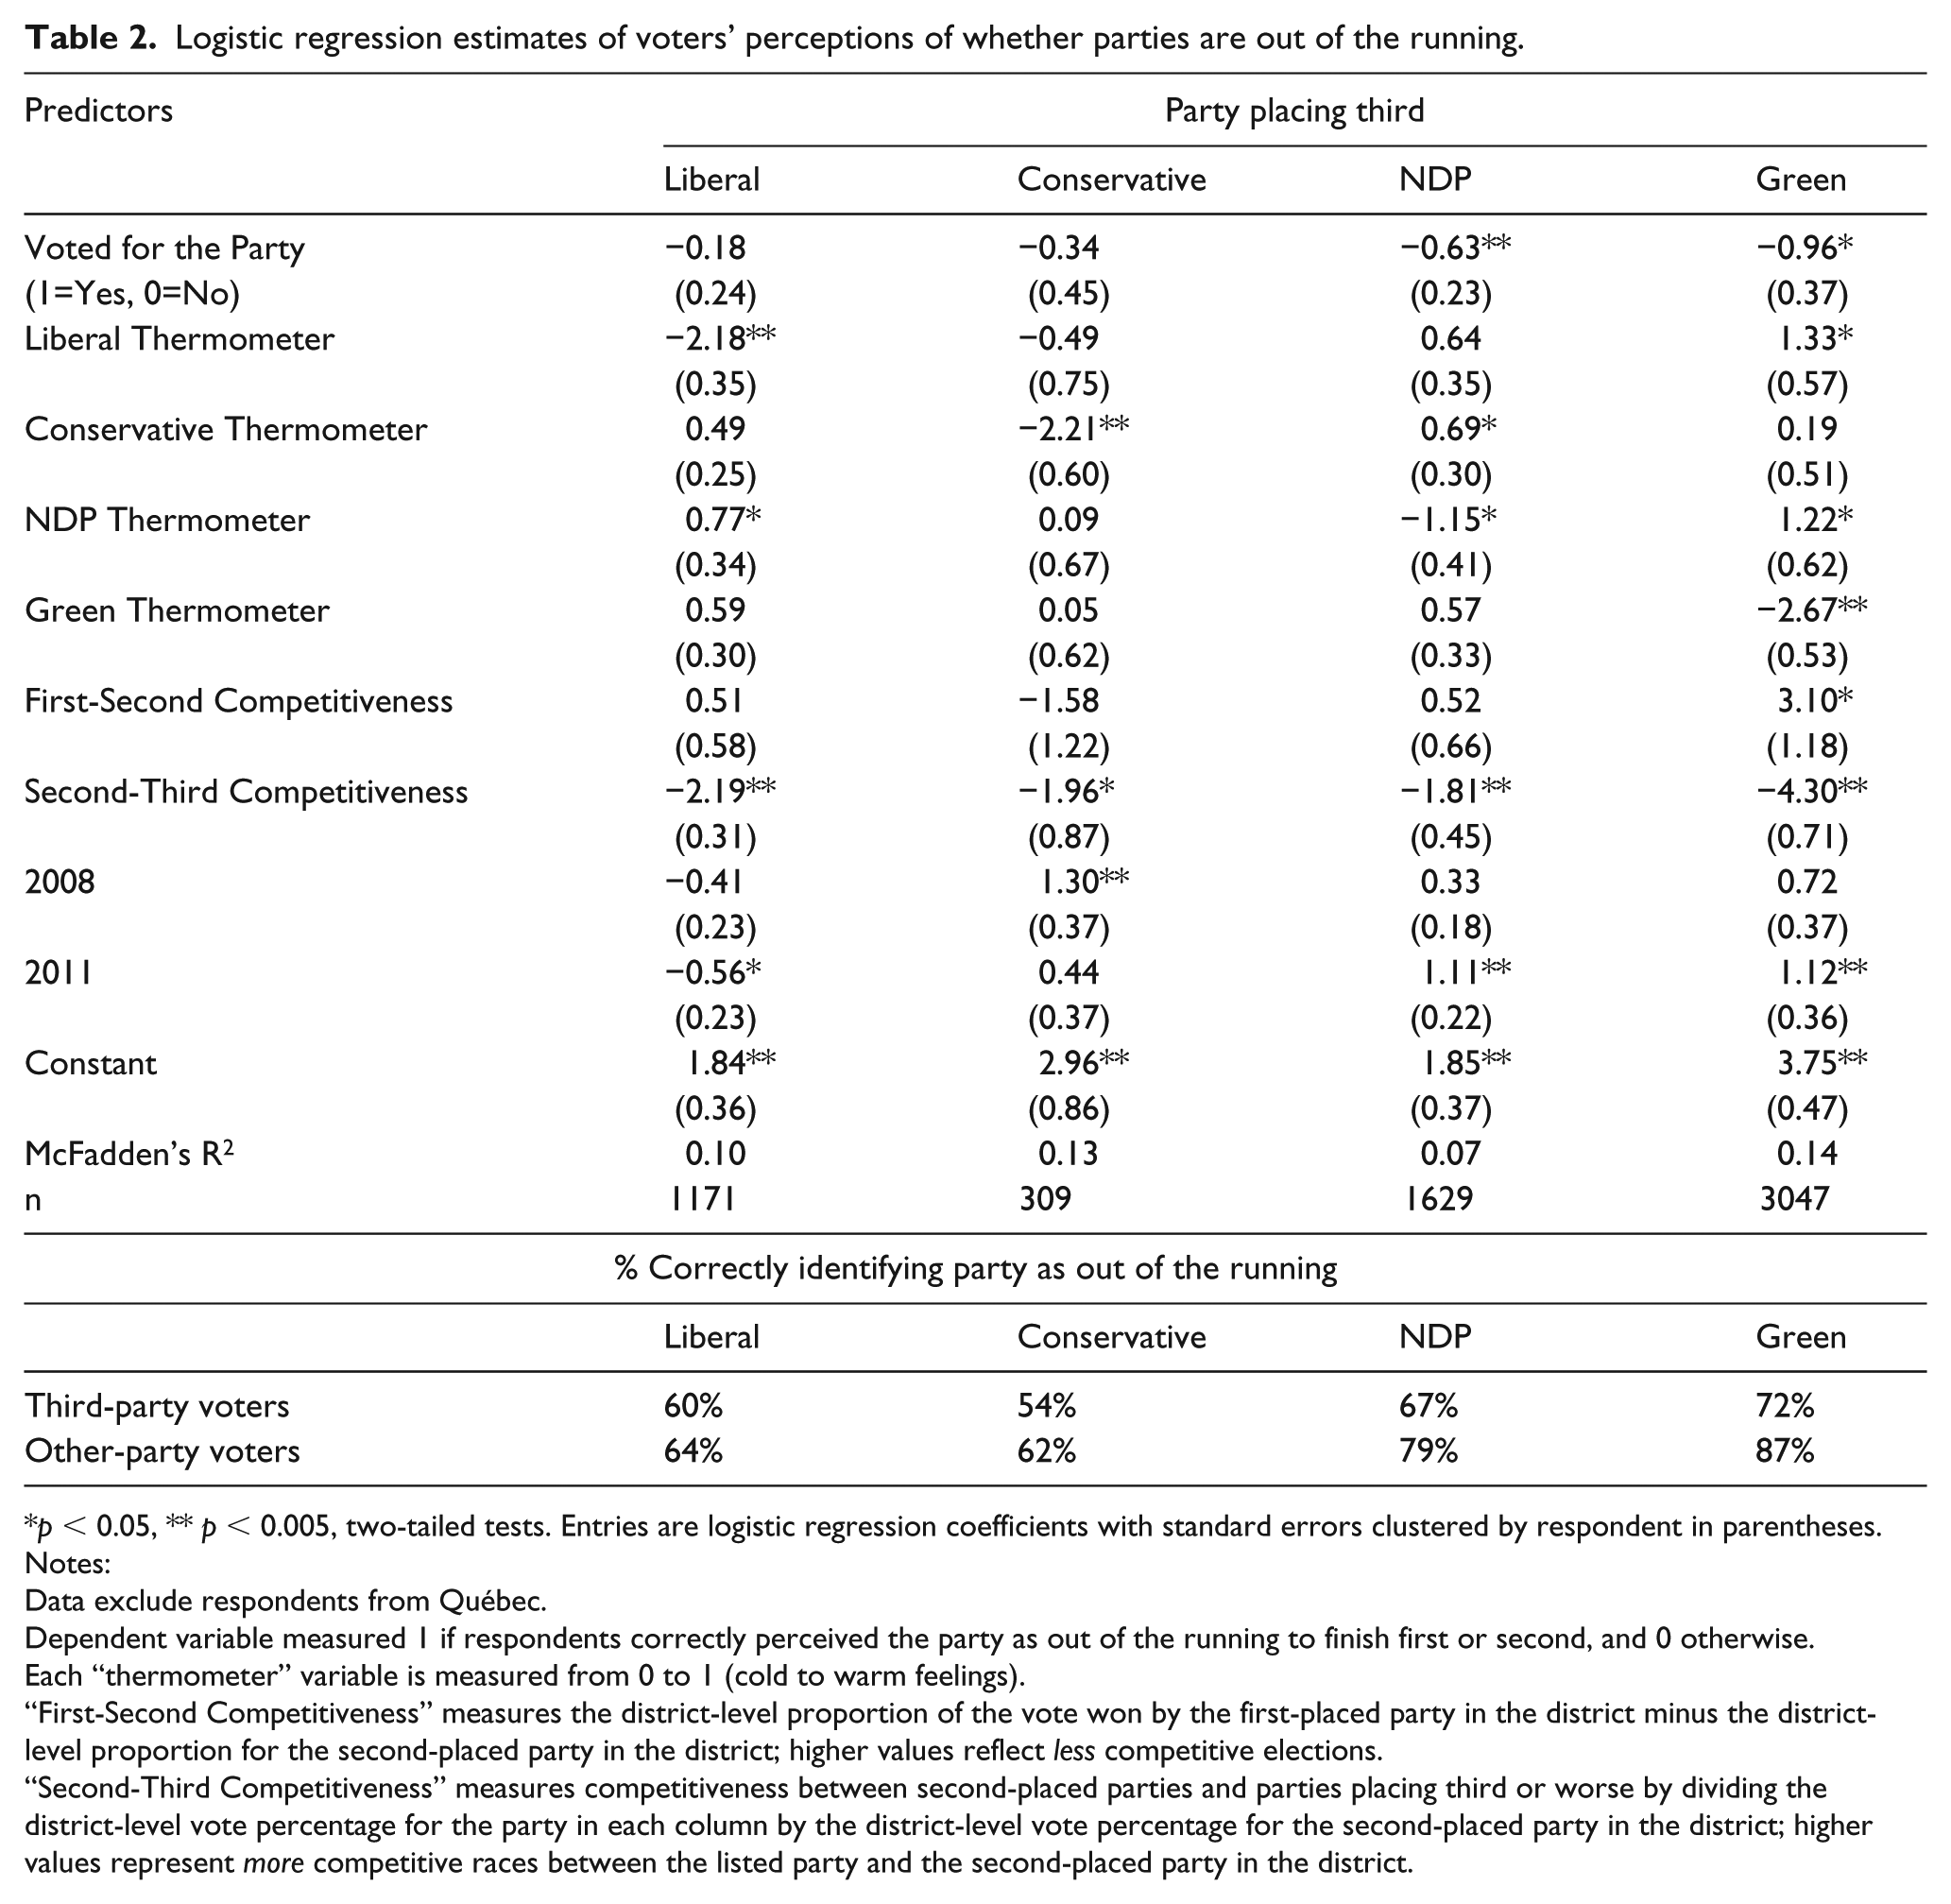
p < 0.05, ** p < 0.005, two-tailed tests. Entries are logistic regression coefficients with standard errors clustered by respondent in parentheses.
Notes:
Data exclude respondents from Québec.
Dependent variable measured 1 if respondents correctly perceived the party as out of the running to finish first or second, and 0 otherwise.
Each “thermometer” variable is measured from 0 to 1 (cold to warm feelings).
“First-Second Competitiveness” measures the district-level proportion of the vote won by the first-placed party in the district minus the district-level proportion for the second-placed party in the district; higher values reflect less competitive elections.
“Second-Third Competitiveness” measures competitiveness between second-placed parties and parties placing third or worse by dividing the district-level vote percentage for the party in each column by the district-level vote percentage for the second-placed party in the district; higher values represent more competitive races between the listed party and the second-placed party in the district.
In keeping with previous research (Blais, 2002; Blais and Turgeon, 2004), the results also show that voters were particularly less/more likely to perceive a party as out of the running if they held strong preferences for/against parties. As seen in Figure 1, the results also suggest closer contests between each third-or-worse-placed party and the second-placed party in the district decreased the probability that respondents correctly perceived a party as being non-viable. That said, Figure 1 also shows that it is only in close races where a majority of third-party voters failed to recognize when a party was out of the running. Thus, sizable shares of each party’s voters cast their votes despite knowing the party had little chance of winning their district.

Predicted probabilities of correctly perceiving parties placing third or worse among respondents voting for the party.
Conclusion
The analysis above suggests a significant share of third-party voters in Canada recognize these parties had little chance of winning. This stands in contrast to previous research emphasizing the importance of (in)accurate information for explaining why so many voters in FPTP systems support third-placed parties. Though inaccurate information explains some of the non-tactical behavior observed in FPTP systems, the findings above suggest much of this behavior remains to be explained. As a result, more research focusing on the other assumptions required for tactical voting—that voters are short-term instrumentally rational and not too strongly attached to their parties to vote tactically (see Cox, 1997: 76–79)—is needed. As part of this effort, future research examining non-tactical behavior in other countries is needed to demonstrate the generalizability of the findings. While Canadian third parties have long attracted considerable support, the fact significant third parties have persisted in other FPTP systems (namely, the United Kingdom, and New Zealand prior to 1993) suggests the lessons learned here may be generalizable.
Supplemental Material
Final-Appendix-RAP – Supplemental material for Do third-party supporters recognize their party is out of the running? Evidence from Canada
Supplemental material, Final-Appendix-RAP for Do third-party supporters recognize their party is out of the running? Evidence from Canada by Christopher D. Raymond in Research & Politics
Footnotes
Declaration of Conflicting Interest
The author(s) declared no potential conflicts of interest with respect to the research, authorship, and/or publication of this article.
Funding
The author(s) received no financial support for the research, authorship, and/or publication of this article.
Supplemental materials
Notes
Carnegie Corporation of New York Grant
This publication was made possible (in part) by a grant from the Carnegie Corporation of New York. The statements made and views expressed are solely the responsibility of the author.
References
Supplementary Material
Please find the following supplemental material available below.
For Open Access articles published under a Creative Commons License, all supplemental material carries the same license as the article it is associated with.
For non-Open Access articles published, all supplemental material carries a non-exclusive license, and permission requests for re-use of supplemental material or any part of supplemental material shall be sent directly to the copyright owner as specified in the copyright notice associated with the article.