
Abstract
Research on strategic voting in simple plurality systems has focussed largely on voters faced with three options. This is problematic, first because strategically minded voters may prefer candidates outside of the three leading contenders; second, they may consider voting for third (or worse) placed parties; and third, some voters might have more than one strategic option. We demonstrate that conceptualising strategic voting in terms of strategic voters restricts our ability to accurately answer important questions about strategic voting. We set out a new approach to strategic voting which identifies the strategic options available to voters in multiparty contests. We then examine the number, distribution and character of strategic options and strategic votes in four British general elections using data from the British Election Study. We find that across these four elections 7% of options open to voters could be considered strategic and more than one third of these were voted for, accounting for 11% of all votes cast.
Introduction
In both majoritarian and proportional electoral systems, citizens may or may not vote for their first preference party or candidate. Voting for non-preferred candidates is referred to as tactical or strategic voting when the decision incorporates candidates’ chances of being elected to the decision-making process. Strategic voting has been defined as “a vote for a second-preferred party (candidate) rather than for the first-preferred one, motivated by the perception that the former has a better chance of winning the election” (Blais and Nadeau 1996, 40; Alvarez and Nagler, 2000; Cain, 1978; Cox, 1997; Eggers and Vivyan, 2020; Fisher, 2004; Galbraith and Rae, 1989). 1
Previous research typically estimates that strategic voting accounts for anywhere between 5% and 20% of voting in simple plurality systems (Cain 1978; Fieldhouse et al., 2007; Alvarez and Nagler 2000; Blais et al., 2009; Fisher 2004a). 2 However, estimates of strategic votes as a percentage of all votes may be misleading because not all voters have an incentive and opportunity to vote strategically (Alvarez et al., 2006; Blais and Degan 2019; Blais et al., 2009; Blais and Nadeau 1996; Kiewiet 2013; Kselman and Niou 2010).
Yet, even where analysis is limited to voters with the opportunity to vote strategically, it is widely assumed that they are faced with only three options: a preferred option, a second choice and a least preferred option. This approach has been pursued largely because it makes the identification of strategic voting tractable: there are a small number of permutations in which the three candidates can be arranged, and only some of these permutations offer the potential for strategic voting (Kselman and Niou 2010). In most multiparty contexts, however, voters are not faced with such a simple three-way choice. In the UK General Election of 2024, for example, the mean number of candidates per constituency was 6.9. All 650 constituencies had five or more candidates, with 204 having eight or more (Harker 2024) and there has been a mean of at least five candidates per constituency at every UK general election since 1997 (Cracknell et al., 2025). As the number of options increases, identifying which permutations offer strategic potential soon becomes intractable. 3 A common solution is simply to treat alternatives beyond the leading three candidates as irrelevant (Kselman and Niou 2010). However, limiting the analysis to the leading three parties has important implications for the extent of strategic voting in multiparty contexts. Strategically minded voters may prefer candidates outside of the three leading contenders and ignoring preferences for minor parties is likely to lead to an under-estimation of strategic voting for major parties. For example, a voter who prefers a minor party might usually vote for a major party because the former rarely has a chance of victory. Even subjectively defined strategic voting (Heath et al., 1991) may overlook this type of strategic vote if the survey respondent has internalised voting for the major party as a sincere act. Moreover, in some circumstances, strategically inclined voters may consider voting for third (or worse) placed parties and may have more than one strategic option.
In a departure from the existing literature, in this article we propose a method for identifying all the possible strategic options available to voters in multiparty contests. We define a strategic option as any candidate who is not the first choice (‘preferred’) of a given voter, but who is better placed to defeat a less liked (‘opposed’) candidate than the first-choice candidate. We define strategic options according to each voter’s own assessments of a comprehensive slate of candidates’ chances of victory and utility, not only those of the leading three competitors.
Unlike existing voter-focused approaches, our strategic options approach benefits from making the dyadic voter-candidate (or party) pairs the base unit of analysis rather than the voter. 4 This reveals more about the nature of strategic voting in multiparty single-member plurality systems, including characteristics of candidates who are best-placed to gain from strategic voting, the extent of strategic voting amongst voters who have strategic options, and the circumstances under which strategic options are chosen. The major contributions of this article are (i) to introduce the concept of strategic options applicable in multiparty contests, based on voters’ assessments of all candidates; (ii) to provide a definition to allow identification of those options; and (iii) to empirically assess the number, distribution and character of strategic options and strategic votes in a single-member plurality electoral system. We draw on assessments of over 300,000 candidates from more than 60,000 voters across four general elections in Great Britain and find 11% of all votes were cast for strategic options, a considerably higher figure than the equivalent in a three-party analysis.
Strategic options: A definition
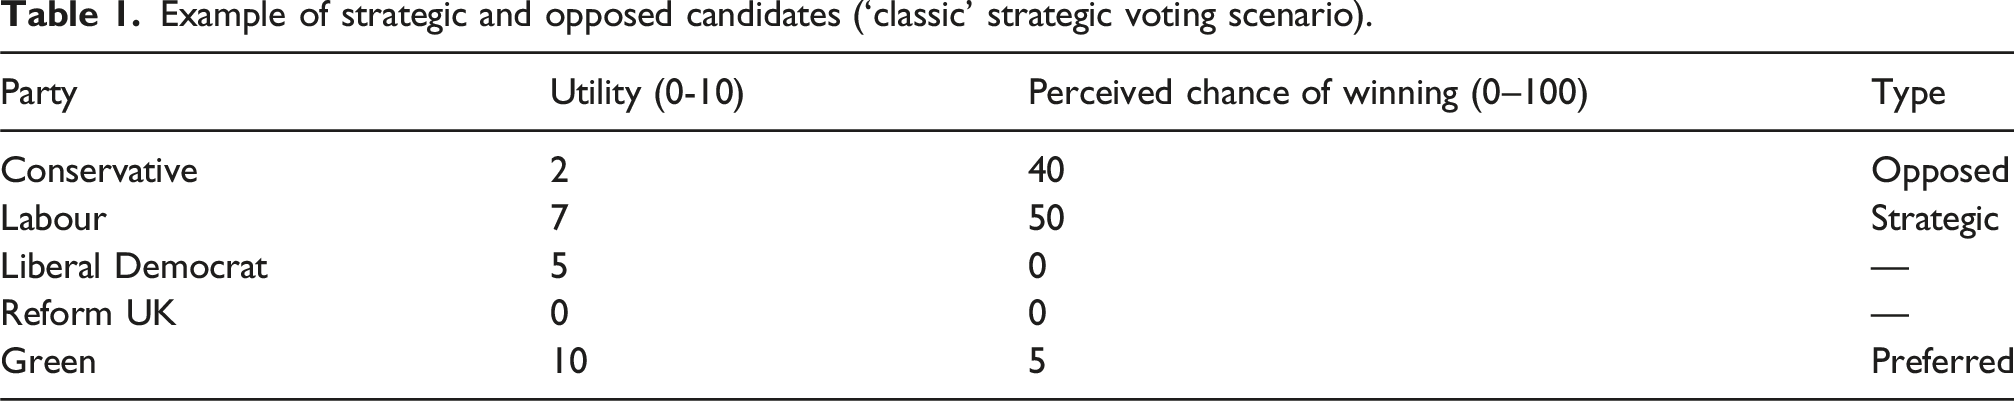
Strategic options are not the same as strategic votes. Following the logic of the calculus of voting (Riker and Ordeshook 1968) strategic voting is usually defined by the relative preferences for each candidate and the competitive situation in the contest (Fisher 2004a; Kselman and Niou 2010). With these two pieces of information, a strategic vote can be defined as a vote for the second preference party motivated by the perception that it has a better chance of winning than the preferred party (Blais and Nadeau 1996, 40). Strategic options, on the other hand, are candidates within each voter’s choice set which, if selected, would be consistent with that definition of strategic voting. Establishing motive is not necessary since the aim is only to identify those options which might be chosen for strategic reasons. Thus, a strategic option is a candidate that is not the first choice of a given voter, but which is better placed to defeat a less liked (or ‘opposed’) candidate than the preferred choice. The classification is a property of the dyadic voter-candidate observation (our base unit of analysis) rather than the voter.
Identifying a strategic option in three-party contests is straightforward, as it must always be the second most preferred party and, as Kselman and Niou (2010) demonstrate, a strategic option can exist in only three of the eight permutations of the rank ordering of competitiveness. However, in large multiparty contests, exhaustively enumerating every permutation to identify all possible strategic alternatives for every voter is intractable. One solution is to estimate the strategic incentive to vote for all candidates based on the comparison of expected utilities (Eggers and Nowacki, 2024; Eggers and Vivyan, 2020). All options with positive strategic incentives might then be considered strategic options. However, a significant drawback to this approach is that it requires voters to estimate – at least sub-consciously − the probability of their vote being pivotal in all possible pairwise head-to-head contests, basing their judgments on vote shares in the current or previous election (Eggers and Vivyan, 2020). 5
Our alternative approach is to set out the criteria which, with minimal assumptions, can be used to identify which candidates represent a strategic option to individual voters in multiparty contests. Rather than assuming that voters consider pivot probabilities, we assume that voters are ‘rationalistic’ (Alvarez and Kiewiet, 2009), concerned with the relative chances of each candidate winning − but not with being pivotal. That is, voters make choices in a way which is consistent with their ranked preferences and the tactical context as if their vote were pivotal. In other words, rationalistic voters consider both the chance that a candidate has of being elected and how much they like or dislike the candidate. Whereas the expected utility approach provides a means to calculate a scalar quantity representing the strategic incentive to vote for each candidate (Eggers and Vivyan, 2020), our approach determines theoretically which candidates represent a strategic option for each voter using voters’ perceptions of the strategic situation and utilities for each party. This is akin to Kselman and Niou’s (2010) typology of strategic voting but extended to a multiparty context.
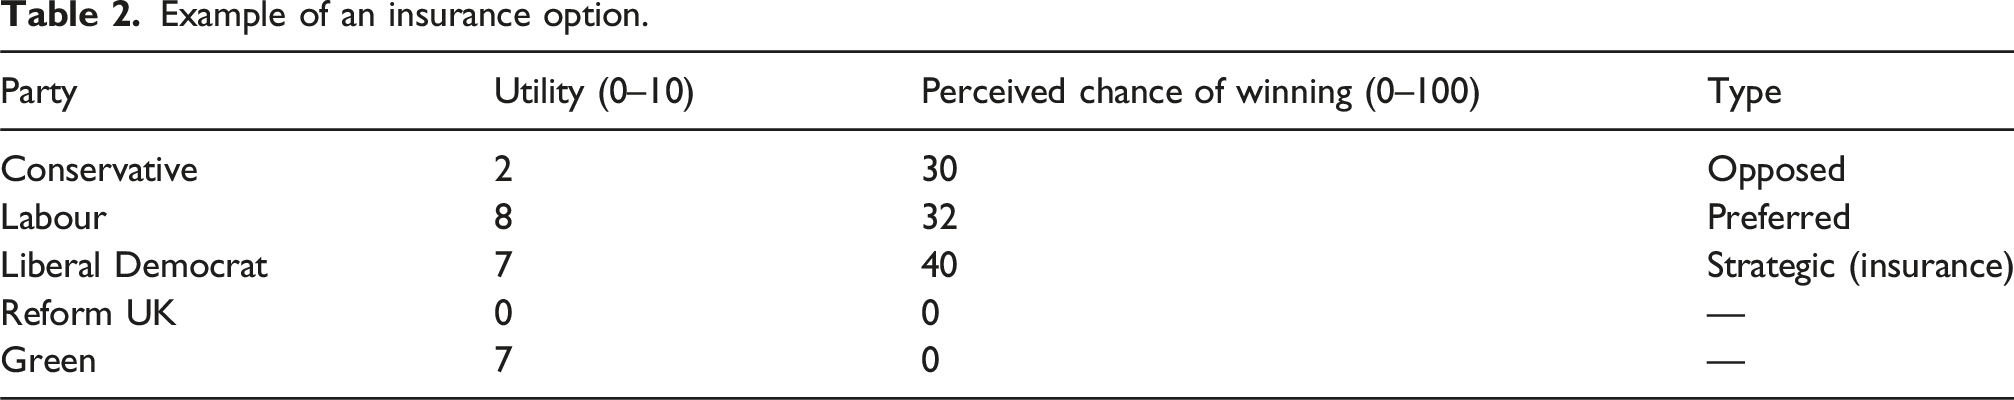
As noted above, of the eight permutations of expected final rankings in a three-party contest, Kselman and Niou identified three which could be considered strategic. In two of these the preferred candidate is placed third, trailing the second and third preferences. These meet the classic definition of strategic voters which is restricted to voters whose preferred candidate is expected to finish in last place (Ordeshook and Zeng 1997; Alvarez et al., 2006; Kselman and Niou 2010, 231). However, following Blais and Nadeau (1996), Kselman and Niou further demonstrate that a third permutation should be considered strategic: when the first preference candidate is expected to finish second behind another option, which itself is preferred to the option in third place, a strategic voter may choose to vote strategically for the leading candidate to help ensure that the third-placed candidate is defeated. Although the voter’s preferred party is believed to have a higher chance of winning than the third-placed party, a vote for the leading party might be regarded as insurance against the less-preferred outcome – i.e. the more disliked third-place party coming from third place to defeat both the leading party and the preferred party (Kselman and Niou 2010, 234).
Our definition of strategic options includes both ‘classic’ and ‘insurance’ strategic voting but extended to multiparty contests. We include both types because, as well as being established as theoretically valid in the established literature (Blais and Nadeau 1996; Kselman and Niou 2010), both are consistent with our general principle that a strategic option is one which is not the first choice of a voter but is better placed to defeat a less preferred candidate. Contrary to most existing approaches, our definition of strategic options raises the possibility that strategic voters might choose their third or even fourth most preferred option. Unlike in the three-party scenario, in a multiparty context we cannot assume that only second-choice parties represent strategic options, making their identification more complex. To identify the strategic options for each voter we need to know the relative preferences of each pair of candidates and their relative perceived competitiveness. With this information, while it is simple enough to identify the most preferred candidate, identifying all candidates that are better placed to defeat a less-liked candidate requires us to first identify who those ‘opposed’ candidates are.
Opposed candidates
Following the logic of the ‘calculus of voting’, previous research on strategic voting suggests that, in a three-party contest, a strategic voter will choose the second-preference candidate when it has a better chance of beating the least-preferred candidate (Black 1978; Fisher 2004b; Kselman and Niou 2010). The same underlying logic applies in the multiparty scenarios except that the candidate that the strategic voter seeks to defeat might not be the third-preference party, but could be the fourth, fifth or worse. In a multiparty context, therefore, strategic voting requires the existence of one or more candidates who are better placed to defeat any lesser liked candidate than is the first-choice candidate. We refer to such candidates as an “opposed” candidates because, by voting for another non-preferred (strategic) option, a strategic voter may help to prevent them from winning.
Example of strategic and opposed candidates (‘classic’ strategic voting scenario).
Example of an insurance option.
Formal definition
The criteria for being a strategic option are as follows: (i) The party is (ii) The party: (a) Has a higher perceived chance of winning than the preferred party, AND (b) The party is preferred to another (opposed) party that is also ahead of the most preferred party; OR (iii) The party is in first place and preferred to the third placed party, and the most preferred party is in second place.
Additionally, because our classification potentially allows multiple options to be considered strategic, in some cases some strategic options will be inferior to others. An option is considered inferior if there is another strategic option that is better in both respects — that is both more preferred and more likely to win. 6 Inferior strategic options are not classed as strategic options in our definition.
It is important to note that because we know nothing about the importance that respondents attach to the magnitude of differences in candidates’ competitiveness and utility, nor the level of certainty they attach to their estimates, this definition uses only their rank ordering, not their magnitude. We thereby avoid arbitrary judgments about how far ahead or liked a party must be to be considered a strategic option. Whether a particular strategic option is chosen is likely to be related to the magnitude of relative competitiveness and utility, but this is an empirical question (which is explored below) and not part of the definition.
From strategic options to strategic votes
A strategic option is distinct from a strategic vote because it may or may not be chosen by the voter: that is they are the subset of all options available to each voter that meet our criteria. The extent of strategic voting at any election is determined by the mean number of strategic options open to voters and the rate at which these are converted to votes. Variations in relative viability and utility mean that not all strategic options are equally attractive, which affects the conversion rate.
It is possible to measure empirically how conversion varies according to relative utility and viability, and hence the attractiveness of strategic options. Previous research has demonstrated that, when facing a strategic context in the three party scenario, a strategic vote “depends on the comparative utilities associated with the candidates and the relative probabilities of outcomes” (Abramson et al., 1992, 56). Blais and Nadeau (1996) found that, faced with a strategic situation, voters are more likely to vote strategically if there is a larger difference in utility of the second and third choice parties (relative to the first and third); the greater the lead of the second-choice party over the preferred party; and the closer the race between the second and third choice parties. Notably, Blais and Nadeau (1996, 48) explicitly acknowledged that the major limitation of this analysis was that it considered only three-party situations and was therefore likely to under-estimate the true extent of strategic voting. Our analysis corrects this omission, but we can use their insights to help identify the vote-winning qualities of strategic options.
Based on the above definition of strategic options, we address two empirical questions: RQ1 How many strategic options are available to British voters, and how do these options vary by party and political context? RQ2 What proportion of voters casts their ballot for one of their strategic options, and what explains any variation in the conversion of strategic options into strategic votes?
Data and measurement
We use 12 waves of the British Election Study Internet Panel (BESIP) (Fieldhouse et al., 2025) including three waves of data collected around each of the general elections of 2015, 2017, 2019 and 2024. For each of the four elections, we use all three observations for each respondent: one from the wave collected before the campaign proper starts (the pre-wave, referred to as t1); one from the wave collected during the campaign (the campaign wave, t2); and the third from the post-election wave (t3). 7
The data are organised into long format such that each case represents an option nested within an individual respondent nested within an election year. The key variables of interest are the voter-defined estimated win chances of each party in the respondents’ constituencies and the ‘like-scores’ for each party. These alternative specific variables are measured at the level of the voter-candidate (or option). Parties included in the array of options are limited only by the availability of these alternative specific variables in the BESIP: the Conservative Party, Labour Party, Liberal Democrats, UKIP, Brexit Party, Reform UK, Greens, Scottish National Party (SNP), and Plaid Cymru. Data for responses about parties which did not have a candidate in the respondents’ constituency were dropped. Because data were not collected for UKIP, Brexit Party, or Reform UK at all elections, and the parties are very closely related (they effectively evolved from UKIP to the Brexit Party to Reform UK), we combine the data for these parties. 8
The full combined dataset across all four elections includes 85,084 respondents and 405,783 options. Cases with missing turnout data at t3 and fewer than three options with valid data 9 were dropped – as it is not possible to assess strategic voting when there are fewer than three options with valid data, leaving an effective sample of 75,679 respondents and 353,142 candidates. Of these 68,763 reported having voted for or against one of 321,920 candidate observations. The number of options per respondent ranged from three to six, the modal number of options being five (58% of respondents). Standard BES respondent weights were used to correct as far as possible for differences in representation of different groups and these were adjusted to account for different sample sizes for the different elections.
To define strategic options, it is necessary to measure the competitiveness of each option (Abramson et al., 2018; Blais and Degan, 2019). This is often approximated using either the relative vote shares of different candidates at the current (Eggers and Vivyan, 2020) or previous election (Kiewiet 2013). What really matters, however, is how each voter expects each candidate to perform (Blais and Nadeau 1996). While it is possible to estimate the expected vote shares of candidates from previous (or ex post) vote shares, it is necessary to make several assumptions about voter uncertainty (Eggers and Nowacki, 2024; Eggers and Vivyan, 2020). Moreover, vote shares are unlikely to be a reliable guide to how individual voters perceive the competitive situation for several reasons. First, most voters may not be fully informed about the shares of each party in the previous election, nor have an accurate picture of the likely result in the forthcoming election. Moreover, this uncertainty varies from voter to voter. Second, voters are likely to consider a range of factors when considering the likely performance of each candidate, including recent opinion polls, talking to fellow voters, local campaign activity or contact, media campaigns, or simply personal preferences via projection effects (Blais and Bodet 2006; Mellon 2021; Fisher et al., 2024). Rather than constituency results, we therefore use a direct measure of individual voter perceptions of parties’ chances of winning in the local constituency. In each wave of the BESIP, respondents were asked: “how likely is it that each of these parties will win the General Election in your local constituency?” on a scale of 0–100 where zero is ‘very unlikely to win’ and 100 is ‘very likely to win’. These scores do not necessarily sum to 100 across parties – and are not therefore interpretable as probabilities – but do quantify the respondent's perception of the candidates’ relative chances of winning. For the most part, we are concerned with the rank order of parties, but where the scalar quantities are used, they are rescaled so that each respondent's scores sum to 100 (see below). Where parties are tied, they are treated as being ranked equal.
Defining strategic voting also requires us to rank the parties in preference order and as noted above, unlike in three party contest, strategic options in multiparty contests may be ranked third or lower in terms of utility. Voter preferences might derive from many different factors, such as policy preferences, perceived competence, ideological position, opinions about party leaders and so forth (Fisher et al., 2018, 550). However, for the purpose of identifying voter preferences, it is often assumed that these multifaceted attitudes can be summarised as a general level of utility − measured by a thermometer or like score for each candidate or party − which can then be converted into a (ranked) preference (Blais and Nadeau 1996; Gidron et al., 2022). Like much previous research (Abramson et al., 1992; Blais and Nadeau, 1996; Eggers and Vivyan, 2020) we therefore use ‘like-scores’ to determine the parties’ utility ranking. 10 In each wave, the BESIP asks: “How much do you like or dislike each of the following parties?” with responses scored on a 0-10 scale where 0 is strongly dislike and 10 is strongly like. As noted above, in British constituencies there are typically at least five candidates, and often more. While the BESIP does not have data on all independent candidates, like scores are typically available for up to six parties.
Results
How common are strategic options?
Percentage of strategic options in the campaign wave, by year (respondent level, N = 68,888).
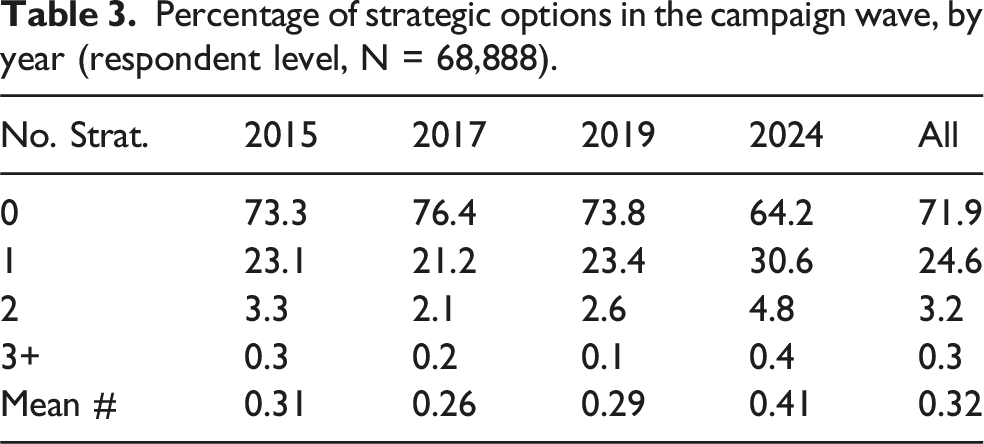
While Table 3 is informative it does not tell us how common strategic options are relative to the total number of options available to voters. Figure 1 shows the mean percentage of all options which are defined as strategic options by year (at the voter-option level). On average across all years, 6.9% of all options could be considered strategic, varying from 6% in 2017 to 8.5% in 2024. Strategic options as proportion of all options by year (T2, option level, N = 353,142).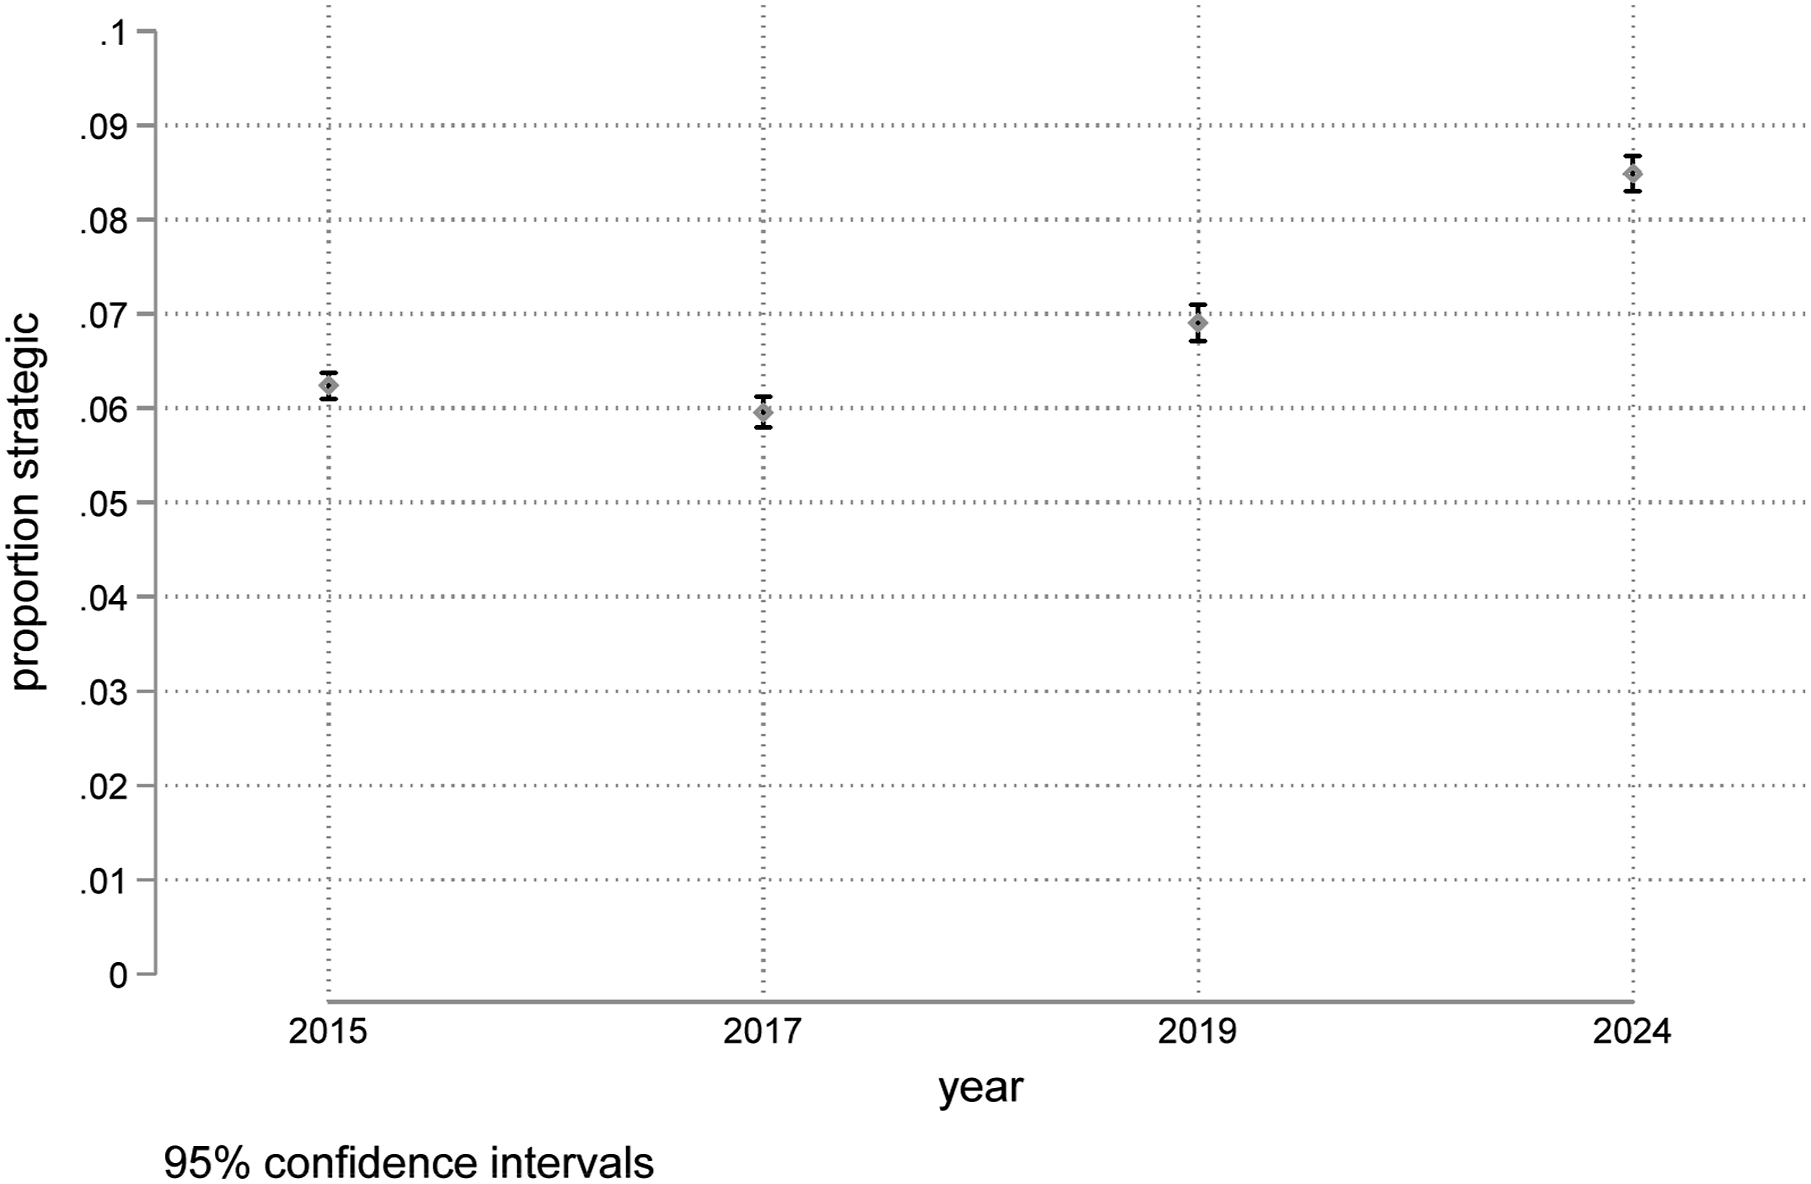
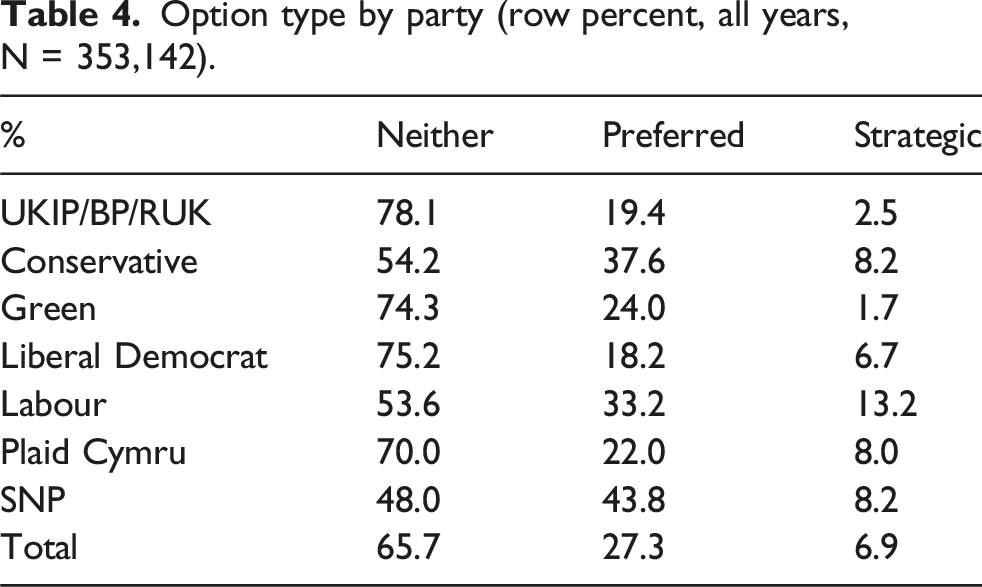
Strategic options are not equally spread across different parties: they tend to be candidates from larger, more popular parties. By definition, to be a strategic option, a candidate must be viable or at least more viable than the first-choice party. Thus, strategic options tend to be expected to be more likely to win than either sincere options or parties which fall into neither category. Overall, 41% of all strategic options across the four elections were the party deemed to be most likely to win in the constituency. However, 11% of strategic options are candidates in third place or lower, a possibility excluded in research which considers only the leading three parties (see supporting information, Table S2). 13 Unlike most existing research, we classify these as strategic options because they meet our criteria: they are better placed to defeat a less-liked candidate than is the preferred candidate.
Option type by party (row percent, all years, N = 353,142).
Voting for strategic options
As the concept of strategic options rests on voters’ preferences and ratings of the parties’ chances of winning, not their inclination to vote strategically, being a strategic option does not necessarily translate into strategic votes. Previous work has estimated the proportion of people who vote strategically when given the opportunity to do so varies from between approximately 30% and 60% (Alvarez et al., 2006; Blais and Nadeau 1996; Tromborg 2023). Overall, we find that 35% of strategic options were voted for, compared with 66% of preferred options and only 3% of all other options (Table S5). This conversion rate varies from a low of 21% in 2015 to a high of 46% in 2019.
Together, the number of strategic options and the conversion rate determine the rate of strategic voting at each election at the voter level. Figure 2 (lower panel) shows the proportion of all votes which were cast for a strategic option at each election. Overall, we find that across the four elections, 10.9% of all votes were cast for strategic options and that strategic voting has increased election-on-election since 2015 when only 6.5% of voters voted strategically, peaking in 2024 at 14.7%, an election which was considered especially conducive to strategic voting (Griffiths et al., 2026; Miori and Green, 2025). If we restrict the analysis of strategic voting to those with at least one strategic option (upper panel), then the rate of strategic voting increases considerably (since only a quarter of voters have any strategic options). Overall, among electors with an opportunity to vote strategically, 39% did so, although this ranged from as few as 25% in 2015 to 51% in 2019.
15
The estimate is similar to previous estimates of strategic voting among those with the opportunity (Alvarez et al., 2006; Blais and Nadeau 1996). Proportion of voters choosing a strategic option among (a) voters with a strategic option (N = 19,594) and (b) all voters (N = 68,763).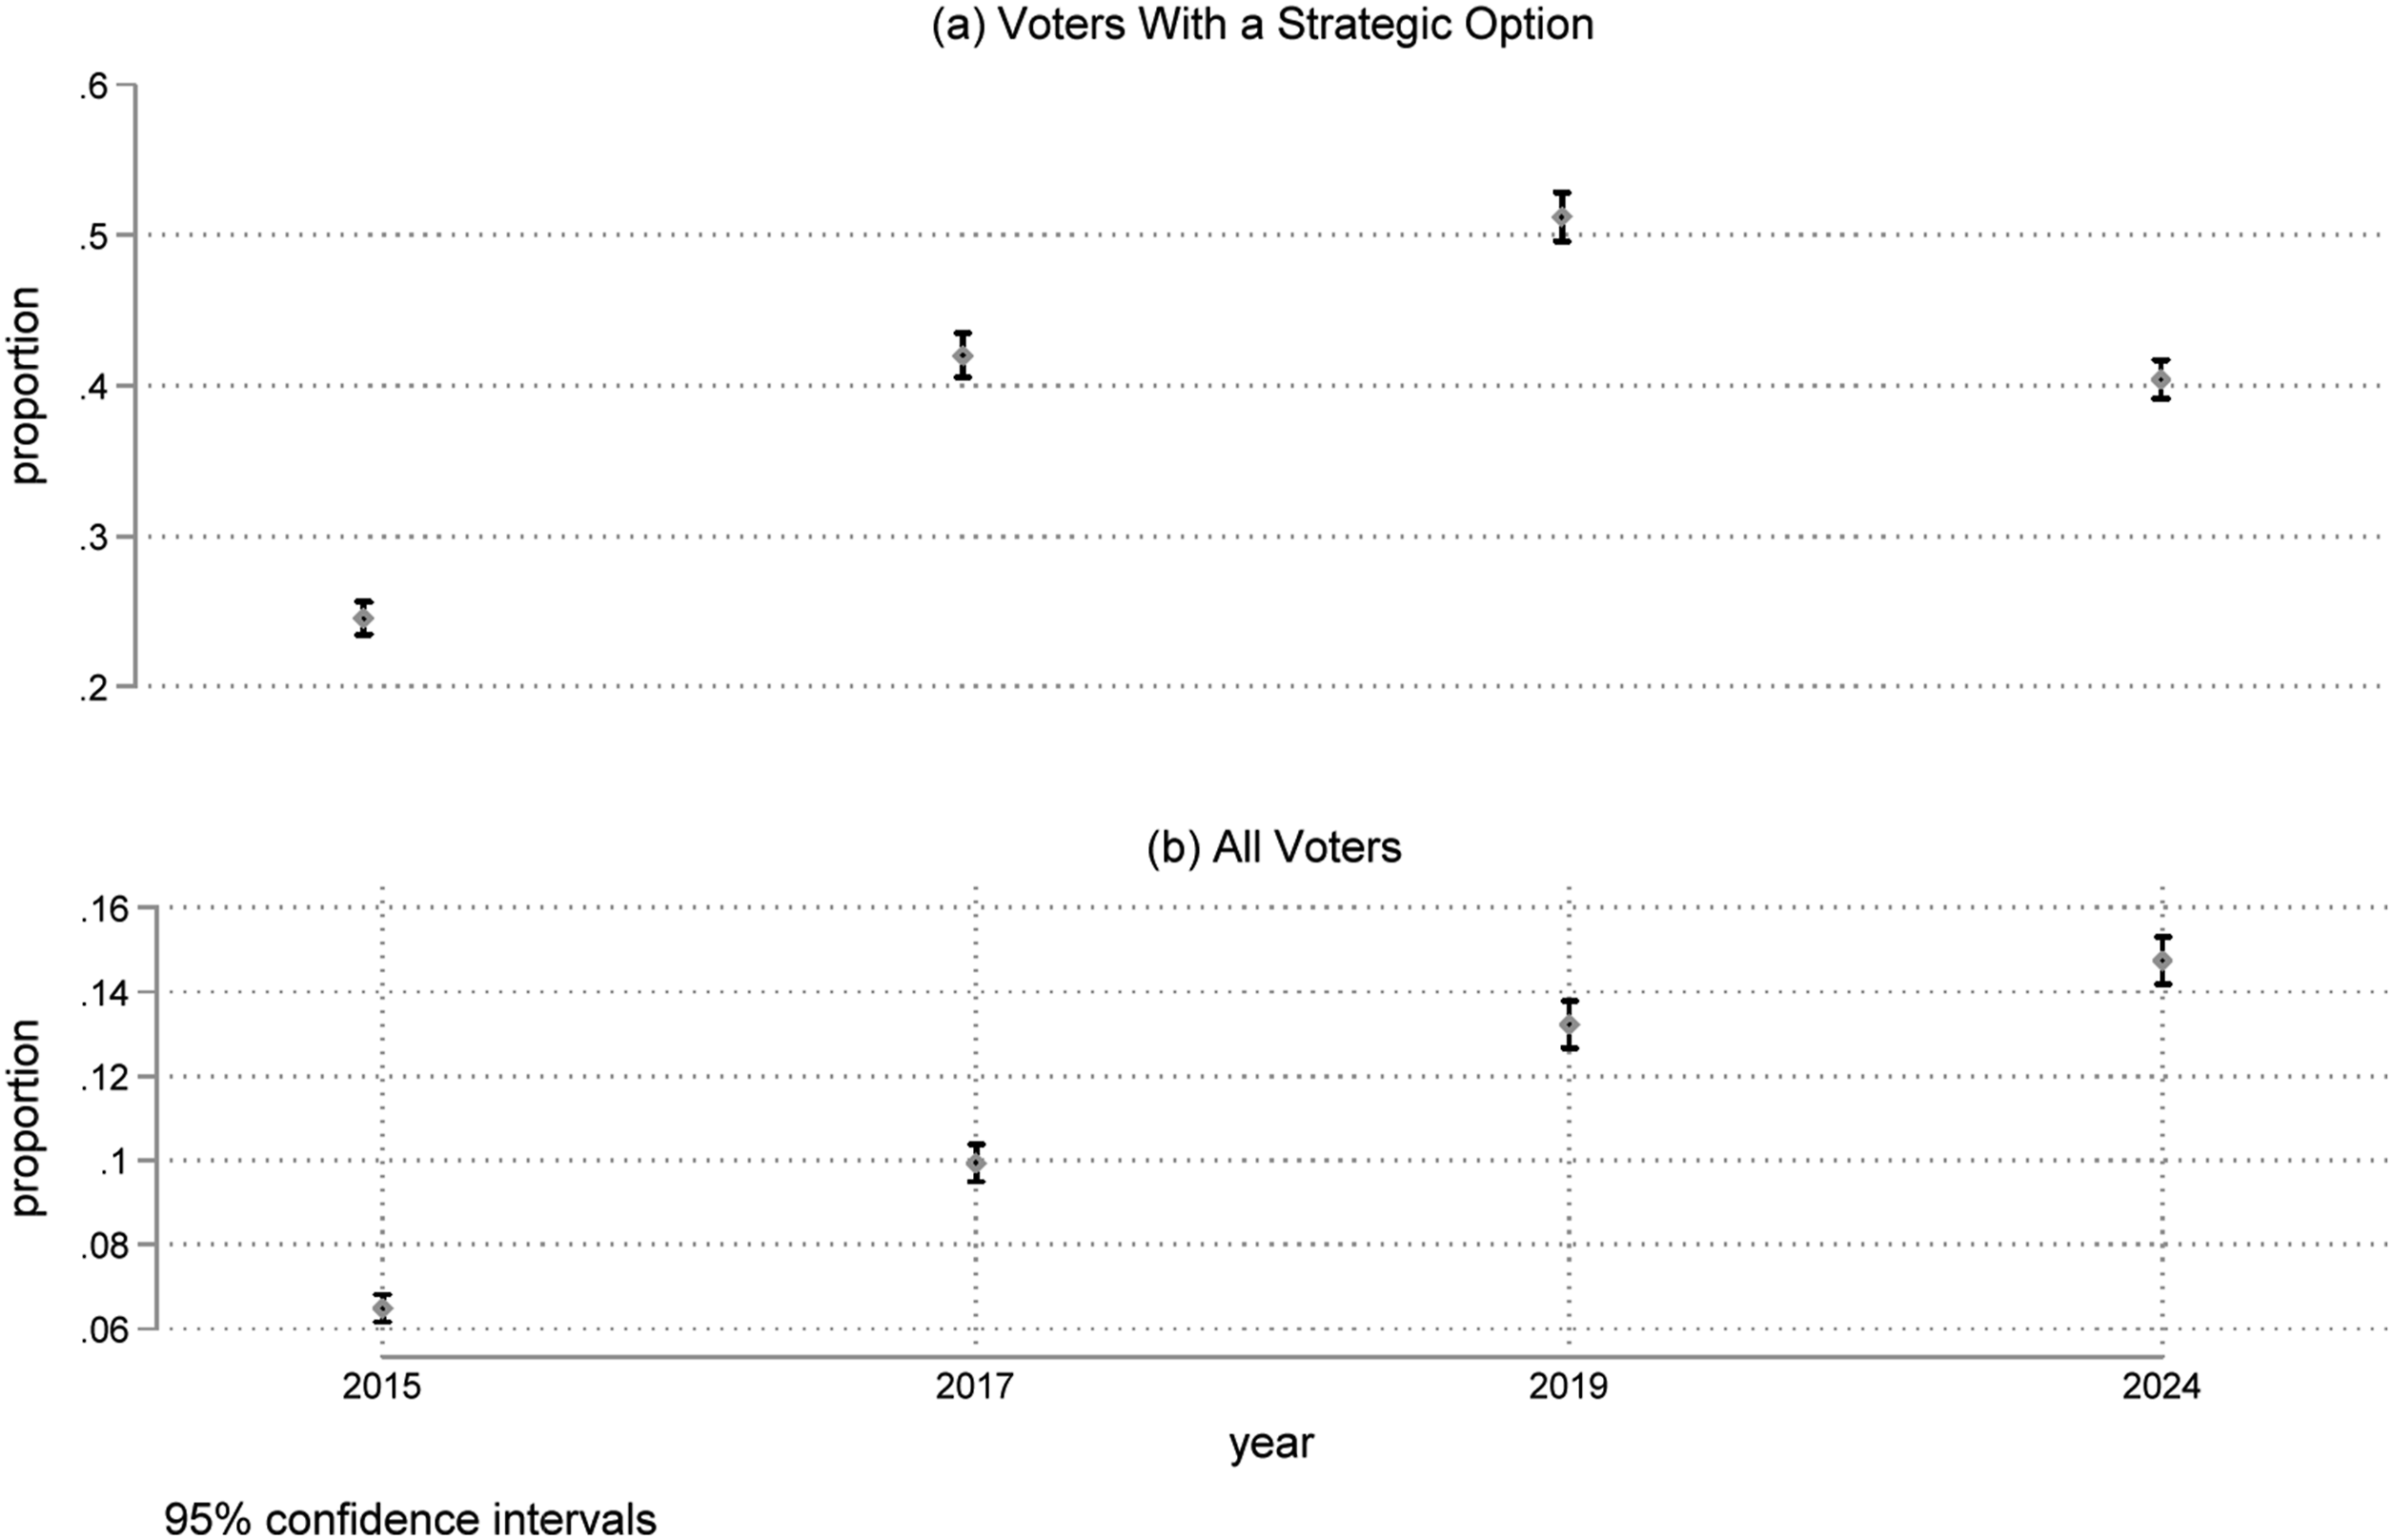
While strategic options are converted to votes in around one in three instances, parties that are most likely to be strategic options are also the parties which are most likely to gain from strategic voting. Labour has consistently been the largest recipient of strategic votes, winning the support of a mean of 55% of voters who voted for a strategic option across the four elections, followed by the Conservatives with 23% and the Liberal Democrats with 17% (Supplemental Material Table S7). Conversely, smaller parties are much more likely to be deserted for strategic reasons. Nearly half of all strategic voters (48%) really preferred the Greens, while 16% preferred UKIP/Brexit/Reform and 20% preferred the Liberal Democrats but did not vote for them. By way of contrast, only 6% and 8% preferred the Conservatives and Labour respectively (Table S8).
Impact on measurement of the extent of strategic voting
The multiparty approach to identifying strategic options should theoretically increase estimates of strategic voting because it includes voters whose first preference is for parties beyond the leading three. But how much difference does this make? We recreated an equivalent dataset and identified strategic options after removing all cases relating to options beyond the three leading parties in the constituency, thereby mimicking the conventional approach of estimating strategic voting in a three-candidate contest. This reduced the sample of respondents to 71,770 and the number of options to 215,310. Based on this restricted sample, 17.5% had a strategic option (compared to 28% in the multiparty version) and a third of these voted for that strategic option (compared to an equivalent rate of 39% in multiparty analysis). Across all four elections, of all those voting for any of the three leading candidates, 5.7% voted strategically, and this varied from 3.3% in 2015 to 9.1% in 2024.
16
Figure 3 shows the percentage of voters who voted strategically in the multiparty definition only, under both definitions and in neither.
17
We see that consistently around half of all strategic votes are detected by the three-party analysis. The primary reason for this is that – as noted above – in a large proportion of cases, the preferred party of strategic voters is a smaller party which is much less likely to be among the three leading parties in the constituency and hence is excluded from the three-party analysis. Percent of cases classed as strategic voting when defined using multiparty strategic options and the three-party approach.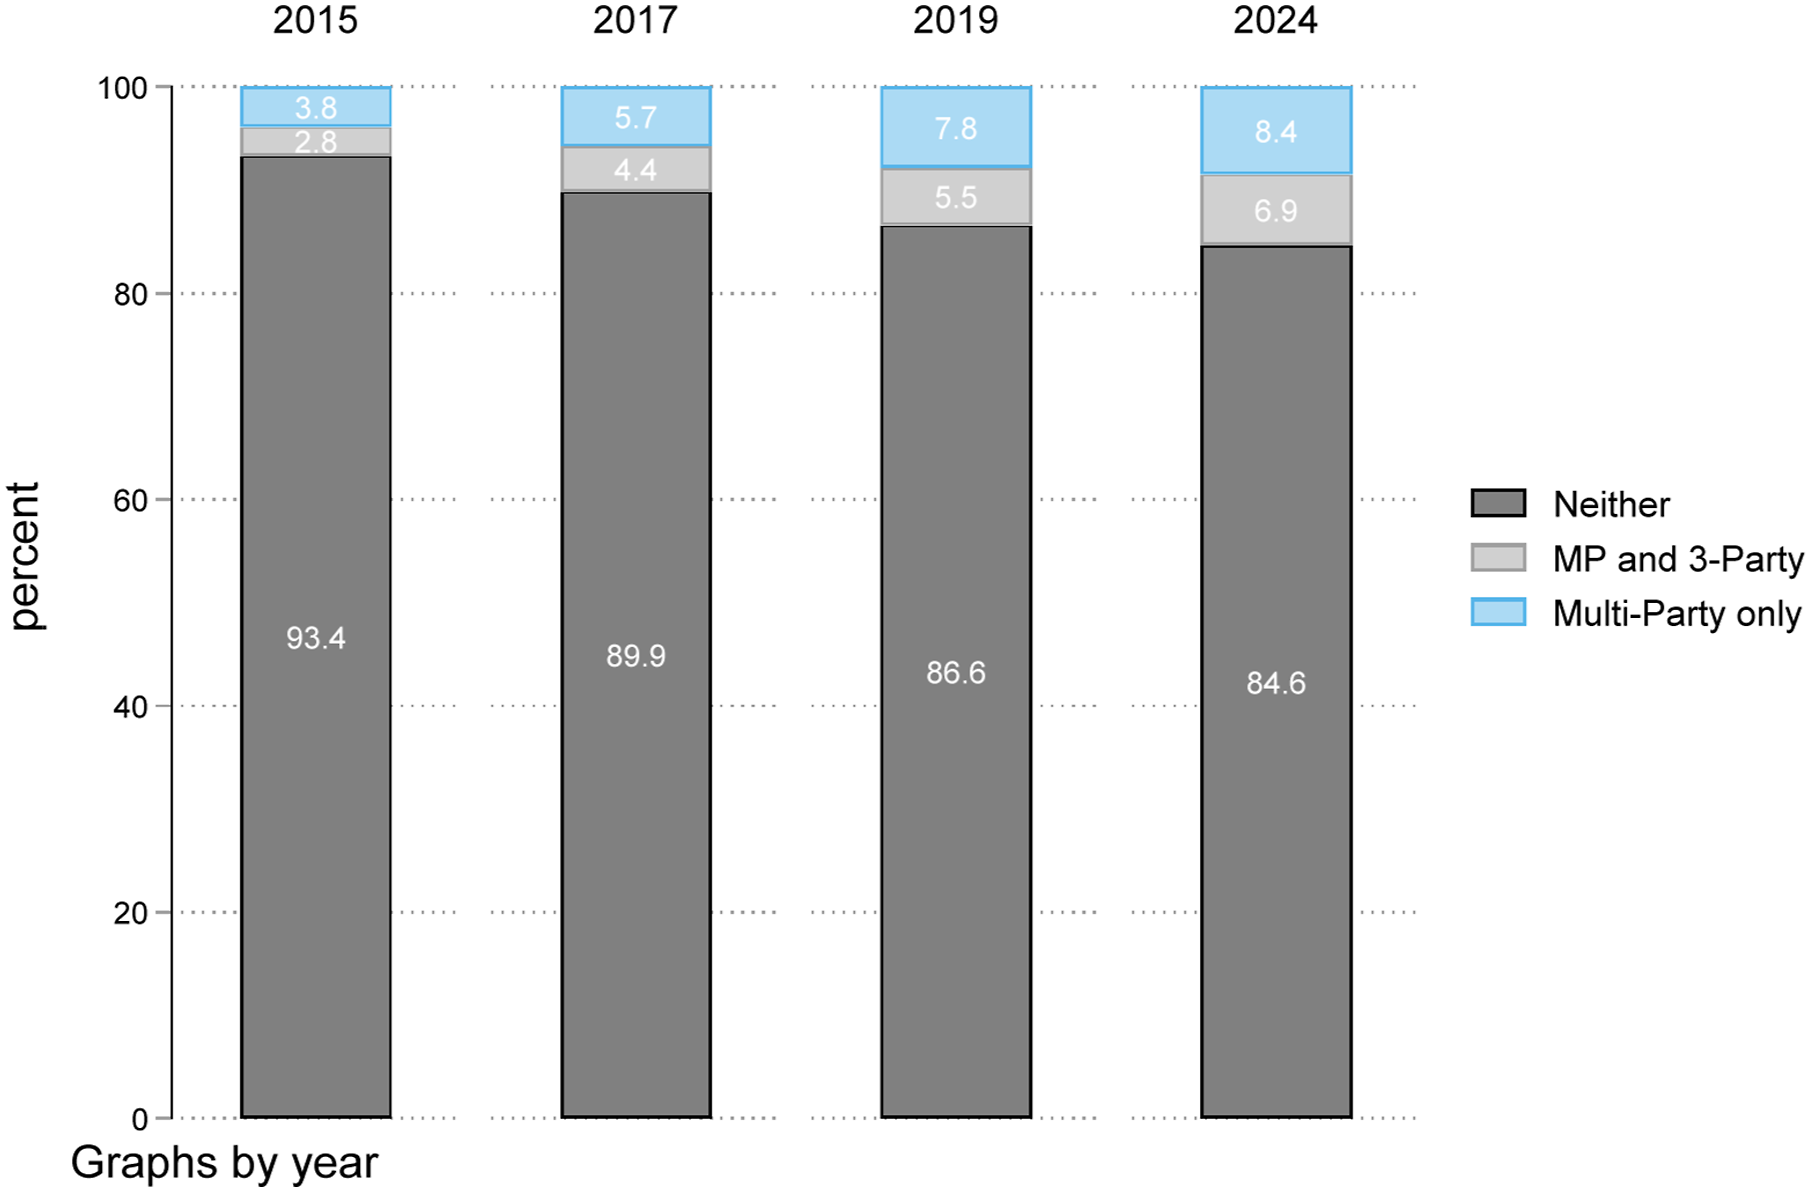
What makes an attractive strategic option?
Our classification of options provides a simple indicator of whether a candidate might be considered a strategic option by any given voter. To understand why some strategic options are more likely to be converted into strategic votes than others we need to compare the relative strategic attractiveness of those options to voters. To do this we extend the three-party model of strategic voting introduced by Abramson et al. (1992) and adapted by Blais and Nadeau (1996) to the multiparty scenario. From our strategic options perspective, the likelihood of a strategic option being chosen depends on choice-specific factors including the relative utility and viability of alternative candidates. For reasons explained above the magnitude of relative utility and viability were not used to define strategic options, only the ranking. This means that some strategic options that meet the criteria may be stronger than others in terms of their potential for strategic voting. These choice-specific characteristics can therefore be used to describe the relative attractiveness or strength of strategic options.
The Blais/Nadeau model was specified for a three-party contest as follows (restricting the analysis to voters facing a strategic choice): P is the probability of voting strategically. u21 is the normalised utility difference between the second and third choice candidate.
18
e21 is the normalised difference in win chances between the first and second choice candidate. e(abs)32 is the absolute difference in win chance between the second and third choice candidate.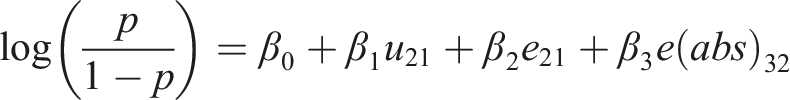
However, rather than relative utility scores and win chances being fixed by the values for the three leading parties, in our analysis, they are determined by the relative values for the target party (i.e. the party under consideration) and the opposed party.
19
Table 5 (Model 1) shows coefficients for the equivalent model used by Blais and Nadeau (1996, 47) applied to the three-party restricted data as discussed above.
20
The results indicate that the pattern of strategic voting is remarkably similar across the four UK elections to the Canadian case studied by Blais and Nadeau. Model 2 extends this to all strategic options in our dataset. To reflect the additional complexity of the multiparty situation, Model 3 adds controls for the number of strategic options and a dummy variable to indicate if the preferred party leads the opposed party (i.e. insurance options as described above). Model 4 limits the analysis to the best strategic option for each individual respondent so that every observation represents a unique voter.
21
The models are restricted to strategic options. Thus, our equation is: p is the probability of voting for the candidate. uto is the normalised utility difference between the target and the opposed candidate. etp is the normalised difference in win chances between the target and preferred candidate. e(abs)to is the absolute difference in win chance between the target and opposed candidate. son is the number of strategic options (represented by dummy variables). Logistic regression model of vote outcome for strategic options (all elections). Standard errors in parentheses, *p < 0.05, **p < 0.01 (robust SE clustered by respondent).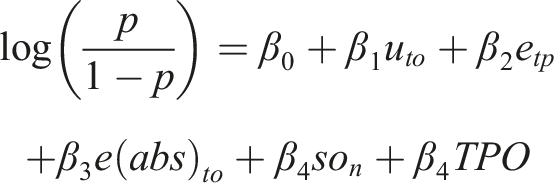
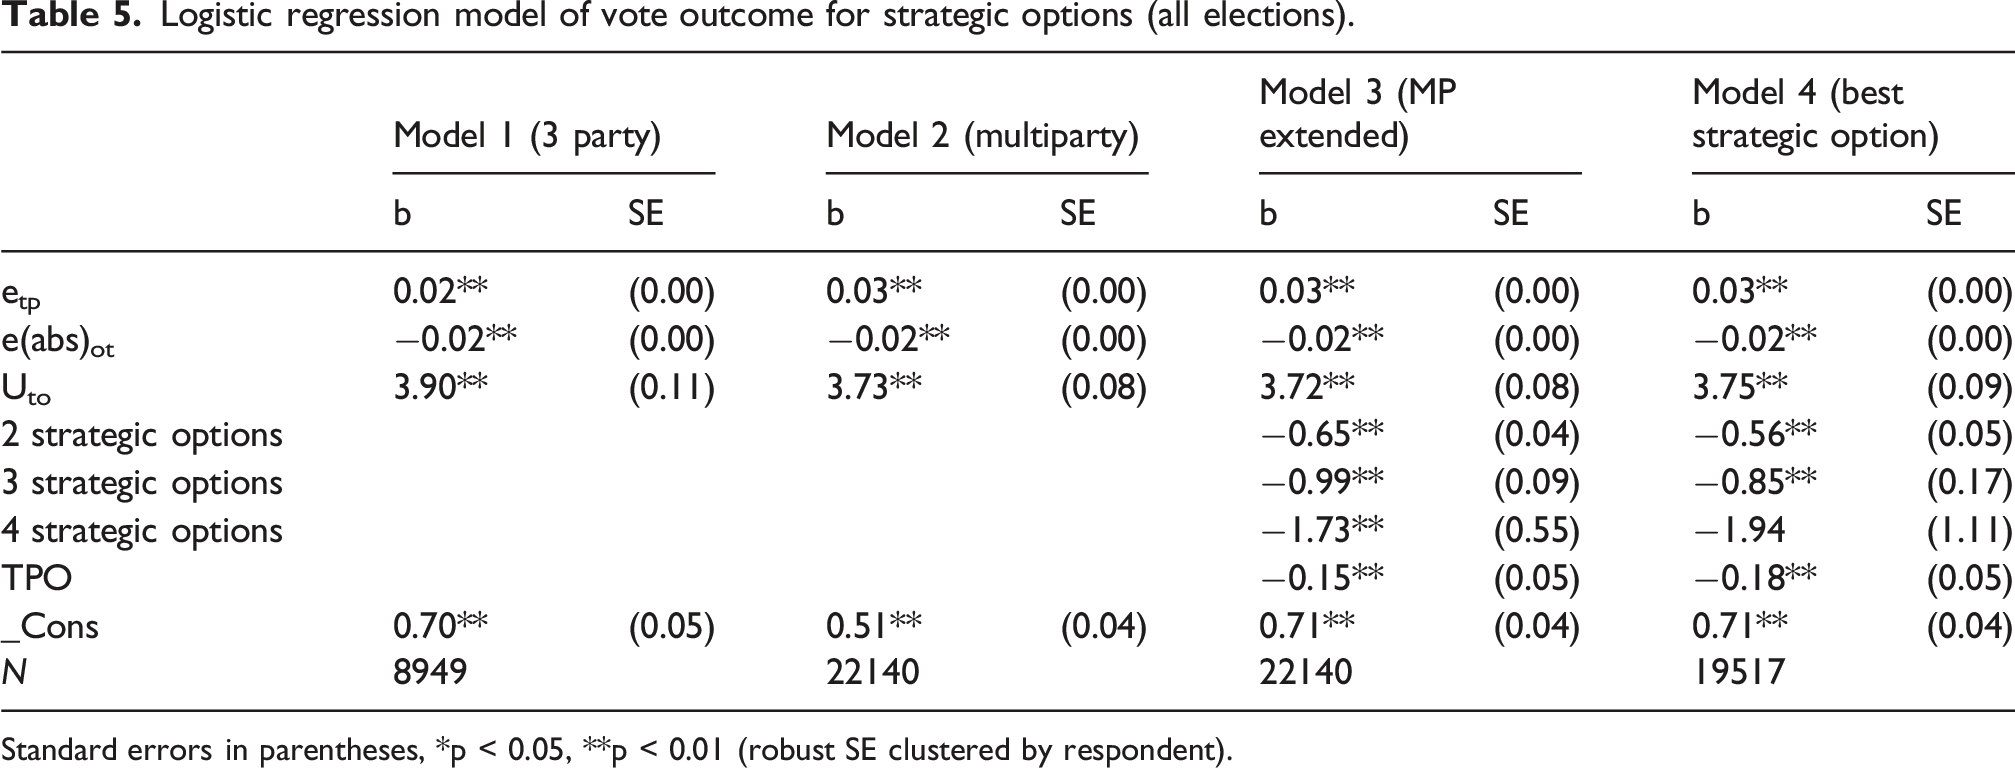
TPO is a dummy variable indicating cases where the target is in first place and the preferred party is second (insurance option). 22
In all multiparty models, coefficients for the three main variables are very similar to those in the three-party scenario. This suggests that if we look at strategic voting according to a more generalised situation, then the predictors of strategic voting remain (reassuringly) consistent. More specifically we find that strategic options are more successful when there is (i) a relatively large utility difference between the strategic option and the opposed party compared to between the preferred and second placed party; (ii) a relatively large perceived win-chance lead of the strategic option over the preferred party; and (iii) a relatively close perceived contest between the strategic option and the opposed party. Additionally, they are also less likely to be selected where other strategic alternatives are available or if they qualify as insurance strategic options. 23 In simple terms, an attractive strategic option is one which is relatively liked and in a good position to defeat an opposed candidate, making it a good substitute for the preferred option.
These models can help us to understand why some parties may benefit more from strategic voting than others. In general, as noted above, major parties are more likely to be strategic options. However, there are also significant differences in the average level of attractiveness of different strategic options by party as indicated by the mean predicted probability of being voted for from Model 4 (Figure 4, LH panel). The predicted values from the model reflect the attributes of strategic options that are associated with strategic voting, but they are not directly affected by the percentage voting for each party in the sample because there is no variable representing party in the model. Thus, the average probabilities reflect how competitive and viable each party is rather than any party-specific effect. On this basis, Labour and SNP strategic options tend to be more attractive strategic options than Conservative candidates, who in turn are, on average, more attractive than Liberal Democrat, Green or Brexit Party/RUK/UKIP strategic options. As a result, Labour tends to be the most effective party at converting strategic options to votes, converting nearly half to votes (Table S9). Differences in the attractiveness of strategic options also shed further light on differences in the level of strategic voting over time (Figure 4, RH panel). We find that, despite the higher level of strategic voting overall, the lower conversion rate of strategic options to strategic votes in 2024 compared to 2019 reflects a lower average level of strategic attractiveness. Strategic attractiveness: mean predicted probability of strategic options being voted for by party and year (model 4).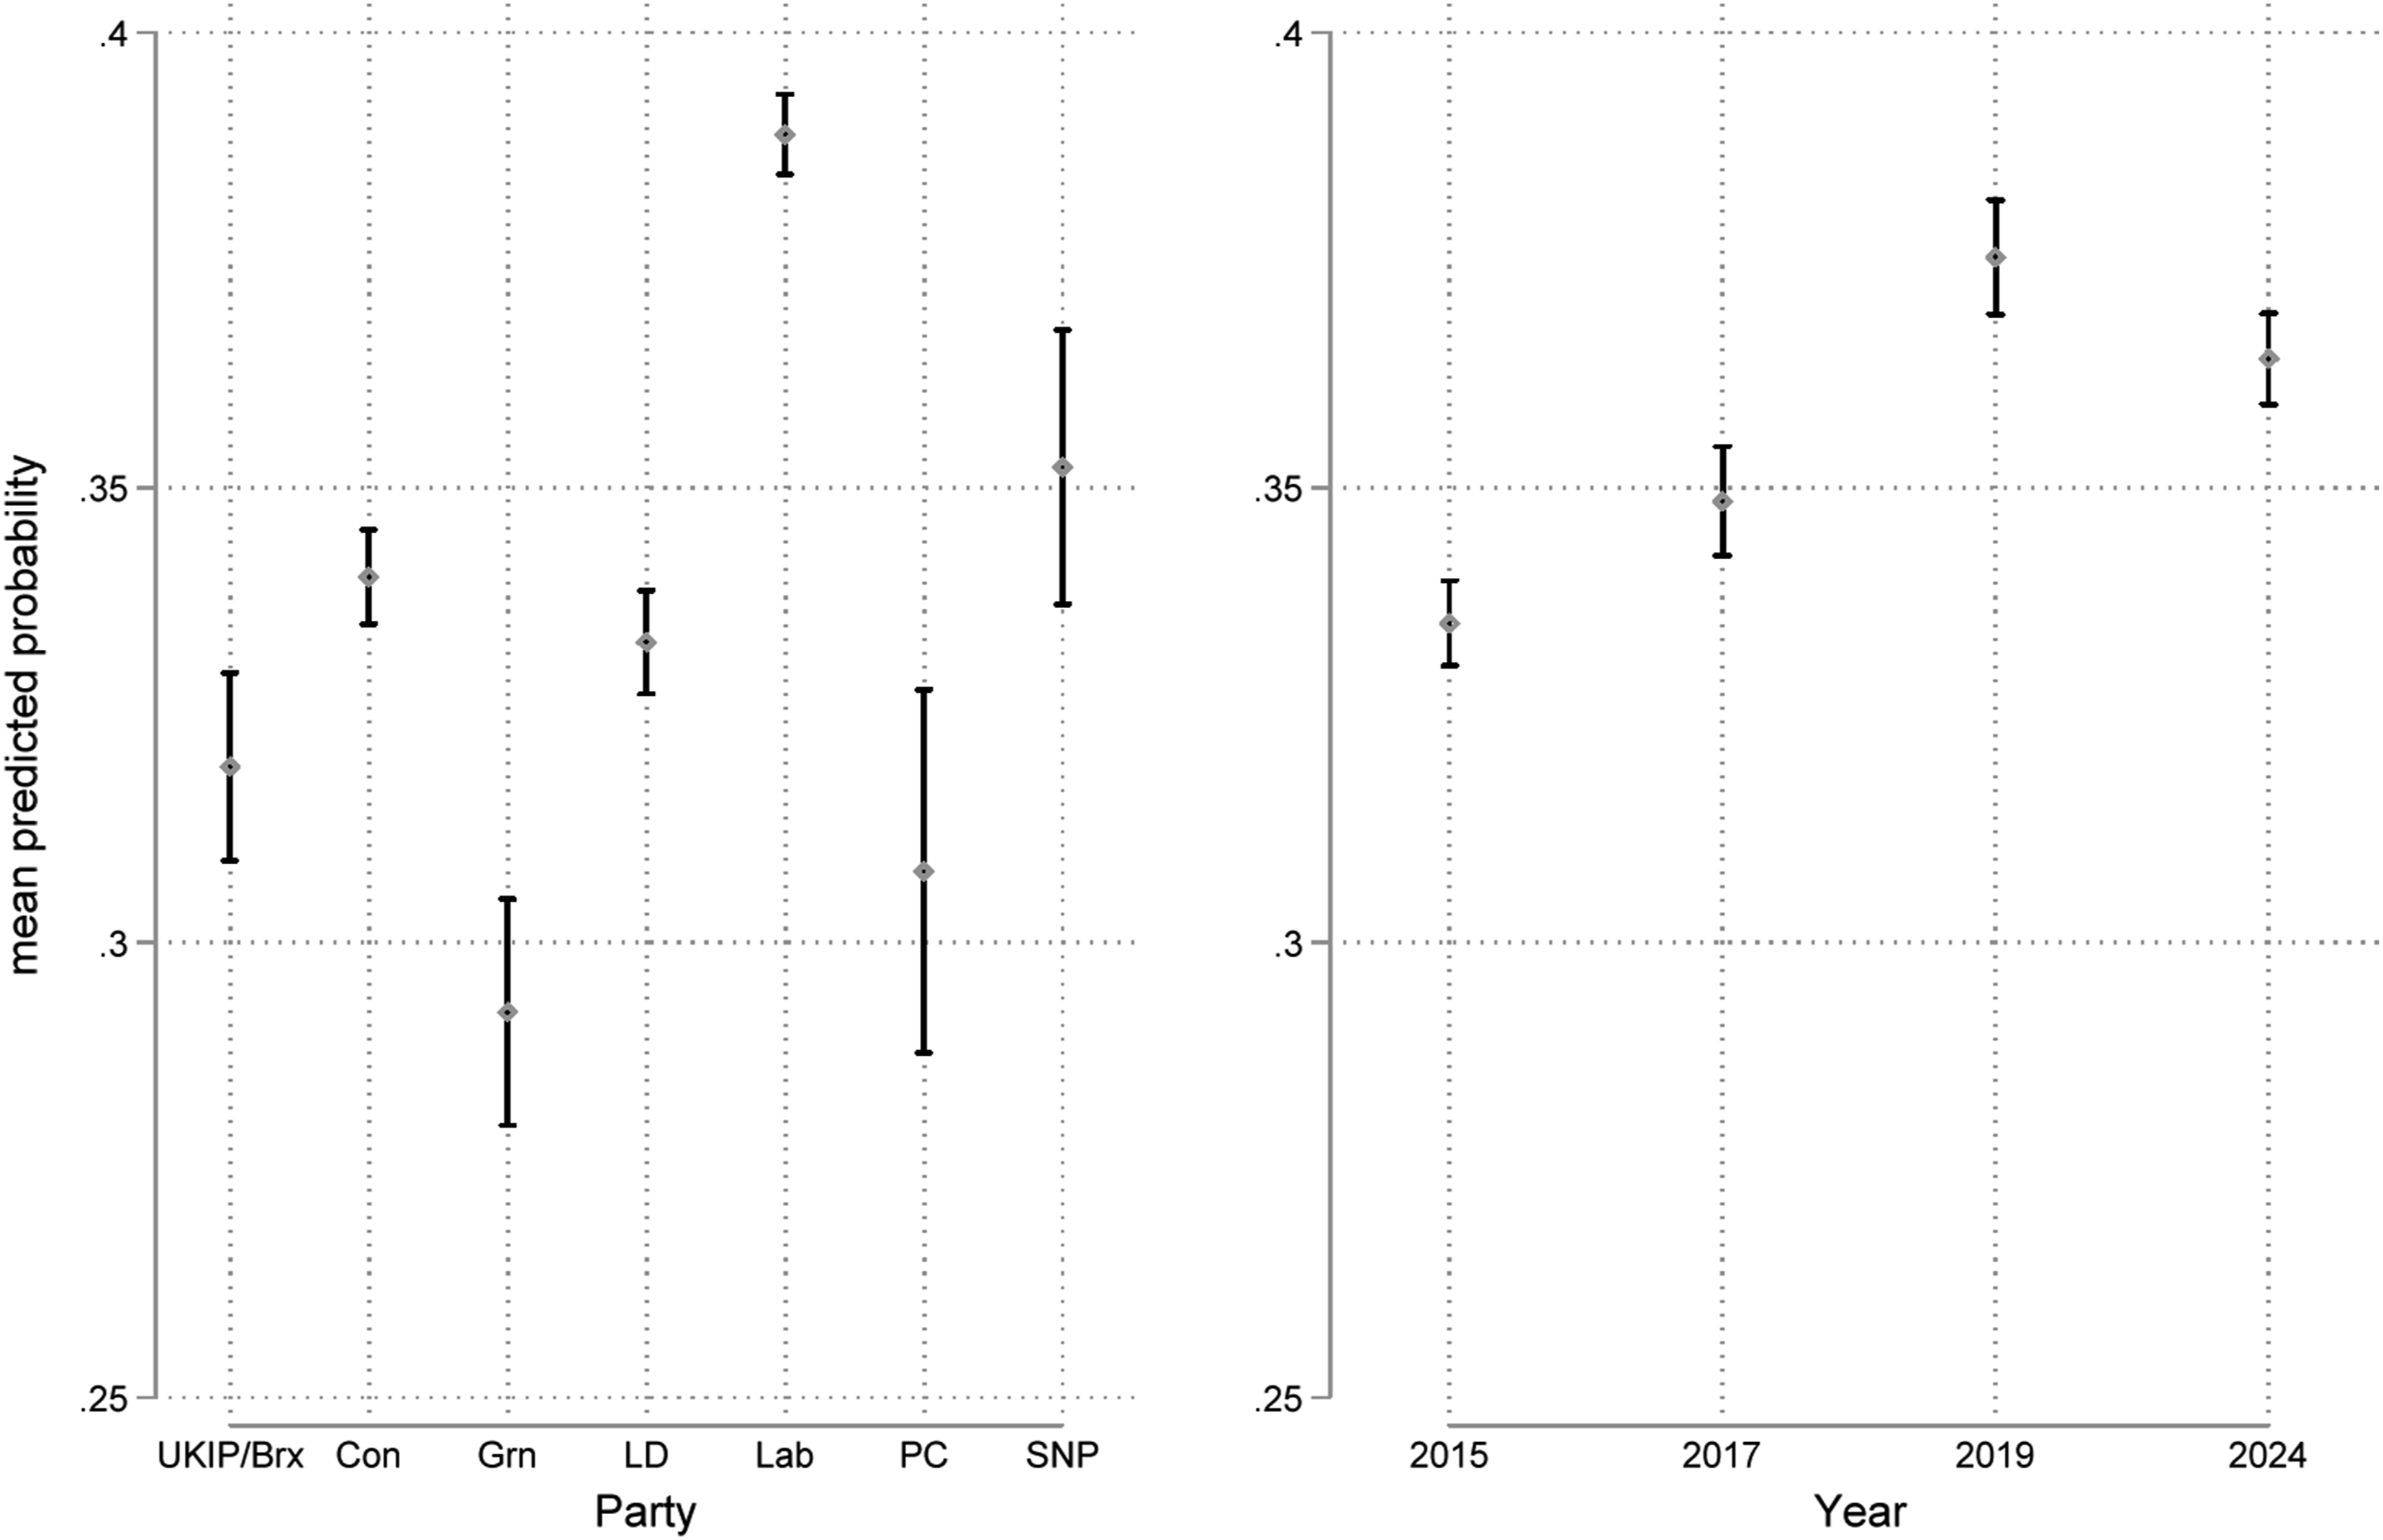
Discussion
Previous research on strategic voting has focussed mainly on the voter, identifying the number and characteristics of strategic voters or the circumstances in which voters behave strategically. In this article we have proposed a new approach to the study of strategic voting which takes the voter-candidate dyad as the basic unit of analysis. We have deployed data relating to the utility and competitiveness of all the main candidates – standing in constituencies across four UK general elections – to identify which candidates offer a strategic option to each individual voter. Not only do our estimates of strategic voting take account of the opportunity to vote strategically as perceived by the voter, but we are able to take account of the attractiveness of the strategic options on offer. Without relying on complex evaluations of expected utility, using the approach described here it has been possible to assess both the extent and quality of strategic options.
A crucial advantage of starting from the level of the option as the unit of analysis is that there is no need to restrict the number of parties in the voter’s choice set to the three leading candidates, making the approach applicable to multiparty contests. Even countries using single-member plurality election systems generate multiparty contests. In the UK, for example, the mean number of candidates per constituency has exceeded five at every election since 1997. This means that a three-party analysis underestimates the extent of strategic voting because much strategic voting involves desertion from minor parties and not from the third-placed contenders as most previous research assumes.
One indicator of the convergent validity of the classification is a comparison with a subjective measure of strategic voting. The British Election Study asks respondents why they vote the way they do with one of the responses signifying a strategic vote (Heath et al., 1991). In our data, 36.4% of respondents who voted for a strategic option gave the response “I really preferred another party, but it had no chance of winning in this constituency” compared to 4.6% of those who voted for the preferred option and 22% who fell into neither of these categories. Thus, while there is a clear relationship in the correspondence between subjective strategic voting, it is far from perfect. However, we should not expect subjective strategic votes to correspond perfectly with those defined by preferences and expectations of success (Fisher 2004a; Fieldhouse et al., 2007; Franklin et al., 1994). When asked directly, many respondents indicate clear preferences and win expectations that contradict the subjective reason for vote question. This suggests a lack of clarity (and possible overlap) in the category options in the latter. Indeed, many voters choosing strategic options report that they thought it was the ‘best party’ in the subjective question. In these cases, voters usually rated the strategic option highly on the like-scales but scored another party higher, but which they believed had little chance of winning. This suggests that voters may discount certain parties when answering this question or otherwise use a different interpretation of ‘best’. For example, ‘best’ might mean ‘best viable’ or ‘most competent’ rather than mostliked. In other words, voters may internalise strategic voting to the extent that they do not explicitly report it as strategic behaviour, suggesting that assessments of the extent of strategic voting using subjective judgements are likely to be subject to significant measurement error.
Applying our approach, we have assessed the number of strategic options and subsequent strategic voting across four British general elections and demonstrated how the range of strategic options can vary depending on electoral context. Overall, across the four elections, 7% of all candidate-voter dyads could be considered strategic and nearly 35% of these were voted for. This translates to 11% of all votes being cast for strategic options, and 39% of voters with the opportunity to vote strategically did so. Critically, we also find that restricting analysis to the top three candidates in each constituency (as per many previous studies) significantly underestimates the true level of strategic voting: multiparty contests require a multiparty approach.
This matters because the extent of strategic voting has scientific, normative and practical implications. Scientifically, to understand why citizens vote the way they do, it is necessary to understand whether vote choices are a sincere reflection of underlying political preferences as opposed to the result of strategic considerations. Normatively, the extent to which voters express sincere preferences is important to how election outcomes are interpreted, for example, in respect to how far particular policies or candidates command the levels of support that they claim, or which groups’ preferences are best represented. Consequently, ‘strategic’ or ‘insincere’ voting is sometimes regarded as normatively problematic, especially if different sections of the electorate have different propensities to vote strategically (Eggers and Nowacki, 2024). Our analysis also has practical campaigning implications. Comparing the average conversion of strategic options to votes across all four elections (35%) to other options which are neither preferred nor strategic (3%), suggests that an advantage may be gained from candidates who persuade voters that they are a strategic alternative to their preferred party. While this is largely a result of being seen as more likely to win and better liked than those other non-preferred options, a multivariate conditional choice model indicates a large significant independent effect of being a strategic option (see Figure S3 and Table S10).
By focusing on strategic options we not only provide an improved framework for estimating the extent of strategic voting conditional on opportunity, but we open new avenues of research to address important questions about the nature of strategic voting, such as: ‘what types of voters are more or less likely to have strategic options?’ And ‘which parties gain, and which lose from strategic voting, and ‘what are the characteristics of candidates which are most closely associated with gaining and losing?’ We believe that, by offering a theoretically grounded classification of the strategic options open to voters in multiparty contests, our approach can potentially transform our understanding of when, where and why voters choose strategically, and how election campaigners can maximise their strategic vote.
Supplemental material
Supplemental material - From strategic voters to strategic options: Recasting strategic voting for multiparty simple plurality elections
Supplemental Material for From strategic voters to strategic options: Recasting strategic voting for multiparty simple plurality elections by Edward Fieldhouse, Justin Fisher in Party Politics.
Footnotes
Declaration of conflicting interests
The authors declared no potential conflicts of interest with respect to the research, authorship, and/or publication of this article.
Funding
The authors disclosed receipt of the following financial support for the research, authorship, and/or publication of this article: This study is supported by Economic & Social Research Council ES/S015671/1
Supplemental material
Supplemental material for this article is available online.