
Abstract
Studies have found that Americans tend to overestimate the size of minority populations, a pattern that potentially increases antipathy toward racial and ethnic outgroups due to heightened perceptions of intergroup competition. Recent research, however, suggests that providing people with accurate information about racial and ethnic demographics has no discernible impact on intergroup attitudes. In this study, we consider whether anxiety is responsible for overestimates of racial and ethnic groups in the USA. We conduct an experiment where we manipulate anxiety before asking subjects to estimate the size of racial and ethnic groups at the local and national level. Contrary to our expectations, our findings suggest that there is no discernible link between emotions and estimates of minority group percentages, and in some cases, negative emotions reduce misperceptions.
Keywords
Perceptions of local demographics can have a profound impact on preferences for neighborhoods, schools, and race-conscious policies (Clark, 2002; Kleitz et al., 2000; Mummolo and Nall, 2017). Although demographic perceptions tend to correlate with objective demographic characteristics, studies show that individuals overestimate the size of minority populations at the local and national level (Nadeau et al., 1993; Wong, 2007). These misperceptions can harm intergroup relations, as studies have found that the size of minority populations is positively associated with increases in opposition to inequality-attenuating policies, negative stereotyping, and political participation among majority group members (Dancygier, 2010; Key, 1949). Indeed, as Hopkins et al. (2018: 5) argue, “if people erroneously overestimate the size of outgroups […] then these overestimates could exacerbate the majority’s sense that the minority group is a threat to its interests and values.”
Despite a growing number of studies that explore the prevalence of these overestimates, we know surprisingly little about their origins. One of the assumptions of the power threat hypothesis, a prominent hypothesis in the intergroup relations literature, is that larger minority populations can evoke perceptions of threat among majority group members (Key, 1949). However, it is unclear whether these negative emotional states play an independent role in shaping how people estimate the size of minority groups. As recent studies show, negative emotions such as anger and racial schemas are psychologically linked, and thus, the relationship between demographics and threat perceptions might run in the opposite direction (Banks and Valentino, 2012; Banks, 2016). In this article, we evaluate the “emotional substrates” of demographic overestimates by manipulating anxiety and exploring its effects on perceptions of local and national demographics. We find that anxiety has limited effects on demographic perceptions and, in some cases, improves performance in a demographic estimation task.
Misperceptions and corrections
Demographics are an essential component of realistic group conflict theory and related hypotheses such as power threat (Key, 1949). According to this theory, as minority populations increase in size, there is a corresponding increase in hostility due to economic and political resource competition (Bobo, 1999; Key, 1949). However, rather than accurately perceiving the size of demographic groups, most Americans tend to overestimate the size of racial, ethnic, and religious minorities while underestimating the size of majority groups (i.e. whites) (Wong, 2007). Recently, Hopkins et al. (2018) attempted to reduce overestimates of minority group prevalence by presenting subjects with accurate information about immigration levels. Contrary to the causal path described by realistic group conflict theory and the power threat hypothesis these corrections fail to dampen negative immigration attitudes. These findings dovetail with Lawrence and Sides (2014) who find that providing subjects with accurate information about unemployment, education, and poverty has no discernible effect on policy-relevant attitudes and beliefs.
While existing studies assume that local area demographics contribute to threat perceptions, it is virtually unknown whether demographic beliefs are themselves a function of threat or other negative emotional states. In explaining the lack of a relationship between factual corrections of demographic numbers and intergroup attitudes, Hopkins et al. (2018) propose that these beliefs may be grounded in symbolic predispositions. In addition, Wong (2007) argues that psychological factors such as “fear of outgroups” might motivate majority group members to overestimate the size of minority populations. Due to inherent challenges involved in manipulating stable political predispositions, we explore whether negative emotional states increase the likelihood of overestimating the size of minority groups.
Previous research has shown that anxiety contributes to heightened threat sensitivity (Bar-Haim et al., 2007). As it relates to intergroup relations, when experiencing anxiety, people tend to exhibit “exaggerated responses, usually negative ones, rely on cognitive heuristics such as stereotypes, and express polarized emotions and evaluations, typically negative ones” (Stephan et al., 1999). Moreover, Banks and Valentino (2012) show that negative emotions are linked to racial beliefs, strengthening the impact of racial predispositions on intergroup attitudes. If anxiety magnifies threat perceptions associated with racial and ethnic minority populations, this implies that we should observe an increase in estimates of minority group percentages, but not majority group percentages. These findings set up our first two hypotheses. 1
Since people are more accurate in estimating local area demographics than national demographics (Wong, 2007), we expect that anxiety will exert a stronger influence on national perceptions. We use this finding to develop our third hypothesis.
Still, the estimation of group sizes is not only a matter of perceptions or recall of relevant facts, it is also a mathematical task. 2 As previous studies in the educational literature have shown, anxiety can decrease performance on quantitative tests (Karimi and Venkatesan, 2009; Silk and Parrott, 2014; Zakaria and Nordin, 2008). Insofar as demographic misperceptions are indicative of innumeracy, this literature suggests that anxiety should increase estimation errors, regardless of their direction. Moreover, if anxiety affects numeracy in general, we expect that these estimation errors will affect perceptions of both majority and minority groups. This sets up our fourth hypothesis. 3
Data and methods
Design
We implemented a two-wave experimental design to test these hypotheses. 4 In the first wave, we recruited 1640 respondents via Amazon Mechanical Turk, a crowdsourcing website, to gather data on demographics and potential moderators. The second wave consisted of the experimental conditions (anxiety, anger, and control), local and national estimates of demographic groups, manipulation checks, racial attitudes, and respondent demographics. Of the 1640 participants (the maximum allowed by the study budget) that completed the first wave, 676 participants completed the second wave. 5
In the second wave, which was carried out approximately one week after the first wave, respondents were randomly assigned to one of three conditions: relaxation, anger, and anxiety. The anger condition was included to rule out negative affect as an experimental confound. Within each condition, subjects were asked to write for three to five minutes about an experience that produced the assigned emotion. 6 Outcome variables were collected next, as respondents were asked to estimate the percentage of various demographic groups in their ZIP code and the USA. 7 Data on self-reported emotions were also collected as a manipulation check. The second wave concluded with a set of demographic questions and a debriefing statement explaining the purpose of the study.
Measures
We follow previous research that measures demographic perceptions using percentages (Wong, 2007; Wong et al, 2012; Velez and Wong, 2017). For whites, blacks, Asians, Hispanics, and immigrants, we measure misperceptions using the following equation

where Yij represents the percent of the total population comprised by group j according to individual i and Yaj represents the percent of the total population comprised by group j according to the 2011-2015 American Community Survey (a). These numbers are computed at the ZIP code and national level. If M1ij is positive, then group j is overestimated, whereas if it is negative, group j is underestimated.
To assess whether anxiety increases general estimation errors, we modify Equation 1 and take the absolute value
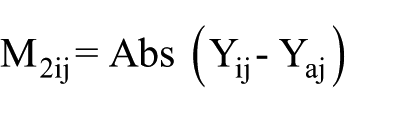
If M2ij is positive, group j is misestimated, whereas if M2ij is zero, this indicates that group j is accurately estimated.
Models
First, we assess whether we successfully manipulated the relevant emotions by estimating the average treatment effect (ATE) of anxiety and anger on self-reported levels of anger and anxiety. 8 Then, we evaluate our main hypotheses by estimating the ATE of anxiety and anger on demographic perceptions at the local and national level. For these analyses, we estimate a set of ordinary least squares (OLS) regressions that regress misperceptions on treatment indicators for those in the anger and anxiety condition. To assess our fourth hypothesis, we regress absolute misperceptions on treatment indicators for both conditions. Two-tailed hypothesis tests with α = .05 are used.
Manipulation checks
Due to difficulties in successfully manipulating emotions, we examined whether our experimental stimuli increased the experience of relevant emotions using self-reported measures (Albertson and Gadarian, 2016). 9 As shown in Figure B1 in the Online Appendix, subjects in the anger condition were more likely to report feeling angry than those in the relaxation and anxiety conditions (p <.05 two-tailed). Subjects assigned to the anxiety condition were significantly more likely to report feeling anxious relative to those in the relaxation condition (p <.05 two-tailed). However, self-reported levels of anxiety did not differ between the two negative emotions conditions. Still, those in the anger condition were more likely to report higher relative levels of anger whereas those in the anxiety condition were more likely to report higher relative levels of anxiety (p <.05 two-tailed). This relative measure was calculated by subtracting anger scores from anxiety scores for each respondent. 10
Results
Figure 1 displays the results from our ten models. Average misperceptions for those in the control condition are depicted using a horizontal line. Point estimates for those in the anger (anxiety) condition are depicted using a circle (triangle). Consistent with Wong (2007), people tend to overestimate blacks, Hispanics, Asians, and immigrants but underestimate white populations. Local perceptions of demographics also tend to be more accurate than national perceptions for every demographic group except for whites. Though the general trend involves negative emotions decreasing overestimates of minority populations, only two of the ATE estimates are statistically significant at the .05 level. Anger improves the accuracy of estimating Hispanic populations at the local level by 3.3 percent (± 3.1 percent) and Asian populations at the national level by about 2.9 percent (± 2.7 percent). Except for our second hypothesis, which specifies that anxiety will not affect estimates of majority groups, we do not find sufficient evidence for the first three hypotheses. In Figure 2, we examine the effects of emotions on absolute misperceptions and observe similar patterns, such that anxiety does not increase general estimation errors. 11 In most cases, anxiety and anger contribute to decreases in absolute misperceptions, consistent with our findings using the previous outcome measure.

The ATE of anger and anxiety on average misperceptions across several racial and ethnic groups. Horizontal lines depict the average misperception for subjects in the relaxation (baseline) condition. Point estimates for subjects in the anger (anxiety) conditions are depicted using a circle (triangle). Vertical lines reflect 95% confidence intervals.

The ATE of anger and anxiety on absolute misperceptions across several racial and ethnic groups. Horizontal lines depict the absolute misperception for subjects in the relaxation (baseline) condition. Point estimates for subjects in the anger (anxiety) conditions are depicted using a circle (triangle). Vertical lines reflect 95% confidence intervals.
Discussion
Recent studies attempt to reduce the effects of misperceptions by providing subjects with accurate information about racial and ethnic demographics (Hopkins et al., 2016). However, these interventions generally fail to affect relevant attitudes. In our study, we explored whether negative emotions such as anxiety increased overestimates of minority populations in a demographic estimation task. While minority groups instill fear and negative emotions within the general population (Riek et al., 2006), our results suggest that this is a post hoc invocation. In fact, contrary to the expectation that negative emotions drive people to overestimate the size of minority populations or commit errors in estimating demographics, we find some evidence that negative emotions improve the accuracy of subjective estimates. Thus, some of our results are broadly consistent with Marcus et al. (2000) who argue that emotions such as anxiety can stimulate judgmental accuracy and a decreased reliance on heuristics.
Though we do not find evidence that emotions impact demographic estimation, future work could expand upon this study by considering different facets of emotion, and evaluating whether emotions shape how individuals arrive at these subjective estimates in the first place. While short-term inductions of negative emotions do not appear to influence demographic overestimates, chronic experiences with certain emotions might play a more important role. For instance, individuals who score high on trait anxiety might commit more errors in estimating minority population sizes compared to individuals who are less chronically anxious (Stephan et al., 1999). Also, in our study, we focus on perceived estimates of group percentages as the primary outcome variable. However, if these perceptions are indeed stable and immune to corrections (Hopkins et al., 2016), the impact of emotions might be revealed at an earlier stage of the presumed causal chain by influencing information-seeking behaviors. Moving forward, scholars should continue to explore why overestimates of minority populations are so prevalent, and evaluate the promise of potential antidotes to these misperceptions as Western industrialized countries grow more diverse.
Supplemental Material
Appendix_(7) – Supplemental material for Nothing to fear? Anxiety, numeracy, and demographic perceptions
Supplemental material, Appendix_(7) for Nothing to fear? Anxiety, numeracy, and demographic perceptions by Yamil Ricardo Velez, Gabriel Borelli, Taeo Carse, Zhuo Chen, Anna Pezanoski-Cohen, Peter Dunphy, Giovanni Hutchinson, Taryn Johnson, Samuel Prescott, Nila Ravi, Matt Wallock, Aimée Wilkerson and Grace Wong in Research & Politics
Footnotes
Author’s Note
Yamil Ricardo Velez is now affiliated with The George Washington University, USA.
Declaration of conflicting interests
The author(s) declared no potential conflicts of interest with respect to the research, authorship, and/or publication of this article.
Funding
The author(s) received no financial support for the research, authorship, and/or publication of this article.
Supplemental material
Notes
Carnegie Corporation of New York Grant
This publication was made possible (in part) by a grant from the Carnegie Corporation of New York. The statements made and views expressed are solely the responsibility of the author.
References
Supplementary Material
Please find the following supplemental material available below.
For Open Access articles published under a Creative Commons License, all supplemental material carries the same license as the article it is associated with.
For non-Open Access articles published, all supplemental material carries a non-exclusive license, and permission requests for re-use of supplemental material or any part of supplemental material shall be sent directly to the copyright owner as specified in the copyright notice associated with the article.