
Abstract
Fact-checking has gained prominence as a movement for revitalizing truth-seeking ideals in journalism. While fact-checkers are often assumed to code facts accurately, few studies have formally assessed fact-checkers’ overall performance. I evaluated the performance of two major fact-checkers in the USA, Fact Checker and Politifact, comparing their inter-rater reliability using a method that is regularly employed across the social sciences. Surprisingly, only one in 10 statements was found to be fact-checked by both fact-checkers. Regarding claims evaluated by both organizations, the fact-checkers performed fairly well on outright falsehoods or obvious truths; however, the agreement rate was much lower for statements in the more ambiguous scoring range (that is, “Half True” or “Mostly False”). The results suggest that fact-checking is difficult, and that validation is challenging. Fact-checkers rarely evaluate statements that are exactly the same, and disagree more often than one might suppose, particularly when politicians craft language to be ambiguous. At least in some cases, the strategic ambiguity of politicians may impede the fact-checking movement’s goals.
Introduction
Often described as the umpires of democracy, fact-checkers aim to keep false political claims out of the public discourse (Amazeen, 2013). According to Graves (2016), fact-checking may inoculate readers against deceptive claims and inhibit political lying by making it more costly for political figures to distort the truth. But how easy is it for fact-checkers to do their job, in practice?
I evaluated the performance of two major online fact-checkers (Politifact and Fact Checker) by using a method that is regularly used across the social sciences for assessing inter-rater reliability among multiple coders. I show that fact-checkers rarely fact-check the same statements and disagree more often than one might suppose; and I conclude that validating fact-checking is challenging, partly because fact-checkers do not use directly comparable scales. Also, assessing the significance or the implications of inaccuracies in political claims may require subjective judgment, which often leads to discrepancies in ratings. I found that in many cases, these discrepancies can be explained by one of the following: (a) fact-checkers present the same set of counter-examples or evidence but have different views on the significance or the implications of them; or (b) fact-checkers vary in the quantity of counter-examples or evidence in support of or against the statement in question.
Previous works have focused on the effects of fact-checking. Some suggest that fact-checking can serve as an “extensive and consistent monitoring [tool for] politicians” by discouraging them from promoting false or misleading claims (Nyhan and Reifler, 2015). Others have argued that fact-checking has had very little effect in changing candidate behavior (Froomkin, 2012; Gottfried et al., 2013). More specifically, candidates often ignore fact-checkers’ critiques by simply dismissing the fact-checking community as politically biased (Waldman, 2015). Donald Trump, for example, repeated many claims despite the negative ratings he had received for those statements. The Trump presidential campaign, according to the Washington Post Fact Checker Glenn Kessler, “does not even bother to respond to fact-checking inquiries” (Kessler, 2016). Trump was only one among the many candidates from whom the fact-checkers never received a response when they asked for a clarification or correction of inaccurate statements. 1
While the effects of fact-checking have been studied by numerous scholars, very few studies have formally assessed the overall performance of fact-checkers. In my evaluation, I focus on the two aspects fact-checkers claim make their work effective: first, that many political claims are fact-checked by multiple fact-checkers, thus allowing for a second pair of eyes; and, second, that fact-checkers tend to agree on the accuracy of a given political claim.
Based on extensive fieldwork and interviews conducted over the course of five years at major fact-checking outlets, Graves (2016) points out that, unlike traditional news reporters who deliberately try not to repeat the news that has already been published, fact-checkers are less intent on generating a scoop or exclusive news content. According to Graves (2016), Angie Holan, Eugene Kiely, and Glenn Kessler, chief editors at each of the three major online fact-checking outlets, “watch [one another]’s sites and repeat [one another]’s fact-checks with [their] own process” and “get a little ruffled” when they reach different conclusions (Graves, 2016: 98). Fact-checking has a lot to offer, especially when politicians craft language to be ambiguous. Due to the difficulty of validating the truth of these subtle forms of deception, the public could benefit from having multiple fact-checkers independently evaluate politicians’ misleading remarks. As Kessler argues, fact-checking can have the greatest impact when multiple fact-checkers reach the same conclusion on a given statement. Thus, it is important to analyze (a) whether political claims are in fact evaluated by multiple fact-checkers, and (b) if fact-checkers are able to reach the same conclusion on how accurate a given claim is.
To assess fact-checkers’ performance, I have devised an effective research design which differs from previous studies in the following ways.
First, my design examines an expansive set of political claims. Amazeen (2016), who was among the first to provide a formal assessment of fact-checkers’ performance, focuses on fact-checks of political claims in campaign ads. Similarly, the findings of Marietta et al. (2015) are confined to a small number of topics. My sample, however, includes all statements made by candidates of the 2016 US presidential election that were fact-checked by Politifact and Fact Checker.
Second, I use two different metrics to assess the performance of fact-checkers. Previous studies have focused exclusively on how often fact-checkers agree on a set of identical statements (Amazeen, 2016), while neglecting to examine how often a political claim is evaluated by more than one fact-checker. In this paper, I evaluate if a given claim is independently evaluated by multiple fact-checkers, and if fact-checkers are able to reach the same conclusion on the accuracy or truthfulness of the claim.
Third, I assess the performance of fact-checkers based on their own ordinal scales rather than arbitrarily converting their scales into a binary or a ternary scale. As I show in the next section, fact-checkers’ consensus rates vary widely depending on the researcher’s choice of conversion method. Moreover, the researcher’s arbitrary truncation of the fact-checkers’ original ordinal scale might obscure the nuances fact-checkers may have intended to convey through a more fine-grained, ordinal scale. The ordinal scale is therefore used to offer the fact-checkers the fairest assessment possible.
My results show that while fact-checkers perform fairly well on outright falsehoods or obvious truths, the agreement rate is much lower for statements in the more ambiguous scoring range (i.e., “Half True” or “Mostly False”). Lack of consensus among fact-checkers may arise from the challenge of verifying the accuracy of political claims. Politicians tend to be quite vague (Shepsle, 1972), which makes it difficult for fact-checkers to evaluate their claims in a clear and objective manner. Because fact-checkers rarely evaluate the same statement and disagree more often than one might suppose, fact-checking may fall short of holding politicians accountable for their words.
An original dataset on fact-checks and ratings
Data
I test two of the main factors that fact-checkers suggest make their work effective – the large overlap and the high consensus rate – by analyzing fact-checks on 2016 US presidential candidates’ statements from September 2013 to 08 November 2016. September 2013 was chosen because it is the earliest date from which fact-checks have been systematically archived on the two major fact-checking outlets, Politifact and Fact Checker, that are the subjects of my analysis. FactCheck.org, another major fact-checking outlet, is excluded because, unlike Fact Checker or Politifact, FactCheck.org does not provide ratings for politicians’ statements. Therefore, only Fact Checker and Politifact are used for a comparative analysis.
As shown in Figure 1, 1178 and 325 fact-checks were obtained from Politifact and Fact Checker, respectively. 2 If a statement was fact-checked only by either one of the two fact-checkers, it was labeled as “Non-overlap.” Pairs of identical or similar statements that were fact-checked by both fact-checkers were categorized as either “Overlap” or “Murky” (see Appendix C and D for a complete list of Overlap and Murky statements). Overlap and Murky statements were hand-coded as follows: Because Fact Checker evaluated fewer statements than did Politifact, for each statement on Fact Checker I examined Politifact’s fact-checks for a corresponding candidate to find a statement that was similar (Murky) or identical (Overlap). The inter-rater reliability rate among two independent coders on 50 randomly selected fact-checks was 0.75, which is well within the 0.7–0.8 range, the standard of inter-rater reliability that academics commonly apply when evaluating hand-coded data (Barrett, 2001).
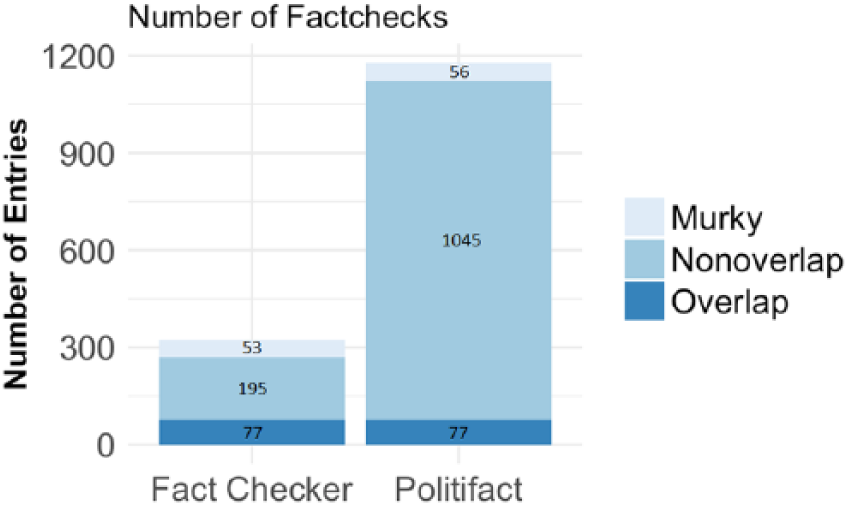
Number of fact-checks by Politifact vs. Fact Checker.
Distinctions between Murky and Overlap were made based on the title of the article, which provides information on the statement being fact-checked; each fact-checker’s evaluation objective for a given statement; and fact-checkers’ explanations for their ratings. A pair of two identical statements was coded as Overlap. In some cases, however, the statements being fact-checked were almost identical except that one version included an additional phrase/sentence, and/or one fact-checker examined only parts of a claim whereas the other fact-checker evaluated the entire claim, and/or the key phrase was worded differently. These statements were coded as Murky. For example, “We have the highest murder rate in this country in 45 years” and “We have an increase in murder within our cities, the biggest in 45 years” were coded as Murky, because the former focused on the murder rate itself whereas the latter considered the size of “an increase in murder.” However, non-identical statements could still be coded as Overlap if different wordings did not affect fact-checkers’ evaluation or were not the key point of contention. For instance, the following pair of two non-identical statements – “58 percent of African American youth is unemployed” and “The unemployment rate for African American youths is 59 percent” – were coded as Overlap, because the key point of contention for both fact-checkers was whether or not Trump exaggerated the figure, not whether the true unemployment rate was 58 or 59 percent.
Lack of overlap in what fact-checkers evaluate
According to chief editors at the three major fact-checking websites, fact-checkers often repeat one another’s fact-checks and regard it as important that they reach the same conclusion on a given political claim (Graves, 2016). Because of the difficulty of validating the accuracy of political claims, I would thus argue that the public could benefit from having multiple fact-checkers verify one another’s ratings by independently evaluating a given claim. A high rate of overlap implies that a large number of political claims are being scrutinized by more than one fact-checker.
I measured the rate of overlap by computing the following.
(Number of Overlap statements) ÷ (Total number of statements)
and: (Number of Overlap statements + Number of Murky statements) ÷ (Total number of statements)
Murky statements are included in order to credit fact-checkers for evaluating claims that are very similar (albeit not identical word-for-word). Among the 1503 fact-checks, there were 77 pairs of Overlap statements, 53 Murky statements for Fact Checker, and 56 Murky statements for Politifact (see Figure 1). 3 The proportions of overlap are 0.065 and 0.237 for Politifact 4 and Fact Checker, respectively (see Table 1a). Approximately 93% of statements that were fact-checked by Politifact were not evaluated by Fact Checker; and, similarly, more than 75% of claims that were fact-checked by Fact Checker were not covered by Politifact. After including Murky statements, the rate of overlap rises to 0.113 for Politifact, and to 0.400 for Fact Checker. Even then, however, it appears that in the majority of cases, fact-checkers do not fact-check the same statement and, as a result, readers are not afforded a second pair of eyes for an accountability check.
Proportion of overlap.

Note: the proportions of overlap are 0.065 and 0.237 for Politifact and Fact Checker, respectively. When Murky statements are included, the proportion of overlap rises to 0.113 for Politifact and to 0.400 for Fact Checker. Approximately, only 7 in every 100 statements in Politifact were also evaluated by Fact Checker.
Measuring consensus among fact-checkers
Fact Checker and Politifact each operate using similar (although not directly comparable) rating systems. Politifact uses a six-point scale (“True,” “Mostly True,” “Half True,” “Mostly False,” “False,” and “Pants on Fire”), while Fact Checker has a five-point scale (“Geppetto Checkmark,” “1 Pinocchio,” “2 Pinocchios,” “3 Pinocchios,” and “4 Pinocchios”). To compute any correlations, I had to make Politifact’s six-point scale comparable to Fact Checker’s five-point scale. Following Kessler’s (Chief Editor at Fact Checker) own interpretation 5 of how Fact Checker’s scale compares to that of Politifact, I grouped “Geppetto Checkmark” with “True,” “1 Pinocchio” with “Mostly True,” “2 Pinocchios” with “Half True,” “3 Pinocchios” with “Mostly False,” and both “False” and “Pants on Fire” with “4 Pinocchios.”
As mentioned in the introduction, I assessed the performance of fact-checkers using their own ordinal scales rather than a truncated binary or ternary scale, because fact-checkers’ inter-rater reliability varies depending on the researcher’s choice of conversion method. For example, when Amazeen’s (2016) coding scheme (i.e., 0 [zero] if “True” or “Geppetto Checkmark”; and 1 if “Mostly True,” “Half True,” “Mostly False,” or “False”) is applied, the inter-rater reliability between Politifact and Fact Checker is very high (0.787). However, using a ternary design in which I classified “True” (“Geppetto Checkmark”) as 1, “Mostly True,” “Half True” and “Mostly False” as 2, and “False” and “Pants on Fire” as 3, I obtained a much lower inter-rater reliability score of 0.471 (See Appendix B for inter-rater reliability scores for various possible binary and ternary designs).
Cohen’s κ coefficient was used to compute the inter-rater reliability between Politifact and Fact Checker. Cohen’s κ is widely used in social sciences to measure the rate of agreement among multiple coders. This measure is considered more robust than the raw agreement rate which, according to Cohen, is an inflated index because it fails to exclude agreements that happen by chance (Barrett, 2001).
As shown in Table 1b, the weighted κ, whose penalty increases at a higher rate as the size of disagreement becomes larger, is 0.750, which meets the typical threshold considered acceptable for evaluating hand-coded data. I also computed an unweighted κ, because fact-checkers do not specify the distance between each category on their scoring scales. For example, “Mostly True” is two scale-points apart from “Mostly False” and, similarly, “Half True” is two scale-points distant from “True.” However, the distance between “Half True” and “True” may not be equal to the distance between “Mostly True” and “Mostly False.” The unweighted κ is 0.467, and this is lower than typical thresholds for scientific coding.
Consensus rate.

Note: for statements that were fact-checked by both Politifact and Fact Checker, the weighted Cohen’s κ is 0.750 and the unweighted κ is 0.467. When Murky statements are included, the intercoder reliability decreases slightly on both weighted and unweighted scales.
As shown in Figure 2, Politifact and Fact Checker agreed on the ratings for 49 out of 77 Overlap statements. Among the 28 cases in which they disagreed, the ratings vary by two or more scale-points only 21.4% of the time; and about 78% of the disagreements were relatively minor (i.e., the ratings vary by only one scale-point). In addition, fact-checkers performed fairly well when evaluating outright falsehoods or obvious truths. As the confusion tables in Figure 2 show (see Appendix A for the Confusion Tables for Overlap/Murky statements), no statement received both “Geppetto Checkmark” and “Pants on Fire”. Note that the Murky sample was not used to calculate the consensus rate between Politifact and Fact Checker to ensure that they are not penalized for discrepancies in ratings caused by an addition of a word to an otherwise identical statement.
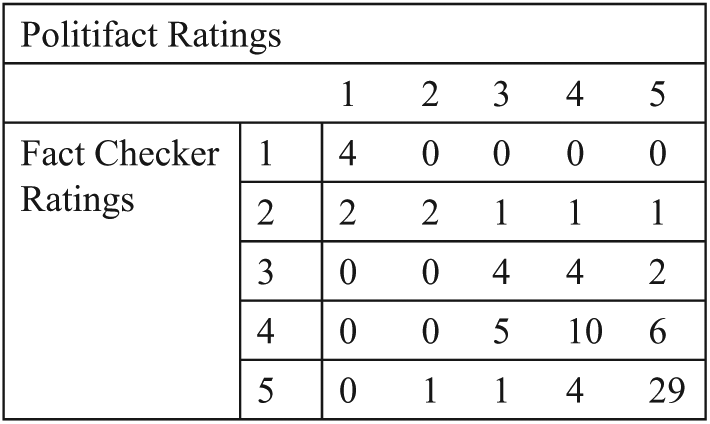
Confusion table for overlap statements.
However, the agreement rate is much lower (14 agreements out of 23 cases) for statements in the more ambiguous scoring range (i.e., “Half True” (point 3) or “Mostly False” (point 4)). I found that in many cases, discrepancy in ratings often stemmed from differences in fact-checkers’ subjective judgment of the significance of inaccuracies in a statement, rather than their disagreement on whether the statement itself was true or not. For example, both fact-checkers evaluated Jeb Bush’s claim that “Florida led the nation in job creation.” The two fact-checkers provided identical sets of rationales for why Bush’s claim may be misleading: (a) Bush relied on raw job totals; (b) the year 1999 was omitted; (c) much of Florida’s job gains were due to an increase in low-paying jobs. Fact Checker decided that Bush deserved “4 Pinocchios” while Politifact concluded that these exact same fallacies were not nearly as egregious, rating the claim “Half True.”
Another source of discrepancies in ratings is differences in the number of counter-examples or evidence each fact-checker uses in support of, or against, the statement in question. For instance, Fact Checker gave “3 Pinocchios” (roughly equivalent to “Mostly False”) to Rick Perry’s claim that “In the last seven years of [his] tenure, Texas created 1.5 million new jobs,” while Politifact rated the claim “Mostly True.” Upon carefully analyzing the fact-checkers’ explanation, it seems that Fact Checker gave a higher dishonesty rating because Fact Checker found an additional fault in Perry’s statement. In addition to offering the same set of evidence presented by Politifact (i.e., cherry-picked data sources), Fact Checker also pointed out that he had aggregated unemployment numbers in an incorrect manner. However, both Fact Checker and Politifact agreed that Perry’s claim was not completely free of inaccuracies.
Often, “Half True” or “Mostly False” statements are subtle claims that politicians frequently use to be deliberately deceptive. Underneath what appears to be a “true” statement, politicians may attempt to mislead by engaging in logical fallacies such as cherry-picking a more favorable piece of evidence or using a “straw man” argument. Fact-checks of these subtle forms of deception are what readers could most benefit from; however, this is also where fact-checking struggles the most. My findings imply that this is partly because determining the significance of logical fallacies or inaccuracies in a given context may require subjective judgment.
Content of fact-checks
In this section, using a text classification model, I present an analysis of the content of fact-checks and evaluate if fact-checkers tended to agree more often or less often in certain topic areas. To analyze the content of fact-checks, I first gathered 1503 fact-check entries from Politifact and Fact Checker. Each entry consisted of a direct quotation of the statement being fact-checked and the fact-checker’s evaluation of the statement. I created a document term matrix by first stemming the words in the text, discarding stop words, and representing the words in unigrams (single words). Each row of the document term matrix represents a single fact-check entry and the column consists of the 1000 most commonly occurring unigrams. Each cell corresponds to the number of times a given unigram appears in a given entry.
I then applied latent Dirichlet allocation (LDA) to model the topics in the texts. I assumed that the collection of fact-checks on Politifact and Fact Checker were driven by seven topics, a number chosen after assessing the substantive fit within and among the clusters. LDA assumes that each word in a document is generated from a single topic. Because different words in a document may be generated from different topics, each document is represented as a mixture of different proportions of various underlying topics. I then assigned the topic with the maximum proportion to each document.
Using the output from LDA, topics were manually labeled (see Table 2). Statements under Campaign (Topic 4) pertain directly to election-related matters (e.g., performance of candidates in the polls). Topics such as Immigration, Healthcare, and the Clinton controversy were issues of high salience during the 2016 election.
LDA-classified topics and keywords for all fact-checks.

Note: *These are manually-generated labels; **The keys correspond to the 10 most frequently occurring terms under each topic.
In Figure 3, the 7 LDA-classified topics are on the x-axis and the level of attention dedicated to each topic is plotted on the y-axis. The proportion of Nonoverlap and Overlap/Murky statements within each topic area is represented in black and grey, respectively. Politifact’s fact-checks are evenly distributed across topics; Fact Checker focuses more on salient topics, such as the Clinton controversy and Healthcare.

Proportion of fact-checks by topic.
Next, to determine whether or not fact-checkers tended to agree more often or less often in certain topic areas, I used the trained LDA to assign topic probability to 77 pairs of Overlap statements and 56 pairs of Murky statements. Each pair consists of direct quotations of political statements that were fact-checked by both Politifact and Fact Checker. Unlike the previous set of texts used to train the LDA, the new set does not include the fact-checkers’ evaluation of the statements to ensure that the two statements in a pair are assigned to a single topic. I then computed the consensus rate for Overlap statements by topic (see Tables 3a and 3b).
Consensus rates, Overlap statements only.

Consensus rates, Overlap and Murky statements.

Cohen’s κ coefficients were computed by topic area for both samples: an Overlap-only sample (Table 3a) and an Overlap/Murky sample (Table 3b). The number of statements under each topic is very small. For Immigration, Campaign, and Economy-related statements, weighted Cohen’s κ coefficients exceed 0.7, a commonly applied standard in intercoder reliability tests. Because these statements usually involve statistical data – such as polling results, the unemployment rate, or the number of refugees – there may have been relatively little room for disagreement between fact-checkers.
Note in particular that weighted κ values for Immigration and Campaign statements are high while intercoder reliability among Social Policy and Healthcare statements are very low (Table 3b). In contrast, both unweighted and weighted κ coefficients are below or close to zero for Social Policy (e.g., candidates’ views on education and job creation policies) and the Clinton controversy statements. Intercoder reliability for the Clinton controversy statements (e.g., the email controversy and accusations against the Clinton Foundation) may be particularly low due to the nature of the controversy itself. In many cases, while both fact-checkers agreed that the statement was inaccurate, they disagreed on how inaccurate it was, and this resulted in discrepancies in the ratings.
Conclusions
In the context of political claims and statements, I have examined two of the main factors which fact-checkers suggest make fact-checking powerful: (a) large overlap; and (b) high consensus rate among major fact-checkers. My findings suggest that fact-checkers rarely fact-check the same statement and, when they do, the rate of agreement on its factual accuracy is quite low for statements in the relatively ambiguous scoring range (i.e., “Half True” or “Mostly False”). Relative to outright falsehoods or obvious truths, these statements are likely to be carefully crafted, subtle forms of deceptive remarks. This is where fact-checking has the most to offer to the public, but this is the scoring range in which they struggle the most. The surprisingly low rate at which different fact checkers agreed when evaluating the same statements in this scoring range suggests that providing objective information about candidates’ honesty is quite difficult.
To serve better as a second pair of eyes for one another, I would argue that fact-checkers should be more specific about what they define as “factcheck-worthy.” Using a more specific definition of “factcheck-worthy” may enable multiple fact-checkers to fact-check a common set of key political claims more frequently. As a result, readers would benefit from having multiple fact-checkers independently evaluate the same statement. Furthermore, although fact-checkers do not use directly comparable scales, they could improve consistency in their ratings by simply reporting the types of logical fallacies without assigning scores to these observations.
Improving consistency in how different fact-checkers choose and evaluate political claims will make fact-checking more effective, and thereby help fact-checkers fulfill the democratically ideal role of the political watchdog by (ideally) preventing political lying.
Supplemental Material
appendix – Supplemental material for Checking how fact-checkers check
Supplemental material, appendix for Checking how fact-checkers check by Chloe Lim in Research & Politics
Footnotes
Acknowledgements
For comments and advice, the author thanks Andrew Hall, Justin Grimmer, Glenn Kessler, Brendan Nyhan, Michelle Amazeen, Bryan White, Anthony Fowler, Gary King, Sean Westwood, Shanto Iyengar, James Hamilton, discussants at Stanford Political Economy Breakfast and discussion participants at the APSA 2017 Promise of Fact-checking panel. For data collection, the author thanks Shawn Lim.
Declaration of conflicting interest
The author(s) declared no potential conflicts of interest with respect to the research, authorship, and/or publication of this article.
Funding
The author(s) received no financial support for the research, authorship, and/or publication of this article.
Supplementary material
The supplementary files are available at: http://journals.sagepub.com/doi/suppl/10.1177/2053168018786848. The replication files are available at: ![]()
Notes
Carnegie Corporation of New York Grant
This publication was made possible (in part) by a grant from the Carnegie Corporation of New York. The statements made and views expressed are solely the responsibility of the author.
References
Supplementary Material
Please find the following supplemental material available below.
For Open Access articles published under a Creative Commons License, all supplemental material carries the same license as the article it is associated with.
For non-Open Access articles published, all supplemental material carries a non-exclusive license, and permission requests for re-use of supplemental material or any part of supplemental material shall be sent directly to the copyright owner as specified in the copyright notice associated with the article.