
Abstract
One of the focal points of social networks research has been the process by which individuals utilize information and cues from their social networks and communities to form political attitudes and make decisions about how and when to participate in politics. Not all individuals, however, have large social networks or are strongly connected to their local social environments. Furthermore, despite concerns about rising social isolation in American society, the role that relatively socially disconnected individuals play in politics is not well understood. Using a nationally representative data set with information about communities, social networks, and individual-level variables, this paper examines social connectedness and political behavior. Those who are more socially isolated, it is found, are neither more conservative nor liberal on any particular political issues, but clearly participate in politics less than individuals who are well connected to those around them. Finally, while individual political ideology is not correlated with isolation, the contextual influence of the local environment on individual preferences is correlated with social connectedness. When compared with well connected citizens, individuals who are more isolated are less likely to have their vote choices influenced by those around them. Individual social connectedness conditions the effect of contextual social influence.
Introduction: contextual influence and political attitudes
In recent years, scholars have again grown concerned about a rise in social isolation in American life (McPherson et al., 2006; Olds and Schwartz, 2009; Turkle, 2011). While the question of whether Americans are actually more isolated or not is up for debate (Fischer, 2011; Paik and Sanchagrin, 2013), these worries stem from uncertainty about what increased social isolation could mean for American society and politics at large. Some are concerned about what civic disengagement could portend for social capital and the health of American civic life (Putnam, 2001), while others wonder what it means for the society’s ability to provide public goods (Chakravarty and Fonseca, 2014). Still others are concerned about what role social isolation plays in the health and psychological well-being of citizens (Cacioppo and Hawkley, 2003; House, 2001).
Despite these concerns, however, the role that social isolation plays in political behavior at an individual level is not well understood. Interpersonal social network ties play an important role in a wide variety of individual political behaviors, choices, and attitudes. Individual social network ties help individuals overcome costs to acquiring political information (Downs, 1957), learn from experts (Huckfeldt, 2001), and persuade others to vote (Bond et al., 2012). Networks even influence how individuals think about politics (Beck, 2002; McPhee et al., 1963) and political discussion in social networks helps explain individual levels of political participation (McClurg, 2003). Perhaps most importantly, social networks act as a bridge between individuals and their communities. Local communities and attitudes have a noted impact on the development of attitudes and behavior of individuals living in those places (Granovetter, 1985). This is the case, as well, with regard to public opinion, vote choices, and political attitudes. The attitudes of people who we live near in our communities and local contexts go a long way toward influencing our interests as well as shaping our opinions (Huckfeldt, 1986; Huckfeldt and Sprague, 1995).
The interaction of political behavior, social isolation, and social behavior, however, has been overlooked. Social communication is the main avenue by which the opinions of those around us reach us, yet as is readily apparent, the social networks that allow this communication to happen do not evenly connect everyone in a population or location. There is noteworthy variance among the social connectedness of citizens; some individuals, by choice or happenstance, remain largely disconnected from their surroundings. Significant work has been done on the contextual effects on individual behavior, but these contexts influence individuals primarily through the people they are connected to in those places. What happens with individuals who are relatively more socially isolated from their communities? Does social connectedness mediate contextual influence?
This paper aims to begin to answer that puzzle, and approaches the answer through two primary questions. First, it examines the behavioral characteristics of connected (and less connected) individuals in politics. Do those who are less connected differ predictably from those who are more connected, either in political ideology or behavior? Second, it investigates the role that contextual influence plays in the individual political attitudes and behaviors of connected and less connected individuals. Do local communities influence the vote choices of the socially disconnected as well as the socially connected?
In the first question, the data reveal few differences between well-connected individuals and less connected individuals when it comes to attitudes, opinions, and ideology. There are, however, significant differences when it comes to participatory political behavior: socially disconnected individuals are much less likely to participate in politics through voting, campaign donations, or talking about politics with others. To the second question, the data show that social connectedness plays an important mediating role in contextual influences on citizens’ votes. While socially connected individuals are likely to have their vote preferences influenced by their surrounding citizens – even controlling for their own partisanship – socially isolated individuals show no such pattern. Contextual political influence is conditioned by social connectedness.
Data set
To gain leverage on these questions, a nationally representative data set with measures for the respondent’s individual behavior, the respondent’s social network, and the respondent’s broader local community is required. The American module of the 1992 Cross National Election Study (CNES-A) meets these requirements with an unusual sampling mechanism – a stratified cluster sample where the primary sampling units are counties (Beck et al., 2000). The 1992 CNES-A survey had two waves of sampling. First, two groups of 20 counties each were selected. Then, within those counties, approximately 33 individuals were then selected, per county, by random digit dialing. The data set that results is nationally representative and naturally self-weighting. In addition, the data set provides information on both individual respondents and, through large enough samples of individuals within each sampled county, information on county attitudes and local context as well.
Of particular help to this study, the 1992 CNES-A also contained a networks battery and name generator, which asked individuals to provide information for up to five individuals with whom they commonly discussed either “important matters” or “politics.” This measure, which can also be referred to as network size, gives us our primary measure of social connectedness. Individuals who identified more discussants in their lives are more socially connected – and less socially isolated – than those who identified fewer. In the CNES-A, there is a maximum of five identified discussants and a minimum of zero, and the data set has a reasonable distribution of values: 9% of individuals reported having no discussants, 18% reported having one, 15% reported having two, 19% reported having three, 18% reported having four, and 22% reported having five people with whom they discussed politics or important matters.
Social isolation and behavior
The 1992 CNES-A contains core questions on political ideology, partisanship, voting (both choice and turnout), as well as a battery of questions on political viewpoints (including questions on support for affirmative action, the environment, national health care, abortion, and partisanship) and broader political participation (including whether or not someone had attempted to influence another’s vote, whether they had performed campaign work, whether they had attended political meetings, whether they had had a bumper sticker or yard sign, and whether they had donated money).
Table 1 shows the breakdown of voting, ideology, political attitudes, and behavior by social connectedness. Higher percentages indicate the percentage of individuals in that category that supported the more liberal position on issue stances, as well as the percentage participating in a given form of political activity. For example, of those individuals who reported no social connections, 48% supported affirmative action, 34% supported environmental regulation, 64% supported health care reform, 75% were pro-choice, and 24% attempted to persuade another’s vote. In the case of ideology and partisanship, the data are shown as the average response on a 0 to 1 scale, with 1 indicating most Democratic/liberal response and 0 the most Republican/conservative response. Thus, 0.54 indicates a slightly more Democratic or liberal group, while a 0.46 would indicate a slightly more Republican or conservative group.
Political ideology and behavior by social connectedness.
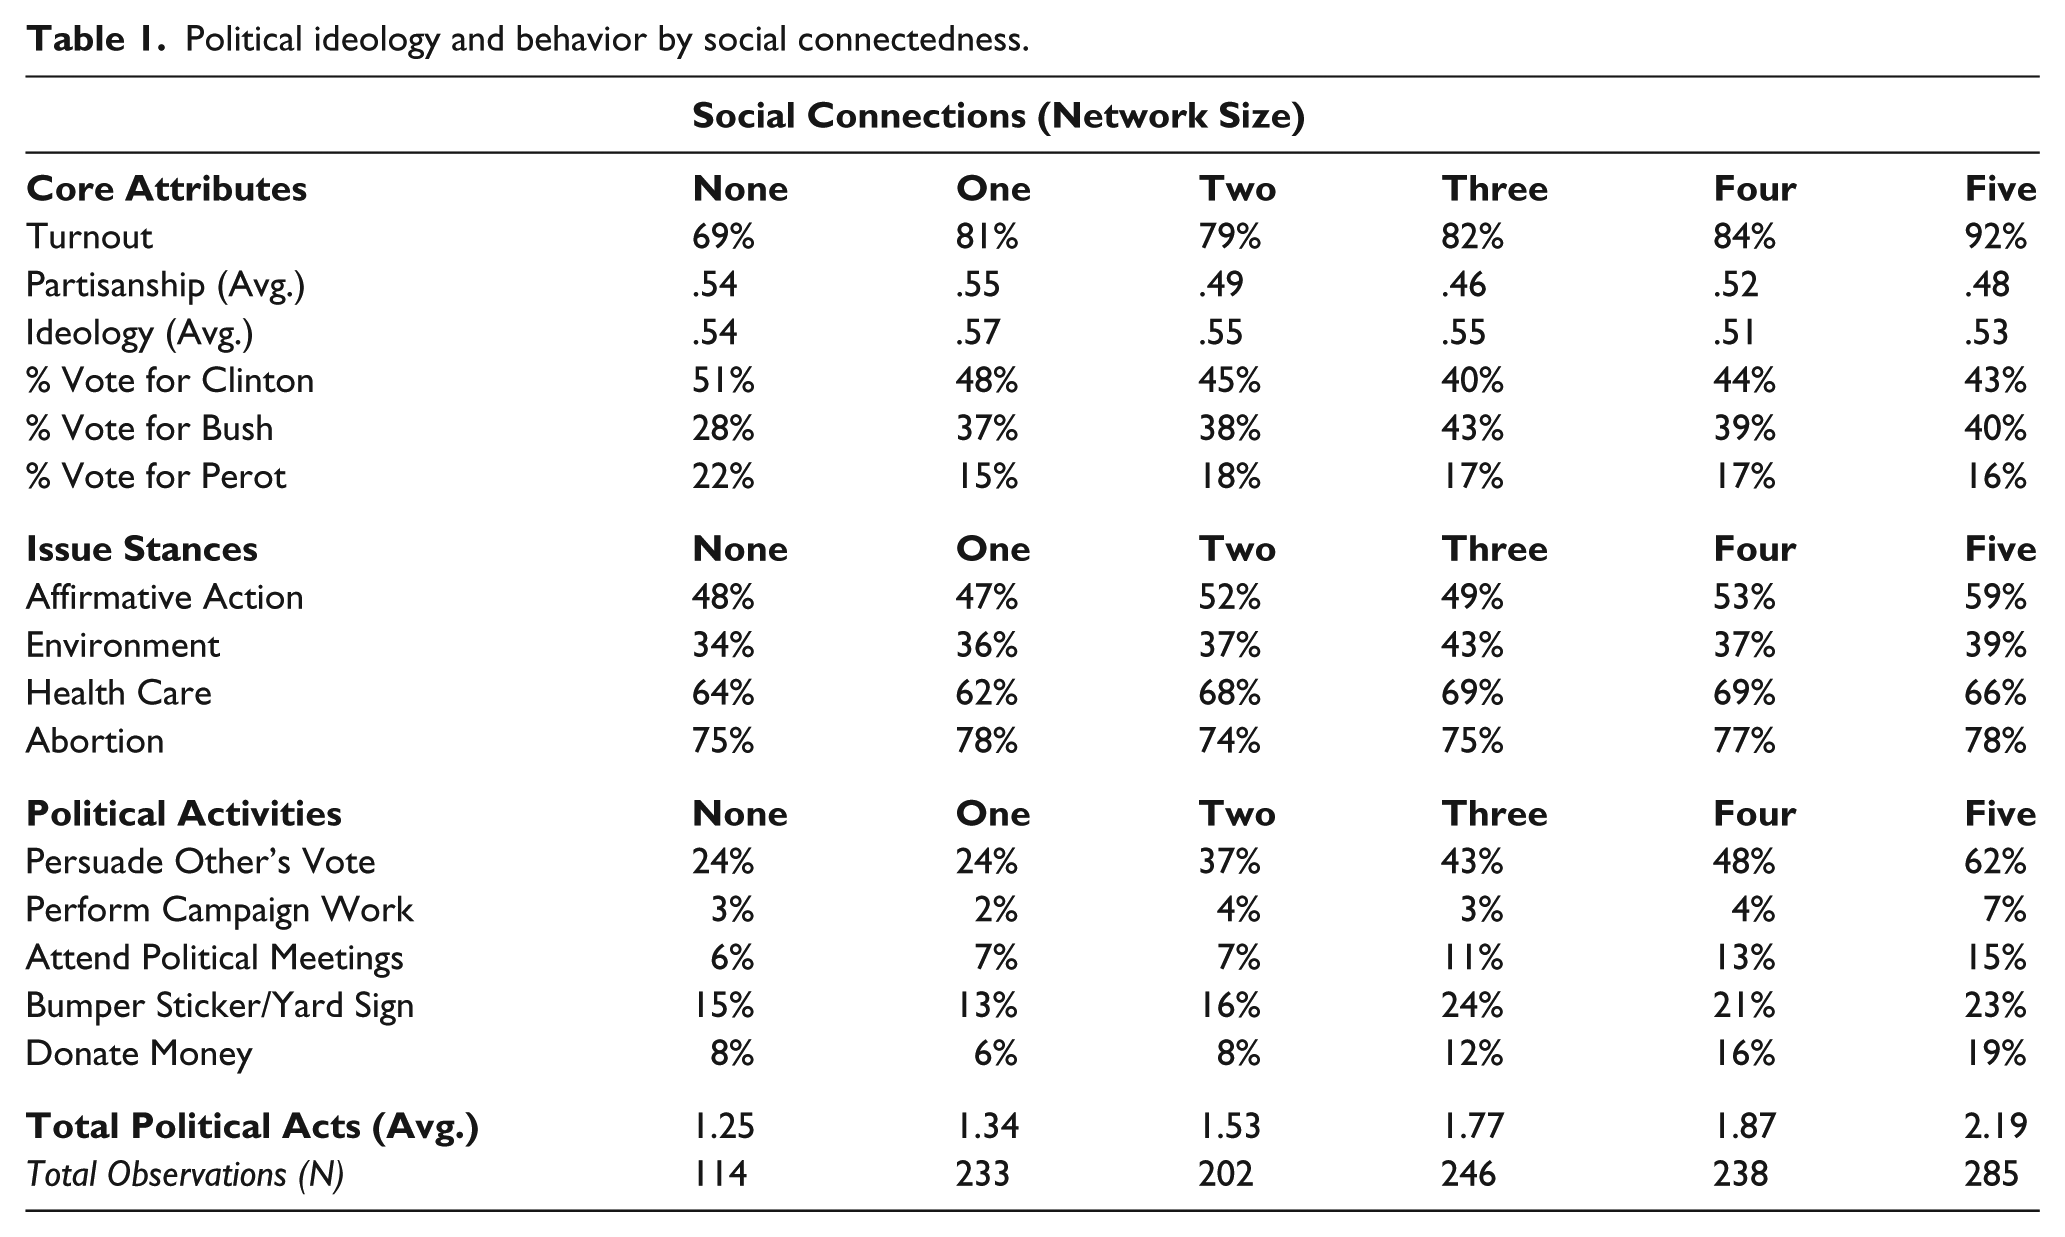
What is most notable about these data is that participation in political activities appears to vary more with social connectedness than political attitudes. Within core behavior, only turnout appears to change (and grow) with network size; partisanship and ideology do not. Support for – or opposition to – various political positions does not generally appear to vary greatly by level of social connection. In contrast, participation in politics appears to vary significantly across levels of social connection. For instance, while only 24% of individuals who reported no or only one important connection tried to influence someone else’s vote, a full 62% of individuals who listed five important connections attempted to influence another’s vote. Other measures do not show quite the same dramatic change as the first, but all move in the same, expected direction: higher levels of social connection are associated with higher levels of participation. When compared to those without reported social connections, highly socially connected individuals’ turnout rates are 24 percentage points higher. Furthermore, highly connected individuals are twice as likely to report donating money to a political cause, are more likely to have signage supporting one candidate or another, and are almost three times as likely to attend political meetings than people who reported no important social connections.
In other words, while level of social connection appears to have no clear correlation with support for liberal or conservative values, it does appear to predict level of political activity. For a more conclusive examination of this phenomenon, we placed each issue or activity as the dependent variable in a logistic regression model, attempting to predict support for the issue position or participation in political activity as a function of social connection, interest in politics, and a variety of demographic control variables. The estimation equation is given by:

Figure 1 compares the estimated coefficients for “connectedness” across each dependent variable. 1 As can be seen from looking at each model, while a variety of demographic explanatory variables gain purchase on ideological positions, there is no case in which the level of social connectedness has any significantly distinguishable association with political attitudes, ideology, or even vote choice. On the other hand, there is a clear statistical relationship between social connectedness and participation. Those who are more connected are more likely to turn out to vote, to attempt to influence another’s vote, to go to political meetings, to display yard signs, and to donate money to politics. Furthermore, substantively, the point estimates for each behavioral activity are clearly higher than for the attitudinal point estimates, with vote persuasion and total political acts performed being particularly driven by social connectedness. 2 The more an individual reports having people they talk to frequently, the more likely they are to report participation in politics. Yet, even as they participate more, the political preferences of those who are more connected are likely to be not significantly different from those who are more isolated.

Social connectedness predicts political activity but not ideology and attitudes.
This speaks to a few different phenomena. First, this makes clear sense, intuitively: if an individual is less social, it is understandable that they would be less likely to take part in other largely social behaviors such as attending political meetings or turning out to vote. We do not, however, need to be concerned that this differential participation level systematically hinders, or leads to less representation, of one side of the political spectrum or the other. Social isolation, broadly speaking, is orthogonal to political viewpoint.
Social isolation and contextual influence
So far, the data reveal a clear difference along levels of social connectedness and participatory behavior, but no such differences between social connectedness and political opinions. This is only part of the analysis, though. Social isolation may lead not just to different levels of participation, but could lead to different levels of social influence between voters as well. Even if there is no relationship between social connectedness and political attitudes, might the political choices of those who are more connected be more or less influenced by their surrounding contexts relative to those who are less connected? To be specific, could we find that those who interact less with their surroundings are also less likely to be influenced by those in their local communities and contexts?
In answering this question, we formulate a hypothesis strongly influenced by Miller (1956). Miller, examining the pattern of one party dominance in numerous regions in American politics and the existence of so many “safe” electoral districts for representatives, argued that votes for political candidates, as well as the level of political organization of parties in districts, were strongly influenced by the partisan context of the counties in which those parties are located. In other words, Democrats in strongly Democratic counties were much more likely to vote for Democratic candidates than Democrats in strongly Republican counties. Furthermore, the pattern for Republicans was identical to that for Democrats: Republicans in Democratic counties were much more likely to vote for Democrats, and Republicans in heavily Republican counties were much more likely to vote for Republicans.
For this process to work effectively, however, individual voters must talk to other people in their counties – and an individual’s level of social connection should mediate the extent to which their county influences their vote. In other words, even when controlling for party identification, individuals in Democratic counties will be more likely to vote for Clinton, and individuals in Republican counties will be more likely to vote for Bush, but this is the case only if they are well connected socially. Formally stated, the hypothesis takes the following form:
The statistical model
To examine the voting influence hypothesis, we turn to an interactive contextual analysis model first proposed by Boyd and Iversen (1979). This model allows for the explicit conditioning of individual level factors on a dependent variable with contextual variation. At its base, the model considers variables operating at both the individual level (connectedness, partisanship, education, income, race, ethnicity, and gender) and contextual level (county partisan lean). We begin by modifying Equation 1, modeling vote choice as a function of a series of individual covariates and adding contextual partisan lean:

To this, we add an interaction term, allowing us to examine the effect of county partisan lean as contingent upon individual social connectedness:

The 1992 election poses some unique modeling decisions when examining vote choice, as Ross Perot accrued roughly 19% of the popular vote. While most United States elections can be modeled with a binary logit, Perot voters prevent us from doing the same here. Rather than treating the dependent variable as categorical, which would force the use of a multinomial logit estimation strategy and more difficult interpretation of our interactive terms in particular, or dropping Perot entirely, which is unappealing, we treat the dependent variable as ordinal, with Perot falling in between Clinton and Bush on the scale. Such treatment is justified both on the grounds of the data, with large numbers of Perot voters identifying as political independents (49.7%) or as ideological moderates (66.1%), as well as on the grounds of research into the 1992 campaign itself, which reveals Perot voters were generally moderates in favor of change and evenly split between Clinton and Bush as their second-choice candidate (Stone and Rapoport, 2008).
Similar concerns crop up for the calculation of county lean. While district lean could ordinarily be approximated as a proportion of the two-party vote, Perot again makes this more complicated. Results presented here use an average of the three-candidate vote in each county, with Clinton voters coded “1”, Perot voters coded “0”, and Bush voters coded “-1”. The resulting “county lean” variable ranges from -0.39 to 0.59, with higher positive numbers indicating a heavily Clinton county and numbers closer to -1 indicating a heavily Bush county.
Results
Table 2 displays the results of the logistic regression in Equation 3 and Figure 2 illustrates the marginal effect of county lean on individual vote choices when conditioned by social connectedness. In general, we can see that the magnitude of the contextual effect upon individual viewpoints increases as social connectedness increases. The more socially connected an individual is, the more likely they are to have their vote influenced by others in their county. In fact, the estimates reveal that we cannot be certain that the surrounding county has any effect on individual vote choices when an individual is socially disconnected, while the effect of county at the highest level of connectedness is statistically significantly different from zero (p < 0.0001) and clearly statistically differentiable from the effect of county for those who are highly socially disconnected (p < 0.025).
Social connectedness conditions contextual influence.

Note: *** p < 0.001; **p < 0.01; *p < 0.05; °p < 0.1.

Social connectedness conditions contextual influence.
For easier substantive interpretation of the results, Table 3 displays predicted probabilities for individual vote choices by connectedness and county votes. To create these probabilities, all variables are set at their means (or modes, in the case of categorical variables). The “average” individual in the data has approximately three connections, is in a county split between voting for Clinton and Bush, has an average level of education and income, and is an independent white female. This individual has a 0.41 probability of voting for Clinton, a 0.32 probability of voting for Bush, and a 0.27 probability of voting for Perot.
Predicted vote probabilities by social connectedness and county lean.

Note: rows may not add up to 1 because of rounding.
In contrast, if we take this mean individual, but remove their connections and place them in the most Clinton-leaning county in the sample, they have a 0.49 probability of voting for Clinton, a 0.25 probability of voting for Bush, and a 0.25 probability of voting for Perot – not a significant change from the individual in an average voting county. Moving this isolated individual from the most Clinton-leaning county in the sample to the most Bush-leaning county corresponds to a slight increase in probability of voting for Bush (up to a 0.33 probability, from a 0.25 probability) and a corresponding slight decrease in probability of voting for Clinton (a 0.40 chance, down from 0.49), and almost no change in the chance of voting for Perot (0.27). However, if we consider the probabilities associated with highly connected individuals, the magnitude of the change is dramatically higher. A highly connected individual in a Clinton-leaning county has a 0.72 chance of voting for Clinton, a 0.12 chance of voting for Bush, and a 0.17 chance of voting for Perot. Moving this well connected individual to a Bush-leaning county shifts these probabilities significantly. They now have merely a 0.16 chance of voting for Clinton (a change in probability of 0.56), and notable 0.64 probability of voting for Bush (a change in probability of 0.52), and a similar probability of voting for Perot (0.21).
This swing for highly connected individuals – a probabilistic change of more than 0.5 in the probability of voting for the Democratic or Republican candidate for president – is much higher than the shift for socially isolated individuals when making the same contextual change, which was less than 0.1 in vote probability. Social connection clearly is not everything – isolates and socialites alike remain influenced by their income, race, and so on and so forth – but these changes are dramatic and, it must be noted, are significant even when controlling for individual respondent party identification. Social isolation, and social connectedness, appear to play an important role in the level of contextual social influence between and among individuals.
Discussion
These results are highly suggestive of contextual influence being conditioned by social connectedness – those who are highly connected are more likely to show evidence of having been influenced by the political preferences of those surrounding them than those who are more socially isolated. Yet there remains a question of causality here common to many cross-sectional studies of contextual influence. How can we be sure that all these individuals’ votes are being influenced by their county? In short, this approach rests on the idea that contexts socialize and influence individuals inside them – but there are other reasons why we might see this relationship even if no contextual influence was present. What if, rather than socialization, this finding is entirely about selection, and people choosing other like-minded people to live around, directly or indirectly? Or what if it turns out that more homogenous counties are more socially connected, either through happenstance or because more homogenous counties present greater opportunities for agreeable social interaction?
Such criticisms take on perhaps an even more significant importance in light of the increasing ideological sorting, especially between urban and rural areas, that has appeared in the American electorate in the last few elections. Scholars have, however, cast doubt on the first criticism – the idea of a pure selection hypothesis. Brown (1988), for instance, examined respondents’ migratory experience across the United States. Not only does Brown find little evidence for direct partisan sorting among the electorate – citizens did not choose their new locations based on political preferences – but even when controlling for past migratory experience, he found citizens’ political preferences were influenced by their new locales. “Occupational and family considerations” were much more likely the driving force behind relocation, he found – not political considerations. The second concern, that more politically homogenous counties are more socially connected, can be addressed directly. In the data used for this article, we found no significant correlation between county homogeneity and social connectedness, either at the individual or average county level. 3
Conclusion
There are three primary conclusions supported by this paper:
Social connectedness does not appear to be related to any ideologically driven aspect of political behavior, whether that be attitudes, ideology, partisanship, or vote preference.
Social connectedness is related to participatory political acts. This especially includes likelihood of attempting to influence another’s vote, but extends to almost all aspects of political participation: turnout, attendance at political meetings, posting of yard signs and bumper stickers, contributing money to political causes, and likely participation in campaigns. Those with more social ties are more likely to participate in politics.
Those who are more socially connected are much more susceptible to contextual influence from their surrounding political environments. They are more likely to vote with their neighbors than those who are socially isolated.
What do we make of such differences in activity and influence between the socially isolated and the well connected? At first blush, we do not have to worry about a side of the left–right spectrum being left out of the representative mix. Even though social connectedness is correlated with participation in politics, those who are socially isolated – and participate less – are no more likely to be Democrats or Republicans, nor are they more likely to be conservatives or liberals. This should not indicate, however, that we will never have to worry about such disproportionate representation between the more social and the non-social, especially as technology and the internet change the nature of interpersonal social interaction. If, in the future, we discover further strong evidence of increasing isolation in American life, it may well be worth revisiting these questions with finer granularity.
Footnotes
Acknowledgements
The author thanks Robert Huckfeldt and two anonymous reviewers for helpful comments on earlier drafts of this paper, as well as Mollie Saumier for assistance in preparation of the manuscript.
Declaration of Conflicting Interest
The author declares that there is no conflict of interest.
Funding
This research received no specific grant from any funding agency in the public, commercial, or not-for-profit sectors.
Supplementary Materials
Notes
Carnegie Corporation of New York Grant
This publication was made possible (in part) by a grant from Carnegie Corporation of New York. The statements made and views expressed are solely the responsibility of the author.
References
Supplementary Material
Please find the following supplemental material available below.
For Open Access articles published under a Creative Commons License, all supplemental material carries the same license as the article it is associated with.
For non-Open Access articles published, all supplemental material carries a non-exclusive license, and permission requests for re-use of supplemental material or any part of supplemental material shall be sent directly to the copyright owner as specified in the copyright notice associated with the article.