
Abstract
The Issues and Leaders model predicts the national popular two-party vote in US presidential elections from people’s perceptions of the candidates’ issue-handling competence and leadership qualities. In previous elections from 1972 to 2012, the model’s Election Eve forecasts missed the actual vote shares by, on average, little more than one percentage point and thus reduced the error of the Gallup pre-election poll by 30%. This research note presents the model’s forecast prior to the 2016 election, when most polls show that voters view Republican candidate Donald Trump as the stronger leader but prefer the Democrat’s nominee Hillary Clinton when it comes to dealing with the issues. A month prior to Election Day, the model predicts that Clinton will win by four points, gaining 52.0% of the two-party vote.
Standard voting theories commonly assume that both long-term and short-term forces affect people’s vote choice (Campbell et al., 1960; Clarke et al., 2011; Lewis-Beck et al., 2008). In 2012, I built on these ideas to develop the “Issues and Leaders” model, which particularly focuses on the short-term factors – namely the candidates’ perceived issue-handling competences and leadership qualities – to predict the national two-party popular vote in US presidential elections (Graefe, 2013). Simply put, the model assumes that candidates have an advantage if voters, first, expect them to do a better job in dealing with the issues and, second, perceive them as the stronger leader. Third, the model assumes that a certain share of the electorate does not evaluate candidates along these lines but always votes according to long-term forces such as socio-demographic background and party identification.
If voters favor a candidate on both issues and leadership, the model’s outcome is clear: it predicts that candidate to win. But what if voters’ views are divided, which is the situation we are facing prior to the 2016 election, when most polls show that voters view Trump as the stronger leader but prefer Clinton when it comes to dealing with issues.
Usually, voters favor a candidate on both issues and leadership. Therefore, historical evidence to answer the question is sparse. As shown in Table 1, voters’ views on Election Eve were divided in only three elections since 1972, which is the earliest election for which data are available. In 1976, 1992, and 2000, the Democratic candidates (i.e. Carter, Clinton, and Gore) were favored on the issues, whereas their Republican opponents (i.e. Ford, George HW Bush, and George W Bush) were perceived as the stronger leaders. Each time, the candidate favored on the issues eventually won the popular vote (Gore lost the electoral vote), which indicates that issues-handling competence might be more important for vote choice than leadership perceptions. But by how much?
Model forecasts and variables (1972–2016).

Forecasts for elections from 1972 to 2012 are in-sample. The 2016 forecast is ex ante, based on polling numbers available through 10 October 2016.
This research note analyzes the situation prior to the 2016 election and presents the forecast from the Issues and Leaders model. First, I briefly review the model’s past accuracy. Second, I describe the model specification and underlying data before, third, presenting the latest forecast. Finally, fourth, I discuss factors that might still influence the forecast.
Past performance
Thus far, the model has only been used to predict the 2012 election, during which it provided accurate forecasts (Graefe, 2013). But judging a model’s accuracy based on a single election is, of course, problematic. Table 1 thus shows the model’s in-sample forecasts for the elections from 1972 to 2012, calculated on Election Eve. Across the 11 elections, the model’s average error was only 0.7 percentage points.
Graefe (2013) provided additional evidence in calculating quasi ex ante forecasts for the five elections from 1996 to 2012. These predictions cannot be considered true forecasts, since they were not issued at the time of each particular election. They were, however, calculated using only data that would have been available at the time and thus provide the most realistic estimate. For instance, to predict the 2012 election, data on the 10 elections from 1972 to 2008 were used, for the 2008 election, data on the nine elections from 1972 to 2004 were used, and so on. Thus, when predicting the 1996 elections, only six data points were available. This procedure of simulating ex ante forecasts, also known as “successive updating” or “step-ahead” method, is a standard practice for evaluating the accuracy of forecast models after the fact (Lewis-Beck, 2005). Across the five elections in that time period, the model’s long-term forecasts – calculated three to two months prior to Election Day – were competitive with those from the most accurate political economy models. Furthermore, accuracy generally improved as the election neared, as more polling information became available. On average, across the five elections, the final forecasts calculated on Election Eve missed the actual vote shares by little more than one percentage point. To put this in perspective, the average error of the final Gallup poll was more than three times higher.
Model specification
The model uses multiple linear regression analysis to estimate a vote equation from two variables. The issues score captures the candidates’ issue-handling competence, whereas the leadership score measures their expected performance as leaders. A detailed description of the model would go beyond the scope of this research note. Hence, this section only briefly describes the operationalization of the variables and the resulting vote equation. Since the model has remained unchanged, however, readers find all details in Graefe (2013). In addition, all data and calculations are publicly available (Graefe, 2016).
Issues score
An issue influences vote choice if three conditions are met (Campbell et al., 1960): first, the voter is aware of the issue; second, the issue is of some importance to her; and, third, she expects one party to do a better job in handling the issue than the other parties.
I use answers to issue-salience questions to operationalize the first two conditions. These common poll questions ask voters which issue they regard as most important (e.g. “What do you think is the most important problem facing this country today?”). I then assign each issue to one of three categories (economic, foreign, and other) and calculate the percentage of mentions per category to determine their relative importance. At the time of writing, 38% of the issues voters name as most important are economic issues, 34% relate to foreign policy, and 28% are other issues (Table 1).
In order to operationalize the third condition, I collect results from issue-handling competence questions, which ask people which candidate they expect to do the better job in handling a particular issue (e.g. “Please tell me if you think Hillary Clinton or Donald Trump would better handle each of the following issues. How about the economy?”) For each issue, I then calculate the incumbent party candidate’s two-party support before again categorizing the issue as either economic, foreign, or other. Then, I average the incumbent’s support across all issues in each category. At the time of writing, voters clearly favor Clinton for foreign (58% to 42%) and other (57% to 43%) issues, but expect her to perform slightly less well than Trump on economic issues (49% to 51%).
Finally, I calculate the weighted average of the incumbent’s voter support per category and the categories’ relative importance. The resulting number is referred to as the issues score, which is currently 54.2% for Clinton. I update the score whenever new information on either issue-salience or issue-handling competence become available. Thereby, I use exponential smoothing by assigning a weight of 70% to the most recent data in order to reduce the impact of single polls.
Leadership score
Standard voting theories assume that elections are choices between candidates, and prior work shows that leadership is an important factor in people’s evaluations of candidates. I build on this knowledge to include candidate evaluations in the model. In particular, I use information from a polling question that asks people who they think would be the better leader (e.g. “Regardless of how you intend to vote, who do you think is a stronger leader: Hillary Clinton or Donald Trump?”). As with issue-handling questions, I calculate the incumbent party candidate’s two-party support, which I refer to as the leadership score. Currently, Clinton’s leader score is 49.6% (vs. 50.4%) for Trump. As with the issue score, I use exponential smoothing to reduce the impact of single polls.
Vote equation
Historical data to calculate issue and leadership scores are available since 1972. Using the final issue (I) and leadership (L) scores on the last day before each election (t = 1) and running a multiple regression analysis with the incumbent’s actual two-party popular vote share (V) yields the following vote equation
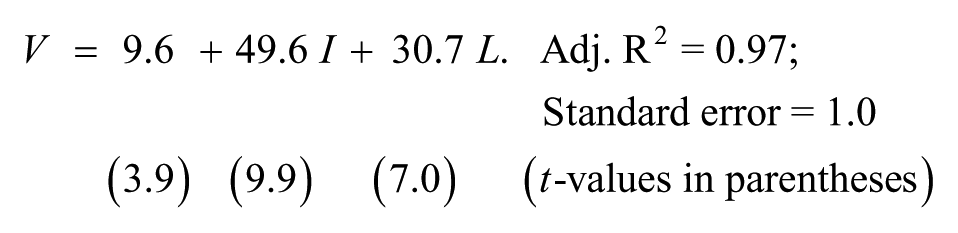
That is, on Election Eve, the model predicts the incumbent party candidate to start out with 9.6% of the two-party vote. In addition, the incumbent can gain votes depending on his perceived issue-handling competence and leadership quality. For instance, an increase in the incumbent’s issue score of 10 percentage points would increase the incumbent’s vote-share by 5 percentage points.
The two independent variables capture voters that either decide based on issues and candidates or align their perceptions of issues and candidates with their party identification, or a mix of both strategies. Logically, then, the intercept captures the share of the electorate that does not pay attention to candidates and issues at all. The model’s implicit assumption then is that these people’s vote choice is determined solely by long-term forces (e.g. socio-economics, party identification).
Since the above vote equation is estimated from Election Eve data, it produces a so-called “nowcast.” That is, it can be used to calculate a forecast of what would happen if the election were held today, given the latest issues and leader scores.
When calculating long-term forecasts, however, one has to take into account how the relative importance of issue-handling competence and leadership changes over the course of the campaign. Graefe (2013) analyzed how the model’s intercept and variable coefficients change over time by estimating a vote equation for each of the last 100 days prior to the election, using the timeline method (e.g. Jennings and Wlezien, 2016). Early in the campaign (i.e. about three months prior to the election), issue-handling competence, leadership scores, and party identification (i.e. the intercept) are of roughly equal importance. Yet, as the election comes closer, the share of those who decide exclusively based on party identification decreases, while the influence of the issues score, and to a lesser extent the leadership score, increases. Furthermore, the analysis revealed the importance of conventions and debates, which substantially affected the model coefficients.
While regression coefficients can provide valuable insights when explaining patterns in past data, they often do not perform well when predicting new data (Graefe, 2015). Therefore, I do not rely on these “optimal” coefficients when making ex ante forecasts, but rather use the linear trend (shown in Figure 1) for both the model intercept and variable coefficients. The rationale behind this is to be conservative and to acknowledge uncertainty when making predictions, for example, due to estimation or measurement error (Armstrong et al., 2015). For instance, comparing issue and leader scores across elections is difficult since both the availability of polling data as well as the timing of key events varies across elections.

Development of model coefficients over the last 100 days before the election.
2016 forecast
Table 1 shows the latest model’s forecast for Hillary Clinton, the incumbent party’s candidate. At the time of writing (10 October 2016), entering the latest issues and leadership scores into the vote equation for that particular time in the campaign yields vote shares of 52.1% for Clinton and 47.9% for Trump.
In visualizing Clinton’s lead in the two-party vote, Figure 2 shows how the forecast has developed over time. Since its first publication on 5 June, the forecast (solid line) has remained remarkably stable. In particular, Clinton’s predicted lead never went below 2.7 points or above 4.8 points. On average, across the complete time period, her lead was 3.9 points, with a standard deviation of only half a point.

Clinton’s predicted lead by the Issues and Leaders model.
The dotted line in Figure 2 shows how the model forecast would develop if no new polling information became available (i.e. solely based on changes in the model coefficients displayed in Figure 1). That is, if Clinton’s issue and leadership scores remained unchanged until Election Eve, the model’s Election Eve forecast would predict her to win by 3.5 points, 51.7% vs. 48.3%.
Discussion
A lot can change until Election Day, especially during the time of the presidential debates. Prior research shows that debates affect how people think – and how much they know – about issues. Debates, for instance, can affect which issues voters regard as important and how they evaluate the candidates’ performance in dealing with an issue (Benoit et al., 2003). The Issues and Leaders model can advise campaign strategists along these lines.
First, candidates should engage in agenda setting by alerting the public to issues that favor them. For example, Clinton should try to put foreign policy and social issues (e.g. affirmative action, health care, education) on the public agenda. Trump, on the other hand, should emphasize economic issues (e.g. job creation, taxes) as well as issues that relate to lobbyism and government regulation.
Second, candidates should try to convince voters that they are better in dealing with an issue than their opponent, or at least reduce the gap if they are perceived as inferior. Yet, for many issues, ownership is linked to party constituency and, thus, difficult to change (Petrocik, 1996). An exception is performance issues, for which issue-ownership changes depending on the context of the election. In 2016, this might include issues such as gun policy and immigration.
Finally, people’s perceptions of the candidates’ leadership qualities might change as well. Trump has been strongly favored in this question until the first debate, which Clinton clearly won. The only leadership question available since then sees Clinton in the lead, which is the reason for her big bump in the model’s forecast in early October.
The Issues and Leaders model provides a useful tool for tracking campaigns. For example, journalists could use the model to assess how issue-salience as well as the candidates’ perceived issue-handling competence and leadership skills affect the election outcome.
Footnotes
Declaration of conflicting interest
None declared.
Funding
This research received no specific grant from any funding agency in the public, commercial, or not-for-profit sectors.
Carnegie Corporation of New York Grant
The open access article processing charge (APC) for this article was waived due to a grant awarded to Research & Politics from Carnegie Corporation of New York under its ‘Bridging the Gap’ initiative. The statements made and views expressed are solely the responsibility of the author.