
Abstract
British political parties select their leaders to win elections. The winning margin of the party leader among the selectorate reflects how likely they think she is to win the General Election. The present research compares the winning margins of party leaders in their party leadership elections and uses the results of this comparison to predict that the party leader with the larger winning margin will become the next Prime Minister. I term this process “the Party Leadership Model”. The model correctly forecasts 8 out of 10 past elections, while making these forecasts 4 years in advance on average. According to a Bayesian analysis, there is a 95 per cent probability that having the larger winning margin in party leadership elections increases the chances of winning the General Election. Because David Cameron performed better among Conservative MPs in 2005 than Ed Miliband did among Labour MPs in 2010, the model predicts Cameron to become Prime Minister again in 2015. The Bayesian calculation puts his chances of re-election at 75 per cent.
Keywords
A British party leader will become the next Prime Minister. Since 1945, every British Prime Minister has been simultaneously the leader of his or her party. Political parties therefore influence who becomes Prime Minister when they select their leaders.
Since 1963, both the Conservative and the Labour party have had formal leadership selection systems, with their Members of Parliament (MPs) voting in the leadership contests. Stark (1996) concludes that a party selects the candidate who best fits its strategic goals, and that in most leadership contests, the party selects the candidate who is most likely to deliver electoral victory. Accordingly, MPs face strong incentives to identify and to vote for the candidate who will lead the party to electoral success because their current job and a possible career in government depend on it. MPs have unique advantages in identifying this candidate because candidates are MPs as well, and MPs experience the qualities of each other in their parliamentary work like nobody else does. Comparing the results of party leadership elections between the two major parties should predict, therefore, which of their leaders becomes Prime Minister.
The present research uses party leadership elections as a form of “citizen forecasting” (e.g. Lewis-Beck and Skalaban, 1989) to predict the General Election. The model compares the performance of party leaders in their leadership elections, and predicts the one with the better performance to become Prime Minister. I term this process “the Party Leadership Model”. When data are sufficiently available to make a forecast, the Party Leadership Model correctly picks the next Prime Minister in all past elections, except in 1970 and 1992. Relying only on party leadership contests allows the model to make a forecast 4 years in advance on average. Because David Cameron won his leadership contest by a larger margin among MPs (16.7 per cent) than Ed Miliband did in his (−6.8 per cent), the Party Leadership Model predicts Cameron to win the Prime Ministership again in 2015. Because the data cover only 10 elections, this research uses Bayesian methods to predict which party leader will become Prime Minister. Results from the estimation process put the probability of a Cameron re-election at 75 per cent.
The paper proceeds as follows. The first section describes the strategic goals of parties when selecting a leader, highlighting that the goal of electoral victory has played a central role in British party leadership elections. The paper then argues that MPs are both motivated to vote for the leadership candidate who is most likely to deliver electoral victory, and able to identify this candidate. Accordingly, the paper claims that the relative performance among MPs in party leadership contests should predict which party leader becomes Prime Minister. After describing the data and the Bayesian approach to analysing them, the paper reviews the forecasting accuracy of the Party Leadership Model in past elections. This review is followed by an application of the model to forecast the 2015 General Election. A final section concludes the paper.
The Party Leadership Model
Strategic goals of parties
Sjöblom (1968) claims that major parties in parliamentary systems follow three strategic goals. In the words of Stark (1996, 125), these three goals are to “retain internal party solidarity as a cohesive organisation” (unity), to “win elections and form a government” (victory) and to “implement programmes” (policy). Sjöblom (1968) ranks these goals by order of importance, highlighting that a higher-order goal is necessary, though insufficient, for achieving a lower-order goal. Internal unity is the first-order goal because voters dislike divided parties and therefore a divided party would stay or end up in opposition. Electoral victory is the second-order goal, because without winning the election and forming the government, the party cannot implement its policy programme, which is its third-order goal.
When a party selects a leader, it needs to consider these strategic goals. The party needs to select the leader who helps to achieve the lowest-ordered goal, as this implies achievement of the higher-ordered goals as well. Accordingly, each selector in the leadership election identifies which candidate he thinks will deliver the lowest-ordered goal and then votes for her. In his analysis of leadership contests between 1963 and 1995, Stark (1996, 126) demonstrates that most of the leadership contests focused on achieving electoral victory. Similarly, in updating Stark’s work to include the leadership elections until 2010, Quinn (2012, 13) finds that recent party leaders were primarily chosen by their electoral appeal.
MPs’ incentives and abilities
Quinn (2012, 16f) argues that the electoral success of the party determines whether and to what extent MPs receive office and policy benefits. If the party performs well in the General Election, an MP in a marginal seat increases his chance of keeping the seat. If the party wins the election and forms the government, it can implement its policies, and most MPs prefer their party’s policies to those of the other party. Moreover, frontbenchers would get promoted from an unpaid shadow cabinet position with little influence to a paid government job with considerable power. MPs have a strong incentive, therefore, to identify and vote for the candidate in the party leadership election who is most likely to lead the party to electoral victory.
In addition to this strong incentive, MPs also have better and more information about the leadership candidates than anybody else. As Stark (1996) and Quinn (2012) emphasise, instead of all party members, parties allow only MPs to stand in leadership elections. Because MPs observe each other in the day-to-day business of their parliamentary work, MPs gain frequent and first-hand information of the candidates. The amount and quality of information that MPs receive about a candidate makes them, therefore, the best judges of her qualities.
Links to citizen forecasting
Based on the incentives and abilities of MPs, the present research uses internal party leadership elections as a form of citizen forecasting to predict the General Election. The “citizen forecasting” approach was pioneered by Lewis-Beck and Skalaban (1989). Several researchers have demonstrated that citizen forecasts accurately predict election outcomes in both US presidential elections and British General Elections (e.g. Lewis-Beck and Skalaban, 1989; Lewis-Beck and Tien, 1999; Lewis-Beck and Stegmaier, 2011; Murr, 2011, 2015; Graefe, 2014). All of these studies find that most elections are won by the party which most citizens said would win.
Murr (2011) explains the accuracy of citizen forecasting with Condorcet’s jury theorem. Condorcet (1994) mathematically proved that if each individual chooses the correct alternative with a probability of greater than 0.5, then the probability that a group deciding by majority rule will choose the correct alternative approaches unity as group size increases to infinity. As Graefe (2014) and Murr (2015) show, the benefits of aggregation emerge even in small groups. For instance, if each member correctly forecasts 60 per cent of the time, then a group with 25 members correctly forecasts 85 per cent of the time.
To sum up, party leadership elections have three key features: first, MPs have a strong incentive to correctly forecast which candidate is most likely to lead the party to electoral victory; second, MPs have more and better information about the candidates’ qualities than anybody else; and, finally, MPs vote in large numbers in party leadership elections and their results are aggregated using a majority rule. In other words, each MP should be better than chance at predicting which candidate will lead the party to electoral victory, and the number of MPs is large enough to manifest the benefits of aggregation. Accordingly, party leadership elections should be a good predictor of the General Election. The following sections test the forecasting accuracy of the Party Leadership Model and provide a forecast for the upcoming 2015 British General Election.
Data and method
Case selection
The data include all contested party leadership elections which are relevant to the General Elections between 1966 and 2015. The data start with the 1966 General Election because since then both leaders of the two major parties are formally elected by MPs. Accordingly, the data include the results of 15 party leadership elections in total. Stark (1996) and Quinn (2012) present excellent accounts of how the selection systems of both parties have changed over time. Both authors also show that the parties’ strategic goals have remained stable and that the changes in selection systems did not affect which leader parties selected most of the time. Nevertheless, to make the cases as comparable as possible across time and between parties, and to maximise the number of included General Elections at the same time, the data limits itself to the election results of MPs.
Measurement
The Party Leadership Model compares the performance in party leadership elections of the Prime Minister and of the leader of the opposition. The measure of performance comes from the voting behaviour of MPs and MEPs (Member of the European Parliament) on their final ballot at the party leadership election. Performance equals the vote share of the elected party leader (vl) minus the vote share of the main contender (vc). The main contender is either the candidate with the next highest vote share, or the one with the leading vote share if the elected party leader did not win the ballot. Table 1, discussed in greater detail below, shows the vote shares of party leaders, their main contenders, and the resulting measure of performance for both major parties.
Performance of Conservative and Labour party leaders in their party leadership election among MPs in per cent.
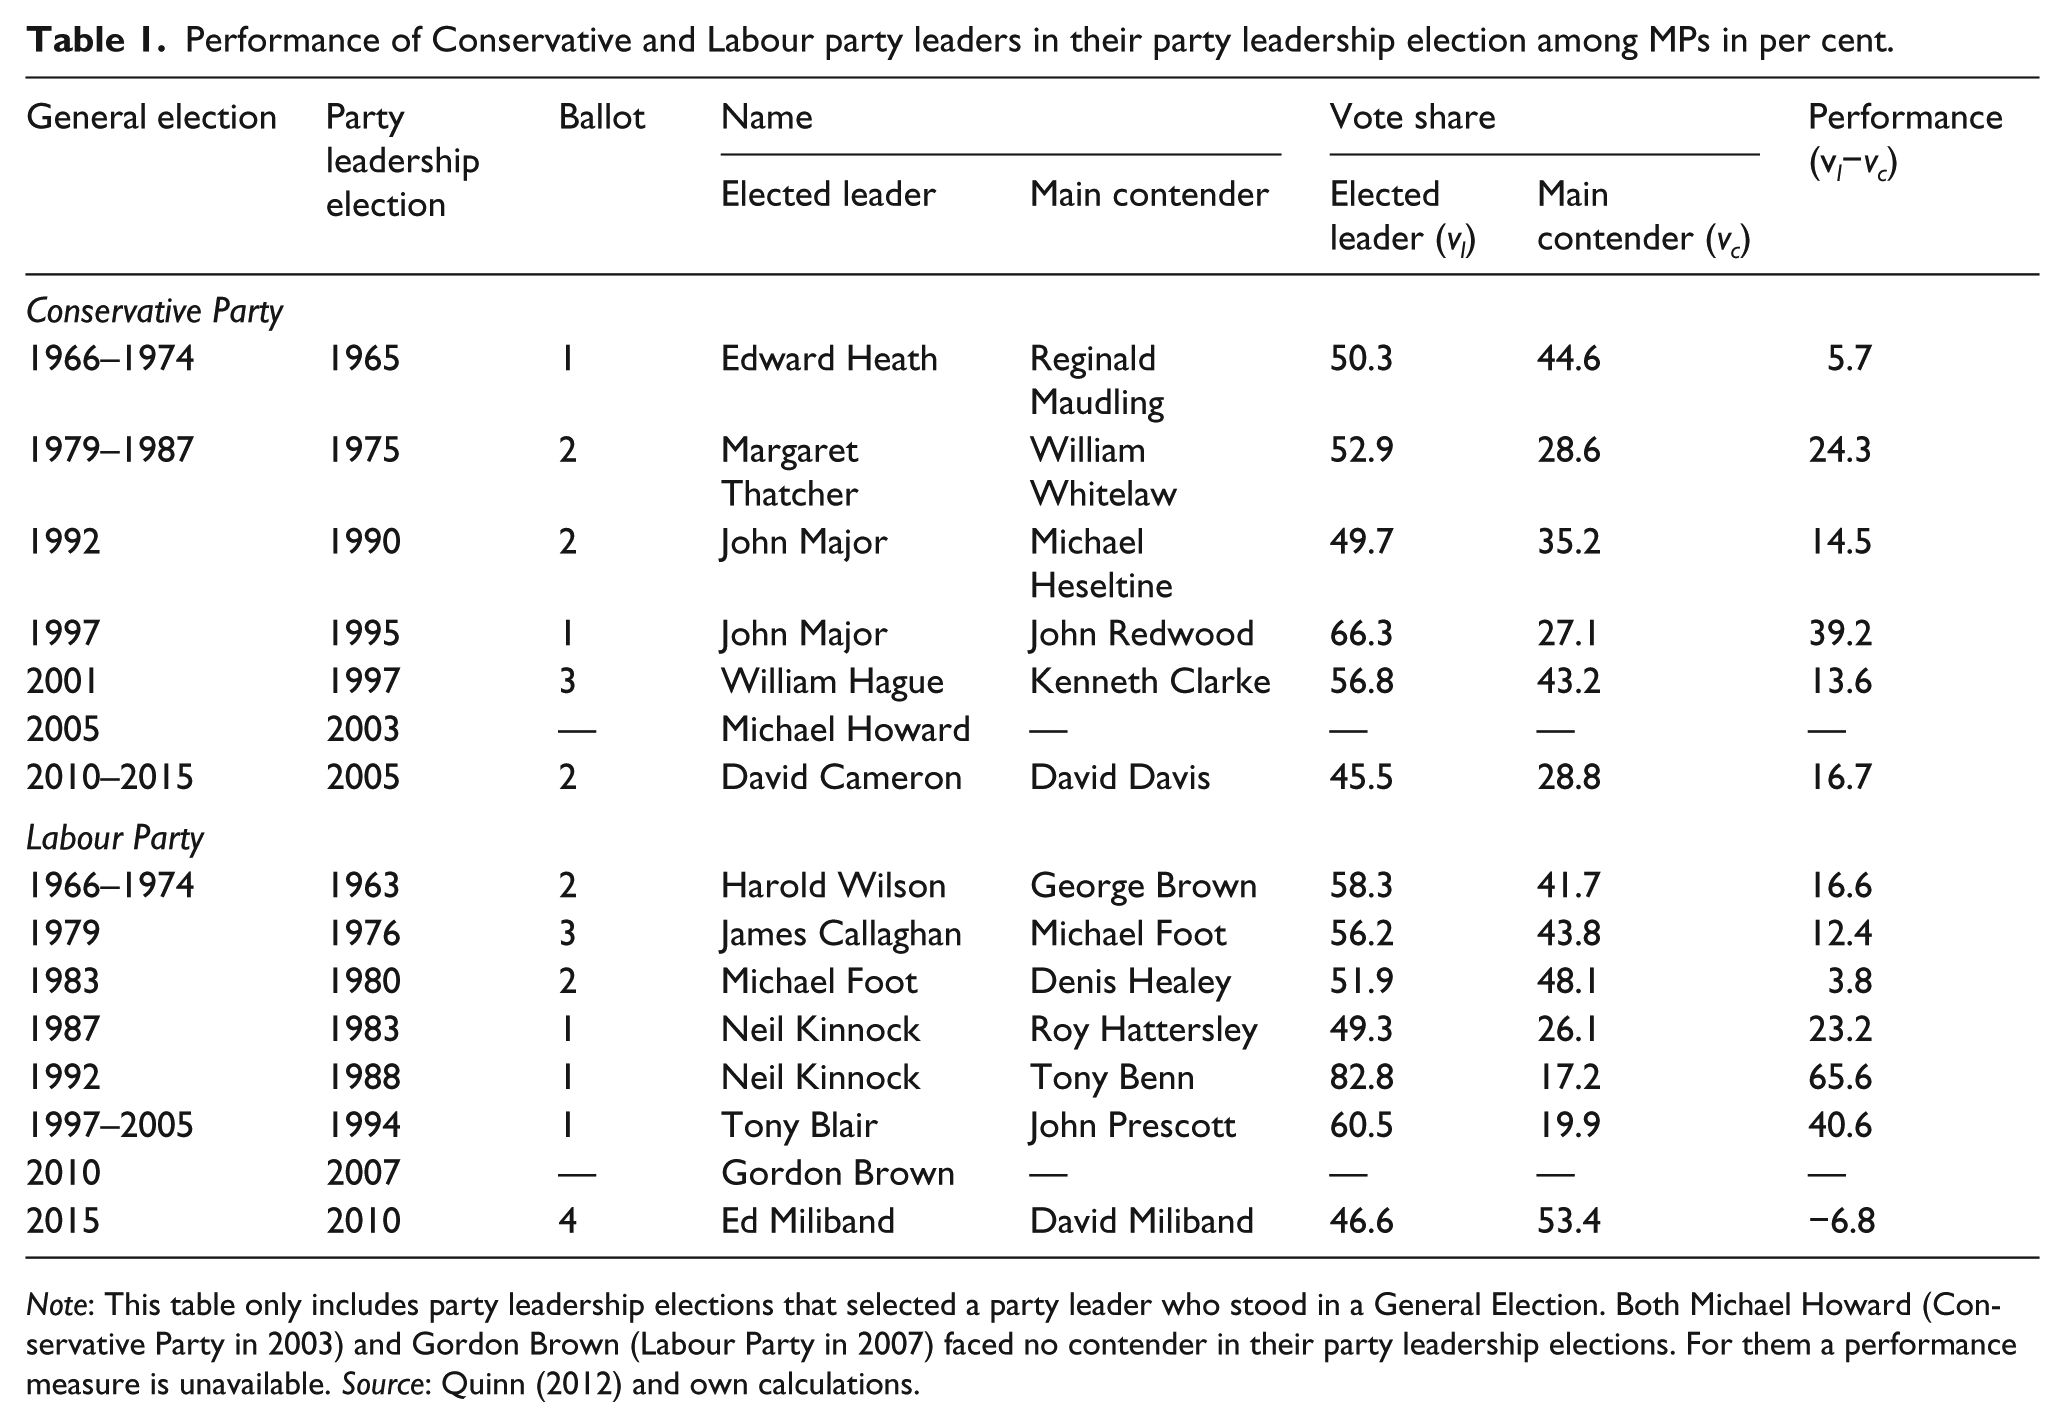
Note: This table only includes party leadership elections that selected a party leader who stood in a General Election. Both Michael Howard (Conservative Party in 2003) and Gordon Brown (Labour Party in 2007) faced no contender in their party leadership elections. For them a performance measure is unavailable. Source: Quinn (2012) and own calculations.
A similar measure of performance is also used as a predictor in Helmut Norpoth’s Primary Model, which covers 25 US presidential elections (Norpoth, 2001, 2004, 2008; Norpoth and Bednarczuk, 2012). The Primary Model differs from the Party Leadership Model in its theoretical justification and empirical strategy. The Primary Model predicts the Democratic percentage in the major-party vote using a second-order autoregressive process to account for presidential cycles, along with the performance of the candidates of the incumbent party and opposition party in the New Hampshire primary as proxies for government approval. In contrast, the Party Leadership Model predicts which party leader will become Prime Minister using the performance of the party leaders in their party leadership election among MPs as a form of citizen forecasting. Because the data of the Party Leadership Model include only 10 past elections, it relies on Bayesian statistics to test for association between predictor and outcome, and to calculate the certainty of the predictions.
Bayesian approach
The present research relies on the Bayesian approach to statistical inference.
1
Statistical inference draws conclusions from observed data y about unobserved quantities, such as a parameter θ or a new observation
In Bayesian statistics, inferences about parameters or new observations are made in terms of probability statements. These statements are conditional on the observed data y, and expressed as p(θ|y) or
When Bayesian data analysis involves multiple parameters, simulations are used to summarize the posterior probability distributions when they cannot be analytically integrated or when it would be too cumbersome to do so. By performing simulations, sampling repeatedly from a probability distribution such as p(θ), anything can be learned about the parameter θ. Bayesian statistics use a specific way of sampling from the posterior distribution called Markov chain Monte Carlo (MCMC). The key advantage of MCMC is that it samples θ from an approximate distribution and then it improves the approximate distribution at each sampling iteration. As a result, MCMC will converge to the target distribution if it runs long enough.
Although the present research does not deal with “complicated multilayered probability specifications”, it still uses MCMC simulations because they enable a test for association between two binary variables when sample size is small. The predictor variable indicates whether the incumbent-party leader performed better than the opposition-party leader in the party leadership elections. The outcome variable indicates whether the incumbent party then won again in the General Election. The dataset for testing this association consists of 10 observations. The standard tool of the conventional approach to statistical inference for testing associations in cross-tabulations with small samples is Fisher’s (1935) exact test. As Altham (1969), Jackman (2009, 67–73 and 140–142), and Sekhon (2005) show, however, Fisher’s exact test is too conservative by favouring the null hypothesis of no association. Instead, these and other authors recommend using the Bayesian analysis that is explained in greater detail below.
Results
The Party Leadership Model predicts who becomes Prime Minister
The following sections test the Party Leadership Model for General Elections since 1966 and present a forecast for the 2015 General Election. These sections also show that the varying lead time of the Party Leadership Model has no effect on its forecasting accuracy, and that it predicts better than the polls.
Table 1 calculates how well the party leaders performed in party leadership elections. The Party Leadership Model compares their performance and predicts that the party leader with the better performance will become Prime Minister. For instance, the Conservatives elected Thatcher in 1975 with a winning margin of 24.3 per cent, whereas Labour elected Callaghan in 1976 with a winning margin of 12.4 per cent. Accordingly, the model predicts Thatcher to win the 1979 General Election.
Table 2 displays for each General Election the performance of the two party leaders in their leadership election, the resulting forecast, and the actual result. When the Party Leadership Model could make a forecast, it picked the right candidate in 8 out of 10 past elections. It correctly predicts, for instance, the victories of Thatcher in 1979 and of Blair in 1997. The model gets, however, two elections wrong. In 1970, it predicts Wilson to become Prime Minister again, when in fact Heath was elected. In 1992, it predicts Kinnock to become Prime Minister, when in fact Major was elected.
The Party Leadership Model correctly predicts 8 out of 10 past elections when data were sufficiently available to make a forecast.

Note: The leaders of the Conservatives and Labour faced no contender in the party leadership elections relevant for the 2005 and 2010 General Elections. For these two General Elections a forecast is unavailable.
In addition to correctly forecasting most elections, the Party Leadership Model forecasts a long time in advance. Table 3 shows the dates of the General Elections and the corresponding leadership contests. It then presents the resulting lead time for each election. For instance, the Conservatives elected Thatcher on 11 February 1975, and Labour elected Callaghan on 3 April 1976. Accordingly, the model can make a forecast on 3 April 1976 for the General Election taking place on 3 May 1979. This is a forecast with a lead time of 1125 days. Overall, the model forecasts with a lead time of more than four years on average (1477 days).
Forecasting lead of the Party Leadership Model. The lead equals the number of days between the dates of the last party leadership election and of the General Election.
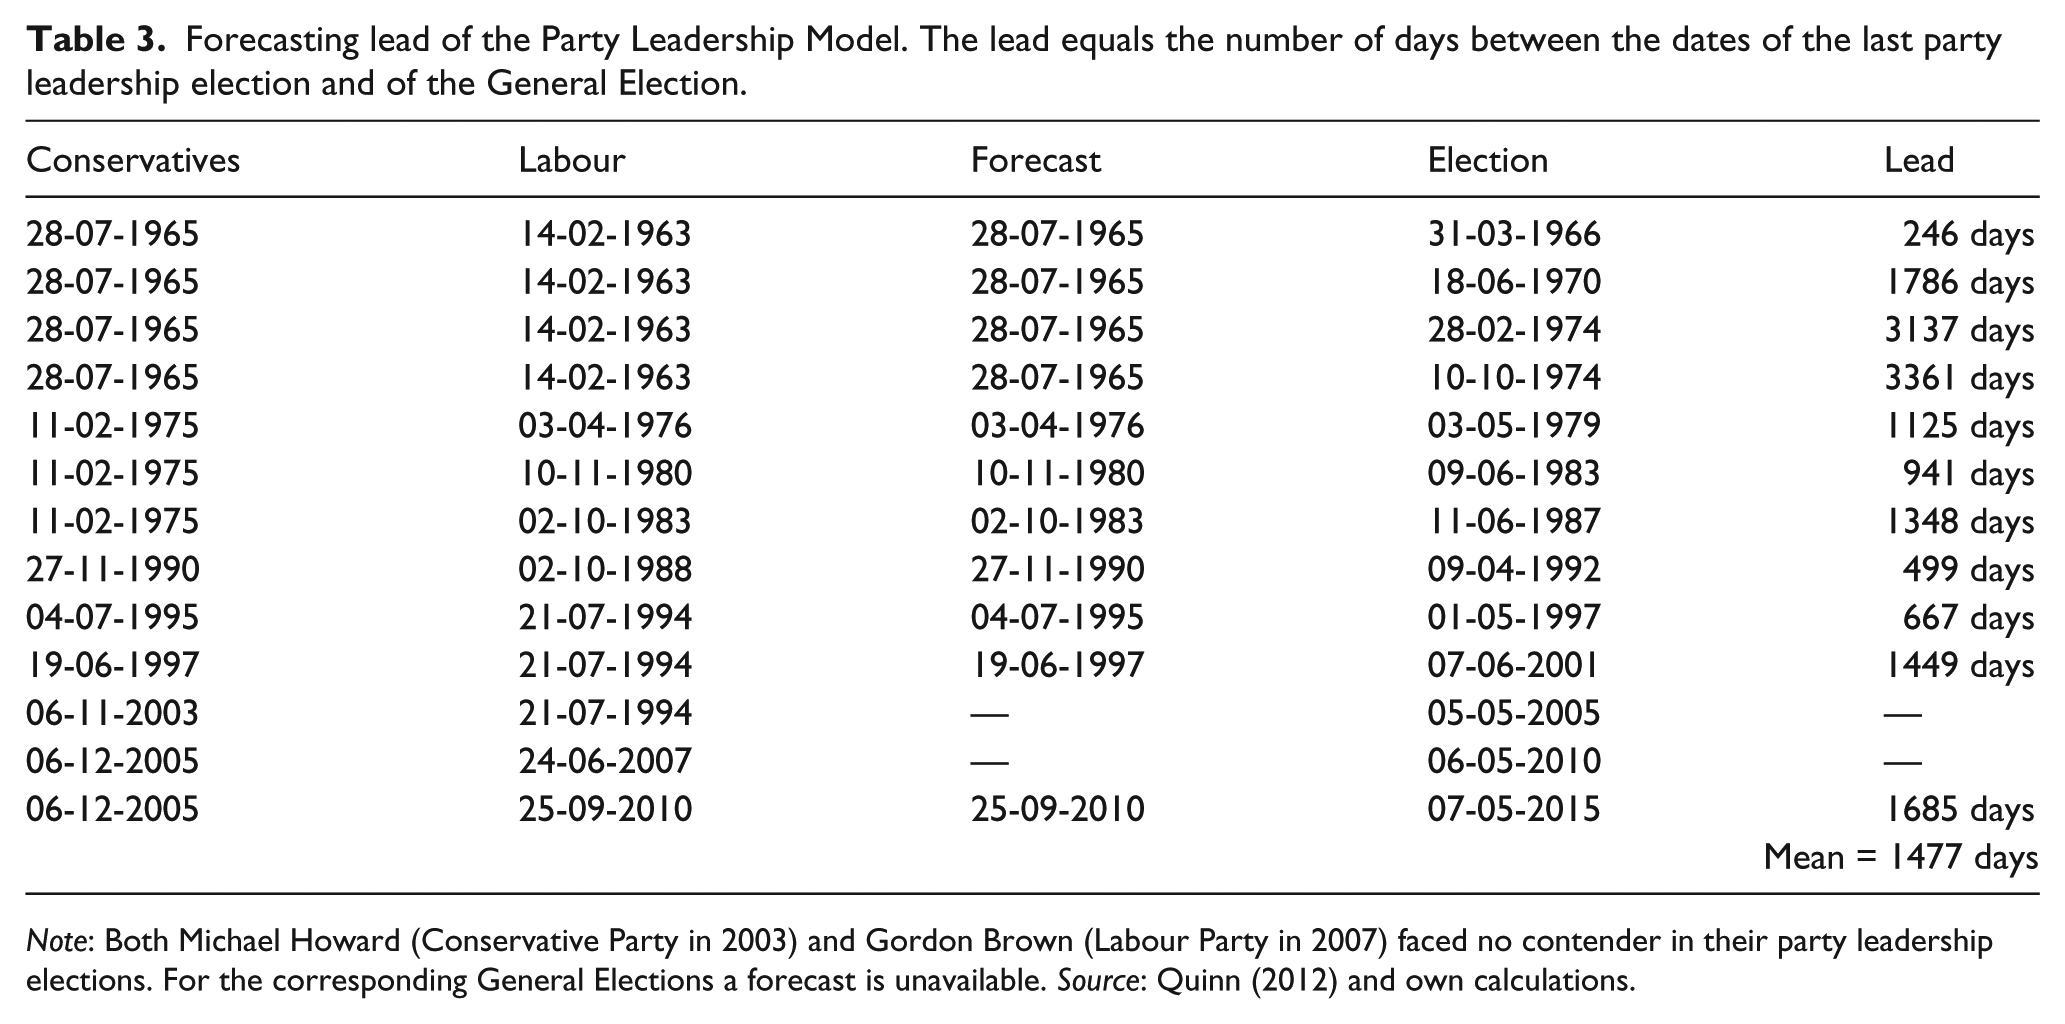
Note: Both Michael Howard (Conservative Party in 2003) and Gordon Brown (Labour Party in 2007) faced no contender in their party leadership elections. For the corresponding General Elections a forecast is unavailable. Source: Quinn (2012) and own calculations.
The lead time of the Party Leadership Model has no effect on its forecasting accuracy. 2 Although the model gets the 1970 General Election wrong with a lead time of 1787 days, using the same party leadership election results from 1965, it gets the subsequent two General Elections in 1974 right with lead times of more than 3000 days. Similarly, the model incorrectly forecasts the 1992 election with a lead time of 499 days, but it correctly forecasts the 1966 and 1997 elections with a lead time of 246 and 667 days, respectively. Based on this, it seems fair to conclude that the varying lead time has no effect on the model’s forecasting accuracy.
The Party Leadership Model predicts better than the polls
Some might argue that party popularity around the time of the leadership election may drive the outcome of both the party leadership election and the General Election. As a result, party popularity may outperform the Party Leadership Model in predicting the General Election. 3 The following analysis shows, however, that this is not the case.
Party popularity is indicated by vote intention polls. Table 4 compares the forecasting accuracy of vote intention polls and of the Party Leadership Model. The vote intention data come from King et al. (2001) for the 1966 General Election, and from http://ukpollingreport.co.uk/ for the General Elections between 1979 and 2001. As before, Table 4 covers only General Elections in which both party leaders faced a main contender in their party leadership election, and at least one party leader stood in a party leadership election since the last General Election. Otherwise vote intention polls from the previous General Election would have to predict the current one. Party popularity equals the average lead of a party in the month(s) before the last party leadership election. Party popularity was calculated for several “poll of polls” by extending the time window. The party leading the polls on average was predicted to win the General Election.
The accuracy of predicting the winning party to be the one which leads in a “poll of polls’; conducted in the month(s) before the last party leadership election.
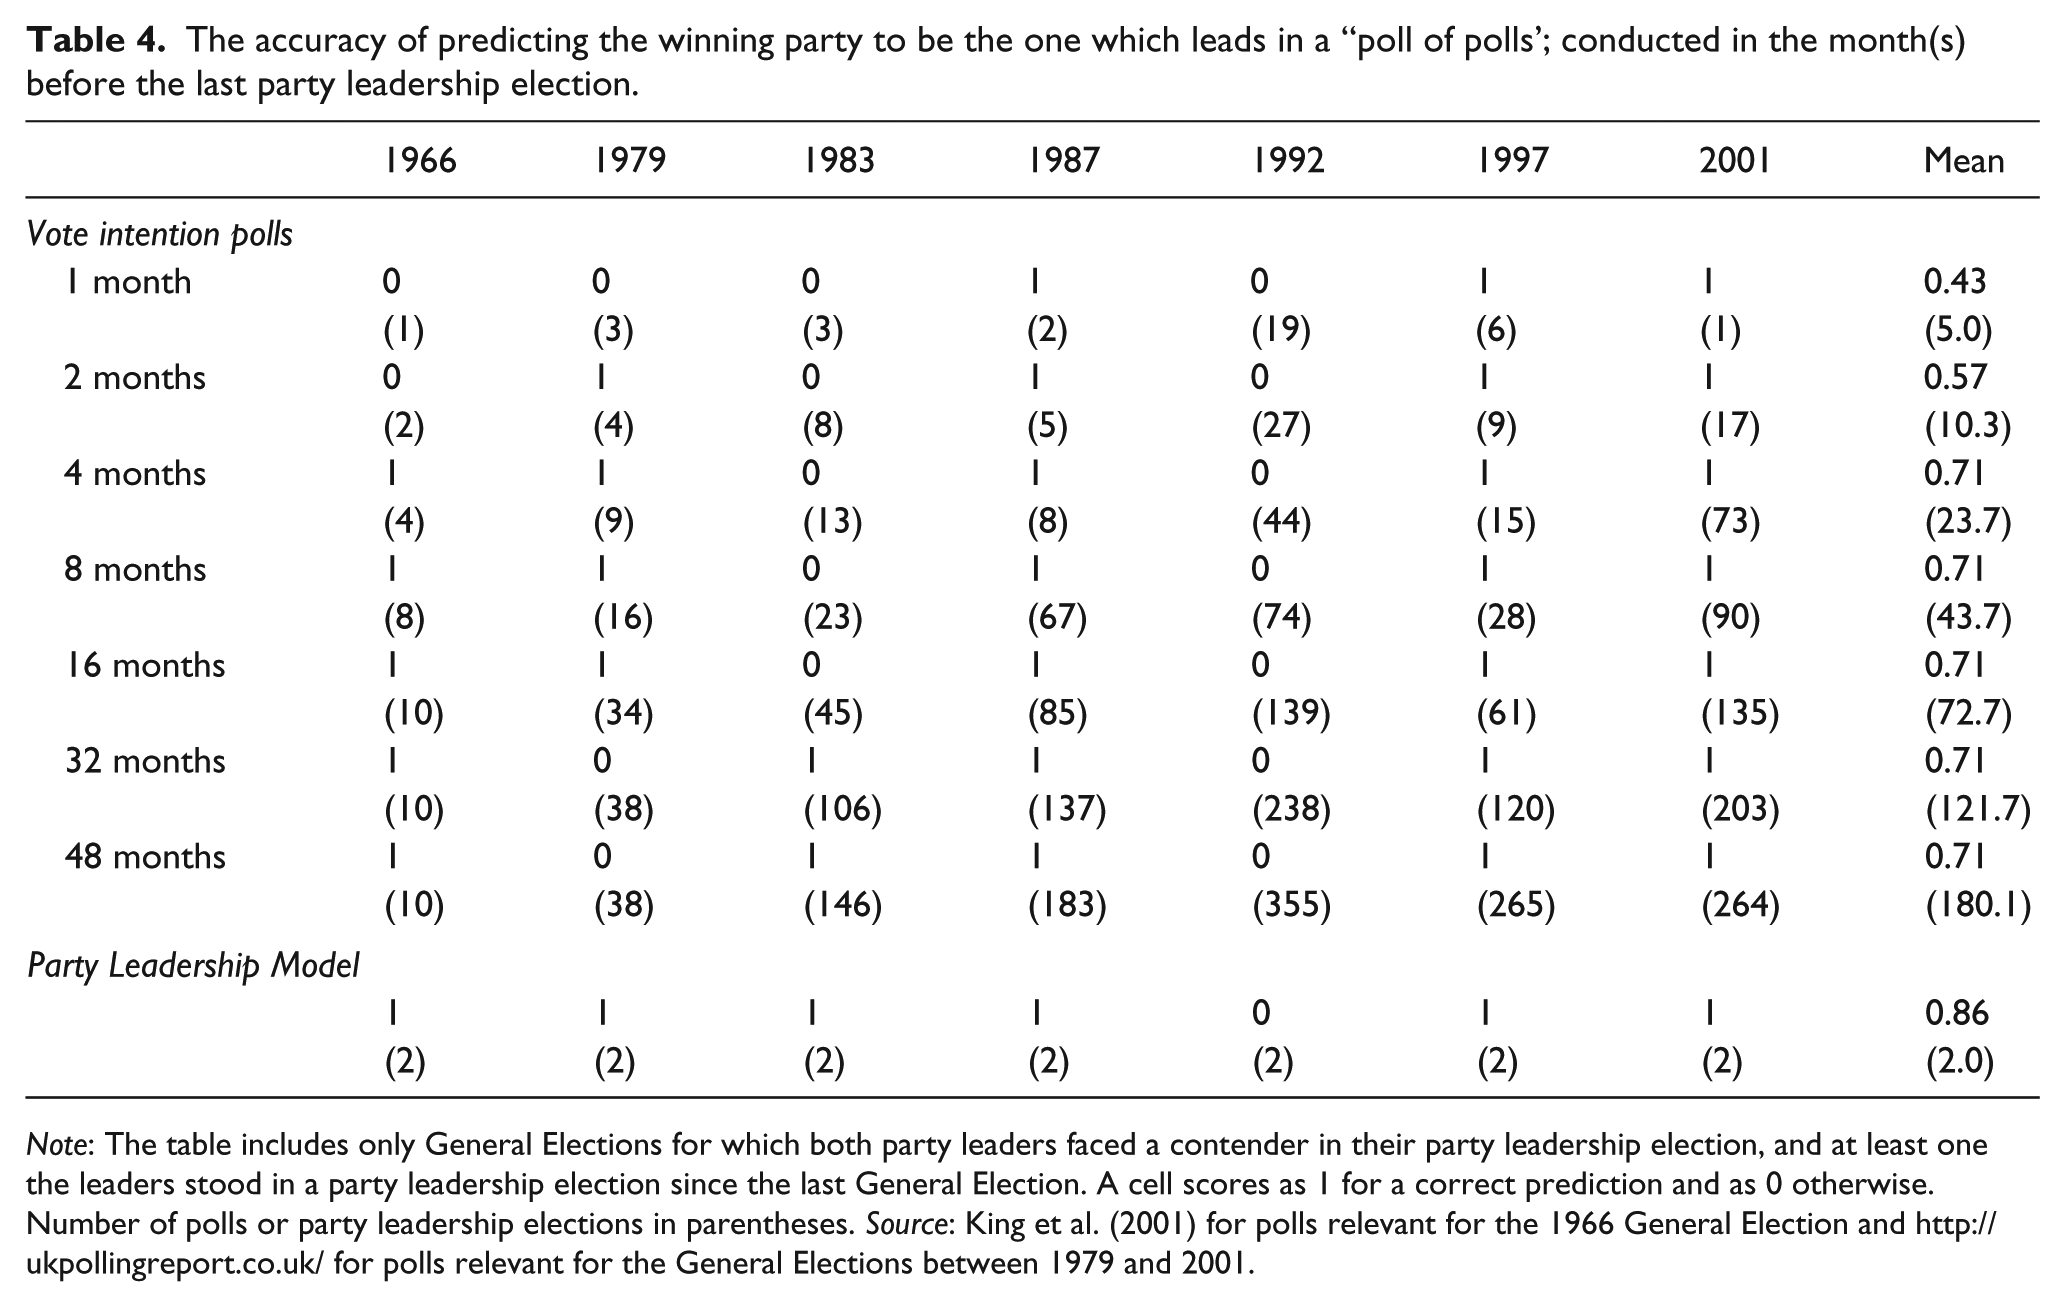
Note: The table includes only General Elections for which both party leaders faced a contender in their party leadership election, and at least one the leaders stood in a party leadership election since the last General Election. A cell scores as 1 for a correct prediction and as 0 otherwise. Number of polls or party leadership elections in parentheses. Source: King et al. (2001) for polls relevant for the 1966 General Election and http://ukpollingreport.co.uk/ for polls relevant for the General Elections between 1979 and 2001.
Table 4 shows that the Party Leadership Model forecasts more accurately than any “poll of polls”. The cells in Table 4 score as 1 if the forecast was correct and as 0 otherwise. As shown above, the Party Leadership Model correctly forecasts 6 out of 7 of these General Elections. The “poll of polls”, by contrast, varies in forecasting accuracy. A longer time window increases the number of correctly forecasted elections. Nevertheless, the maximum number is 5 out of 7.
The Party Leadership Model achieves higher forecasting accuracy with less information than the “poll of polls”. Table 4 displays in parentheses the number of observations used in each model. For the “poll of polls”, the number in parentheses indicates the number of vote intention polls used to generate a forecast of a General Election. The most accurate “poll of polls” needed at least 4 months of polls before the date of the last party leadership election, meaning about 24 opinion polls on average. Assuming each poll interviews 1,000 respondents, this results in 24,000 vote intentions on average considered to correctly forecast 5 out of 7 General Elections. The Party Leadership Model, by contrast, used only two party leadership elections. Assuming that each party has 300 MPs, this results in 600 votes on average considered to correctly forecast 6 out of 7 General Elections. It seems fair to conclude, therefore, that compared with a “poll of polls” the Party Leadership Model requires less data, while delivering higher forecasting accuracy.
Testing for association between party leadership elections and General Elections
This subsection reports the results of an appropriate statistical test to rule out the possibility that the Party Leadership Model correctly predicted most General Elections due to chance. In particular, it tests whether the probability of re-electing the incumbent party (outcome) increases if its leader outperformed the opposition-party leader in the party leadership elections (predictor). Table 5 shows a 2 × 2 cross-tabulation of predictor (0 = incumbent-party leader performed worse; 1 = incumbent-party leader performed better) and outcome (0 = incumbent party was not re-elected, 1 = incumbent party was re-elected). The cells of Table 5 report the corresponding election years.
Re-election of the incumbent party depending on whether its leader performed better than the leader of the main opposition party in the party leadership election.

As indicated above, this article uses a Bayesian approach to test for association between predictor and outcome. This analysis assumes that the outcomes are independent and binomially distributed with probabilities of re-election of θ0 and θ1 if the predictor scores as 0 or 1, respectively. The present research also assumes that the prior distributions for θj, j = 0,1, are uniform on the interval [0, 1], meaning that all values between 0 and 1 are equally likely. This is equivalent to saying that θj ~ Beta (1, 1) for j = 0,1. The Beta distribution is the conjugate prior to the binomial likelihood, so the posterior in this case is a Beta distribution of the form p(θj|y) = Beta (yj + 1,nj − yj + 1), where yj are “successes” in nj “trials” (see Gelman et al., 2014, 29–32).
Table 5 provides the data to calculate the posterior distributions of θ0 and θ1. When the Prime Minister performed worse than the leader of the opposition in the party leadership election (j = 0), the incumbent party was re-elected in one out of four General Elections (y0 = 1, n0 = 4); when the Prime Minister performed better (j = 1), by contrast, the incumbent party was re-elected in five out of six General Elections (y1 = 5, n1 = 6). The posterior distributions are, therefore, θ0 ~ Beta (2, 4), and θ1 ~ Beta (6, 2). The mean of a Beta (α, β) distribution corresponds to α∕(α + β), so the posterior means of θ0 and θ1 are 0.33 and 0.75, respectively. This implies that the re-election rate of incumbent parties when the Prime Minister performs better than the leader of the opposition in the party leadership election is 75 per cent. When the Prime Minister performs worse, it is 33 per cent.
To test for association between predictor and outcome, I analyse the posterior probability distribution of the quantity q = θ1 − θ0. This quantity represents the probability that performing better in party leadership elections increases the chances of re-election. To calculate this quantity, I performed MCMC simulations with 10 chains of 1,000,000 draws each. Inspection of graphical diagnostics as well as formal convergence tests show no sign of non-convergence (Tsai and Gill, 2012), so I conclude that the samples are drawn from the target distribution. Figure 1 plots the posterior distributions of θ0, θ1, and θ1 − θ0. As the second row in Figure 1 shows, the posterior probability that θ1 − θ0 > 0 is 0.95. In other words, better performance in leadership elections increases the incumbent party’s chance of re-election with 95 per cent certainty.
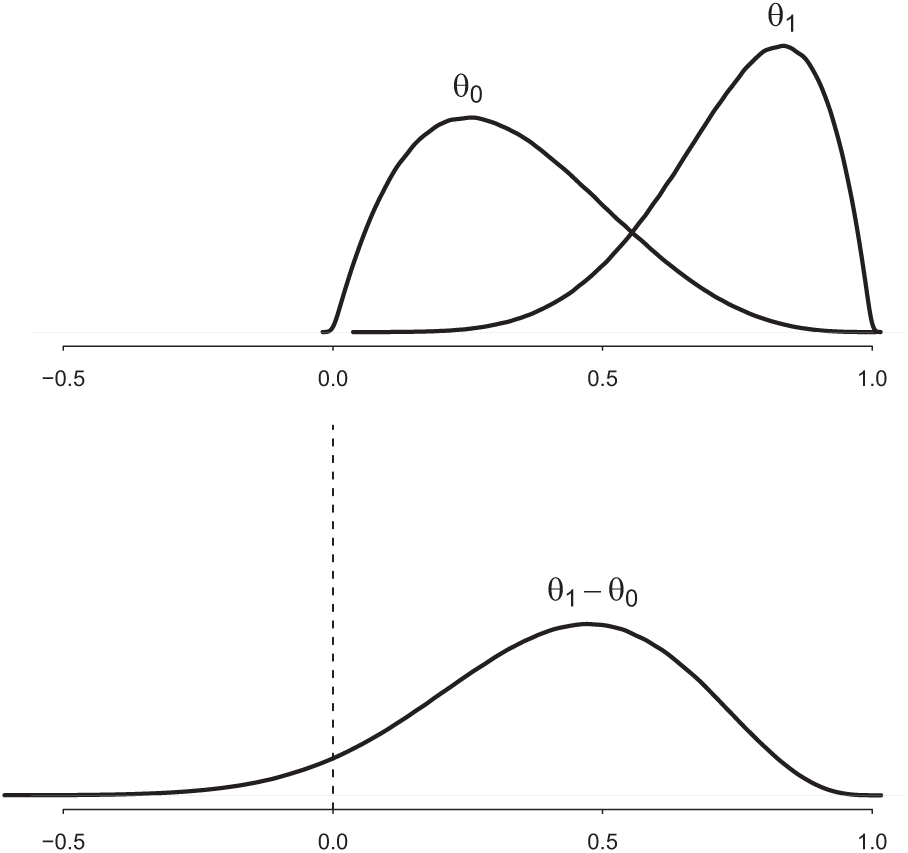
Posterior distributions of the probability of re-election conditional on better (θ1) or worse performance (θ0) in party leadership elections, and of the difference between the two (θ1 − θ0).
Predicting the 2015 British General Election
What does the Party Leadership Model predict for the upcoming General Election? In 2005, the Conservatives elected David Cameron as their party leader. In the second and final ballot among MPs, he received 45.5 per cent of the votes, whereas his main contender, David Davies, received 28.8 per cent. Accordingly, Cameron’s popularity was 45.5 − 28.8 = 16.7 per cent. In 2010, Labour elected Ed Miliband as their party leader. In the fourth and final count among MPs and MEPs, he received 46.6 per cent of the votes, whereas his brother, David Miliband, received 53.4 per cent. Accordingly, Ed Miliband’s popularity was 46.6 − 53.4 = −6.8 per cent. Because the performance of David Cameron (16.7 per cent) was better than of Ed Miliband (−6.8 per cent), the Party Leadership Model predicts a re-election of David Cameron. To repeat the results from the above Bayesian analysis, the certainty of this forecast is 75 per cent (posterior mean of θ1). By using leadership contests the Party Leadership Model makes this forecast with data from four-and-a-half years before the event.
Conclusion
Building on the analyses of British party leadership elections between 1963 and 2010 by Stark (1996) and Quinn (2012), the present research has argued that most of the party leadership elections centre around the goal of finding the candidate who is most likely to bring electoral victory to the party. Because MPs benefit from electoral success, and because they can judge the qualities of a candidate like nobody else can, this analysis has interpreted votes in party leadership elections as conditional forecasts of the General Election.
The present research proposed, therefore, to use party leadership elections to forecast General Elections. The Party Leadership Model compares the performance of party leaders in party leadership elections and predicts that the better performing party leader will become Prime Minister. A crucial benefit of the Party Leadership Model is its long lead time, forecasting General Elections about 4 years in advance on average.
Despite a long lead time, the model correctly picked the winner in 8 out of 10 past elections when data were sufficiently available to make a forecast. Compared with vote intention polls around the time of the leadership election, the Party Leadership Model predicted more accurately with less information. According to a Bayesian analysis, there is a 95 per cent probability that having the larger winning margin in party leadership elections increases the chances of winning the General Election. The present research demonstrates thereby that even though the specifics of Norpoth’s (2001) Primary Model (US) and the Party Leadership Model (UK) differ, the general idea of using leadership contests to predict general elections travels across political systems. In its first out-of-sample prediction, the Party Leadership Model predicts David Cameron to win the Prime Ministership again in 2015. The Bayesian calculation puts his chances of re-election at 75 per cent.
The results of the present paper suggest that as a collective MPs are good at forecasting the chances of their party leader to become Prime Minister. As the relative winning margin among MPs in the leadership election increases, so does the chance of the party leader to become the next Prime Minister. This finding relates to the literature on citizen forecasting (e.g. Graefe, 2014; Lewis-Beck and Skalaban, 1989; Lewis-Beck and Tien, 1999; Lewis-Beck and Stegmaier, 2011; Murr, 2011, 2015). This literature finds that most citizens correctly forecast the winner of the election most of the time. Even though the Party Leadership Model measures forecasts indirectly through votes, the present research suggests that MPs are good “citizen forecasters”. In sum, this article shows that the voting behaviour of MPs in party leadership elections accurately predicts several years in advance the voting behaviour of citizens in General Elections.
Footnotes
Acknowledgements
The author would like to thank Michael Lewis-Beck, Ericka G. Rascón Ramírez, and Paul Whiteley for helpful discussions and comments. I also thank the editor and the two anonymous reviewers for their insightful comments, which helped me to improve the manuscript. All remaining errors are my own. The replication material for the analyses in this paper will be made publicly available.
Declaration of conflicting interest
The author declares that there is no conflict of interest.