
Abstract
Over the past decade, an increasing number of scholars and professionals have turned to the Internet to gather samples of subjects for research ranging from public opinion surveys to experiments in the social sciences. While there has been a focus on whether online samples are representative and accurate, fewer studies examine the behavioral differences between individuals who participate in surveys and experiments on a computer versus in-person. Here, I use an experiment to gauge whether respondents who self-complete surveys online are more likely to register higher knowledge scores compared with respondents who self-complete surveys with pen and paper in a laboratory. The results show that subjects in the online group are significantly more likely to answer knowledge questions correctly across a range of topics. Patterns in the data imply respondents are researching some answers.
Introduction
Understanding both the strengths and weaknesses of various survey modes is critical for scholars and practitioners who use the Internet to assemble samples of respondents. To date, there exists a limited amount of research on the behavioral differences between online and offline respondents despite compelling reasons to expect that online respondents will approach surveys differently. Because online respondents use the Internet to register their choices on a survey or in an experiment, an unfathomable bounty of knowledge is literally at their fingertips and at the push of a button. Put another way, online surveys and experiments ask respondents to provide answers in an environment where they are accustomed to researching questions and multitasking.
I report results from an experiment that examines the difference between self-completed surveys conducted online and in-person based on responses to factual knowledge questions—a survey subject that establishes an objective baseline: there are clear correct and incorrect responses. I find that respondents in the online group provide correct answers to significantly more questions when compared with the in-person group. Additionally, the number of “Don’t Know” responses is significantly lower in the online survey group. I also show that this relatively large difference in knowledge scores appears across the entire distribution of answers (i.e., the results are not outlier driven). Finally, I leverage the differences in question difficulty to uncover strong evidence that respondents in the online sample are cheating. My findings are of particular significance for researchers who use knowledge as an important part of their research design.
The debate over Internet samples
As researchers continue to turn toward online samples to gather empirical data, concerns over the quality of online data have become increasingly important (see, e.g., Ansolabehere and Schaffner, 2014; Hill et al., 2007; Malhotra and Krosnick, 2007; Yeager et al., 2011). Some of these concerns rest with the potential behavioral differences between online and offline samples. Perhaps the most identifiable difference is that online respondents are more likely to report socially undesirable behavior and beliefs (e.g., Chang and Krosnick, 2009; Drolet and Morris, 2000; Duffy et al., 2005; Holbrook et al., 2007; Kreuter et al., 2008; for a longer discussion and review, see Chang and Krosnick, 2010). One potential negative effect of online surveys, however, is that respondents online appear to be more likely to satisfice—that is, complete the survey quickly without much thought (Duffy et al., 2005; Heerwegh and Loosveldt, 2008; but see Chang and Krosnick, 2010).
Another notable difference among respondents using unmonitored computer assisted survey interviews (CASI) to register responses is that individuals completing surveys online tend to score higher on knowledge questions. Ansolabehere and Schaffner (2014), Fricker et al. (2005), and Strabac and Aalberg (2010) all note that online respondents tend to score higher on factual knowledge questions when compared with phone respondents (see also Duffy et al., 2005). 1 Each study concludes that online respondents are simply more informed because individuals who have Internet access are often more educated.
In a related unpublished study, Vavreck 2 capitalizes on her partnership with CBS and YouGov to recruit individuals patronizing the MGM Grand Hotel and Casino in Las Vegas to explore whether individuals are researching answers. In her experiment, one group completes a face-to-face survey with an interviewer, and another group uses a computer to register answers in the laboratory. By tracking their computer usage, she finds that individuals in the computer group almost never research answers to political knowledge questions. In fact, one person who did cheat went so far as to admit his behavior to the research team.
In a related study, Clifford and Jerit (2014) use a student sample to explore the behavioral differences and political knowledge scores between online and in-person samples. Their results show that online respondents are indeed cheating. While compelling, their research suffers from two significant shortcomings. First, they rely on just eight political knowledge questions. This research, by contrast, includes an array of topics that are applicable to a wider audience of scholars. Second, the questions they use are based largely on current events and elected officials. Moreover, two of the questions are arguably not measures of political knowledge (the ability to identify the flag of China and the symbol for the euro). Relying on just six questions related to current political events or figures significantly limits the generalizability of their results.
Assessing whether Clifford and Jerit’s results or Vavreck’s findings are more typical, however, requires additional research. The present study reconsiders these questions by holding constant Internet access. While all respondents have access to the Internet either at home or through the university, I monitored respondents completing the survey in-person to ensure they were not accessing the Internet with a personal electronic device; doing so allows me to identify the differences in level of factual knowledge created by survey mode alone.
Theory and hypotheses
Researchers should expect that individuals answering questions online might have more informed responses. Indeed, online surveys and experiments ask individuals to provide responses in an environment where they are accustomed to researching answers, products, and news stories. Some survey participants may see the question as an opportunity to learn about something they did not know much about. Thus, with respect to factual knowledge questions, I anticipate that online respondents will score higher than traditional pen and paper respondents without Internet access.
Related to my first hypothesis, I also examine the degree to which survey mode affects that rate of “Don’t Know” responses. While some research shows that the incidence of “Don’t Know” responses increases in online formats (Duffy et al., 2005; Heerwegh and Loosveldt, 2008), Chang and Krosnick (2010) find that the rate of “Don’t Know” responses declines in online surveys. As is consistent with higher knowledge scores, I predict that online respondents will be less likely to register a “Don’t Know” response. 3
While I expect that there should be a difference between online and in-person samples, I also predict that this difference will increase with question difficulty. Because difficult questions are, by nature, less known, I predict that individuals taking the survey online will score relatively higher.
To test my hypotheses, I conducted an experiment where respondents were randomly assigned into two groups: one where respondents completed a survey online; and a second where individuals completed a survey in-person via pen and paper. All subjects were recruited from lower-division courses in political science and criminal justice at a large public university. Subjects received extra credit for their participation in the experiment. The online group received an email invitation asking them to complete the survey within a two-week time period (6–21 September 2011). The in-person group received an email providing them instructions on when and where they could complete an in-class survey during the same two-week span. Instead of registering responses on the computer, the in-person group completed an identical paper-based survey. Graduate assistants were at the laboratory survey site to check respondents into the experiment and to monitor the subjects unobtrusively to ensure that they did not access the Internet via a cellular phone or computer. 4 These were self-administered surveys, with the key difference being the survey mode, for both the online and in-person groups. An analysis of the randomization process, a more detailed description of the recruitment methods and the administration of the surveys, and a complete list of questions on the survey are available in the online appendix. 5
In the experiment, I asked respondents to answer a battery of factual knowledge questions. Respondents did not have any monetary incentive to provide correct answers, and their eligibility to receive extra credit for their participation was not conditional on providing correct answers. The topics I asked about were sports (10 questions), popular culture (10 questions), rules of the road (5 questions), economics (5 questions), geography (5 questions), consumer knowledge (10 questions), and American politics (10 questions). 6
Results
I began by running a series of difference in means tests where the dependent variable is percentage of correct responses for a given knowledge category and the independent variable is the group identifier variable. The results of these regressions appear in Figure 1, where I calculate the percentage of correct answers for each knowledge category and for all categories combined. In fact, respondents in the online group provided significantly more correct answers in every category when compared with the in-person group. The online group scored 3.3 percentage points higher than the in-person group on political knowledge (t=1.97). While this difference is significant, it is easily the smallest in the data and contrasts with the strong differences seen in Clifford and Jerit (2014). While I suspect the difference between groups is small for political knowledge because the sample consisted of students enrolled in lower division political science and criminal justice courses, this was also the case for Clifford and Jerit. What likely explains the divergent results is that my survey instrument asks largely about static political questions rather than topical political questions.
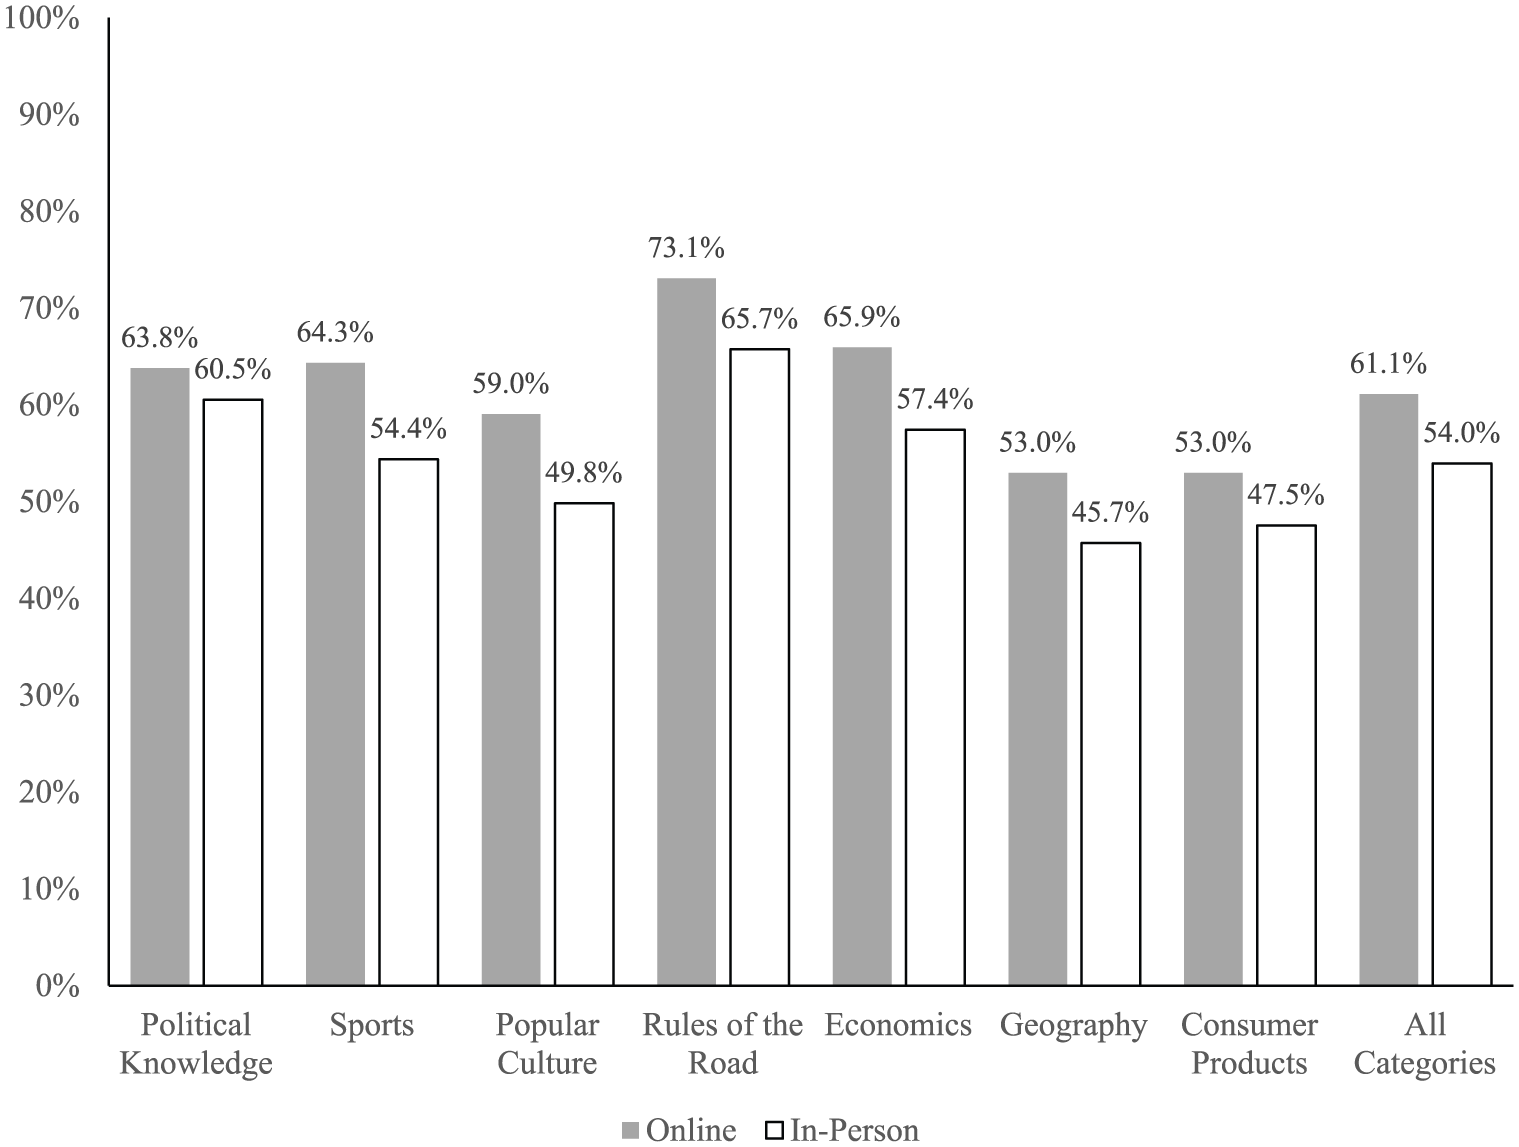
Comparison of means across all knowledge categories.
For the remaining categories—sports, popular culture, rules of the road, economics, geography, and consumer products—the online group was also significantly more likely to provide a correct response (all differences are significant beyond the 95th percentile). This difference ranges from a low of 5.5 percentage points (consumer products) to a high of 9.9 percentage points higher (sports). The online group’s overall score—which combines all of the categories—was 7.1 percentage points higher when compared with the in-person group. 7
I turn to consider the degree to which outliers may be driving my results in Figure 1. Consider Figure 2, which shows the percentage of respondents in each group who are above specific points in the distribution. At two standard deviations below the mean (35.4 percent correct) score on all questions, 100 percent of the online group and 98.2 percent of the offline group scored higher than this benchmark. That is, the few people who scored worse than two standard deviations below the mean belong solely to the offline group. At one standard deviation below the mean (a score of 46.5 percent), 87.2 percent of the online group and 76 percent of the offline group scored above this benchmark. At the mean (a score of 57.8 percent), 63.3 percent of the online group and 37.4 percent of the offline group scored better, showing a large discrepancy between the two groups. When we examine respondents who scored one standard deviation above the mean (a score of 69 percent), 29.1 percent of online respondents and just 7.6 percent of offline respondents fit this description. At two standard deviations above the mean (a score of 80 percent), 6.1 percent of online respondents and 0 percent of the offline respondents score higher. On balance, the discrepancy in scores between the online and offline groups is consistent across the distribution. 8
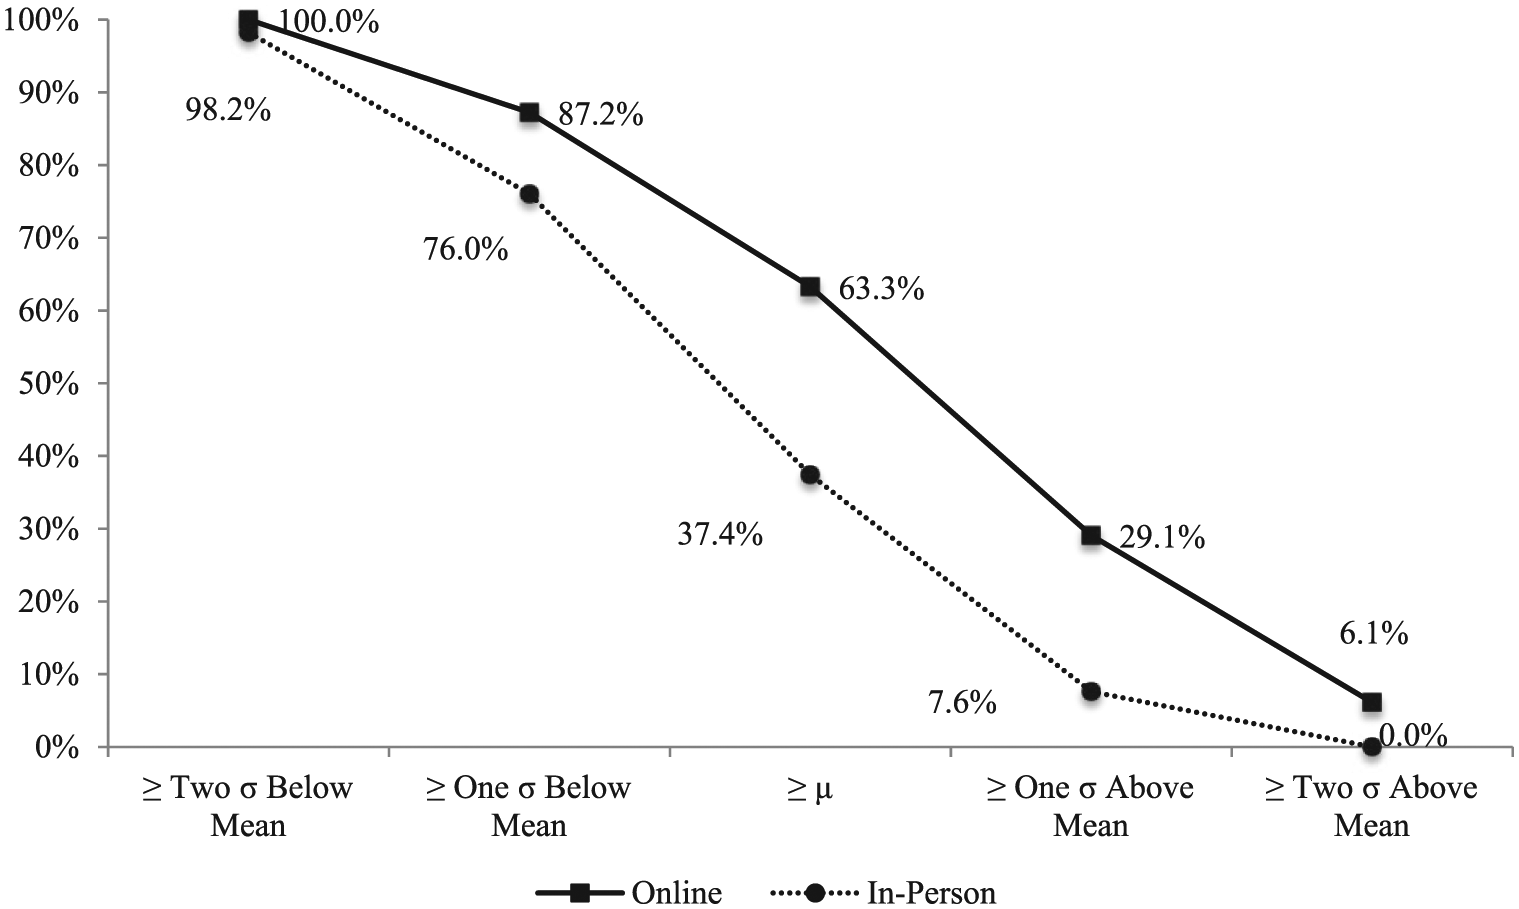
Overall scores by standard deviations.
The next step in my analysis was to examine whether individuals in the online or in-person group were more likely to register a “Don’t Know” response for the questions asked. My hypothesis predicts that individuals in the online group will have a lower rate of “Don’t Know” responses. I use a difference in means tests where the number of “Don’t Know” responses for each respondent serves as the dependent variable and the only independent variable is a dichotomous measure of the respondents’ group to examine this question. The results of this analysis, shown in Figure 3, show that the average individual in the online group registered 3.4 fewer “Don’t Know” responses when compared with the in-person group (3.4 questions constitutes 6.25 percent of all factual knowledge questions on the survey). This result is significant well beyond the 99 percent confidence interval. This result is consistent with both my first hypothesis that predicts higher scores for the online group and my second hypothesis that argues online respondents will register fewer “Don’t Know” responses.

Comparison of “Don’t Know” responses.
For my third hypothesis, I consider whether the discrepancy in scores holds when I examine just the most difficult questions in my survey—perhaps one of the better empirical inquiries to detect cheating. 9 To do so, I select the two most difficult questions (denoted by a † in the online appendix), based on percentage of correct responses overall, for each category. I predict that the discrepancy between online and offline groups will not only remain, but should increase. Recall from Figure 1 that the difference in overall scores between the two groups was that the online group scored 7.1 percentage points higher. When I restrict the questions to the two most difficult in each category (fourteen questions total), online respondents get 26 percent of the questions correct compared to just 15.4 percent of questions correct for the offline sample. This is a difference of 10.6 percentage points and is highly significant (t=7.1). The difference in differences is 3.4 percentage points, meaning that the gap between online and offline groups widens 3.4 points when considering just the two most difficult questions in each category. This difference in differences falls just short of a traditional two-tailed significance test (p=0.06). Given the directional nature of my hypothesis and my relatively small sample, however, I am confident this is a meaningful difference in differences.
Similarly, we can limit the sample to individuals who score well on the easiest questions on the survey. To do this, I calculate each respondent’s combined score on the easiest two questions for each category and denoted these questions with †† in the online appendix (responses with 100 percent correct answers are excluded due to lack of variation). As Figure 4 shows, the average person in the online group scored 90.2 percent and the average offline person scored 88.1 percent—a difference of 2.1 percentage points. I then examine whether individuals who score above the mean on the easiest questions score about the same on the set of more difficult questions by survey group—a result that is also available in Figure 4. Individuals in the online group who score above the mean on the easiest questions answer 30.1 percent of the most difficult questions correctly. Individuals in the offline group who score above the mean on the easiest questions answer the most difficult questions correctly about 15.4 percent of the time—a 14.7 percentage point difference that is significant well beyond conventional levels. These results, coupled with the previous findings, are precisely the kinds of discrepancies we should expect to find if cheating is present (see Jacob and Levitt, 2003).

Responses to easiest and hardest questions.
Discussion
Previous studies (e.g. Ansolabehere and Schaffner, 2014; Duffy et al., 2005; Prior and Lupia, 2008; Strabac and Aalberg, 2010) have hinted at the possibility that online respondents score higher on knowledge questions. Clifford and Jerit (2014) find that cheating is occurring, but they only examine differences in political knowledge and have a very limited number of questions on the subject. I found that respondents who completed my survey online were better able to answer factual knowledge questions about a variety of topics ranging from sports to consumer products. I showed that these discrepancies were not outlier-driven and permeate the entire distribution of responses. I also demonstrated that individuals in the online group were actually less likely to provide a “Don’t Know” response. I also compare responses to the most difficult and easiest questions, showing clearly that individuals in the online sample score significantly higher, even though I restrict the sample to individuals who score above the mean on the easiest questions. Overall, my results strongly imply that responders in the online group cheated. For researchers who use knowledge as a predictive variable, these results should raise important concerns about the validity of measuring knowledge in an online format.
Perhaps the biggest concern about this research is the reliance on a student sample
A second concern is that I did not place a time limit on how long individuals could consider each of the knowledge questions online or in-person. Strabac and Aalberg’s (2010) study, however, did include a thirty-second timer in their online module. Again, my study uncovered nearly identical results to those of Strabac and Aalberg even without a timer. 11
Notably, my results contrast with Vavreck’s research on survey mode and factual knowledge questions. The generalizability of the Vavreck study is substantially limited for three reasons: individuals were aware they were being monitored; the computers that were employed are public with no expectation of privacy; and the in-person group includes interviewer effects that may influence the results. By contrast, my online condition resembles what happens in most online surveys and experiments: individuals complete the task with a personal computer outside of a laboratory setting. My results confirm and expand upon Clifford and Jerit (2014) by concluding that there is a significant behavioral difference between online and in-person respondents. Both Clifford and Jerit’s and my own analysis suggest that these notable discrepancies are a result of cheating. While other causes may explain this difference—for example, respondents online may consult friends in the room or the existence of monitors may have a depressing effect on knowledge—additional research should endeavor to identify the causal mechanism that explains these substantial differences in knowledge with certainty.
Why do some individuals research answers? There are several compelling answers. First, individuals may research answers online simply because the answer is readily available. Second, respondents may research answers stemming from social desirability—that is, they want to appear intelligent. Third, factual knowledge questions may trigger the curiosity of the respondent to research an answer to a question for which she did not know the correct response. Future research can assess why individuals choose to research answers. Using a privacy preserving design (see, e.g., Hoffman and Musch, 2015) would allow researchers to ask respondents directly if they researched answers and, if they did, why did they choose to do so?
Footnotes
Declaration of conflicting interests
The authors declare that there is no conflict of interest.
Funding
This research received no specific grant from any funding agency in the public, commercial, or not-for-profit sectors.
Notes
Carnegie Corporation of New York Grant
The open access article processing charge (APC) for this article was waived due to a grant awarded to Research & Politics from Carnegie Corporation of New York under its ‘Bridging the Gap’ initiative. The statements made and views expressed are solely the responsibility of the author.