
Abstract
Recent years have seen a dramatic increase in surveys of online respondents who participate absent random selection. Using an uncompensated, opt-in panel of 11,000 Pennsylvanians (2020–2022), we benchmark self-reports against vote histories, campaign contributions, election returns, and Census data. Ours is among the first such benchmarking exercises in more than a decade, a period when online survey research has transformed. It is also among the first analyzing a longitudinal panel. Our panelists are approximately balanced on partisanship; attrition is limited. Notably, respondents are very politically engaged, with high rates of turnout, campaign contributions, and rally attendance. Ethnic/racial minorities are under-represented. Political attitudes show high over-time stability, and an experiment uncovers few partisan differences in response rates. Such survey samples are cost-effective ways to track the views of highly engaged citizens over time, but less engaged citizens prove hard to recruit, even with supplemental efforts. Survey participation is itself a political behavior.
In recent decades, the use of online, opt-in surveys to study Americans' political attitudes has exploded. To date, survey experiments with opt-in samples have shown noteworthy external validity, whether respondents are recruited via online markets or empaneled directly to take surveys (Berinsky et al. 2012; Coppock et al. 2018; Mullinix et al. 2015). 1
Still, there are outstanding questions about non-probability samples (Cornesse et al. 2020; Eyal et al. 2021; Krupnikov et al. 2021). In contrast to earlier practice, researchers using these samples are typically not involved in sample recruitment, and so aren’t as familiar with the procedures that lead respondents to be included in their data (Enns and Rothschild 2023). The fraction of the target population available for surveys is thus unclear but is likely to be small (Stewart et al. 2015). In particular, online, opt-in surveys risk over-representing the highly politically engaged (Cavari and Freedman 2022; Jackman and Spahn 2021).
We address these questions by detailing a multi-year panel survey which we directed with the survey firm Civiqs serving as recruiter and interviewer. 2 Certainly, previous studies have sought to understand online, opt-in survey respondents by benchmarking them relative to other populations, principally making comparisons to high-quality governmental surveys (e.g., Ansolabehere and Schaffner 2014; Dutwin and Buskirk 2017; Keeter 2018; Kennedy et al. 2016; MacInnis et al. 2018; Malhotra and Krosnick 2007; Rivers and Bailey 2009; Vavreck and Rivers 2008; Yeager et al. 2011). Yet among those benchmarking studies, the most recent data in a peer-reviewed article comes from 2014, which was a decade ago and prior to the significant polling errors in the U.S. and U.K. (Clinton et al. 2022; Prosser and Mellon 2018). The population of respondents to online, non-probability samples can change significantly in a few months (Aronow et al. 2020), to say nothing of a decade. Many of the main providers of online, opt-in samples for contemporary political science did not exist a decade ago (Coppock and McClellan 2019).
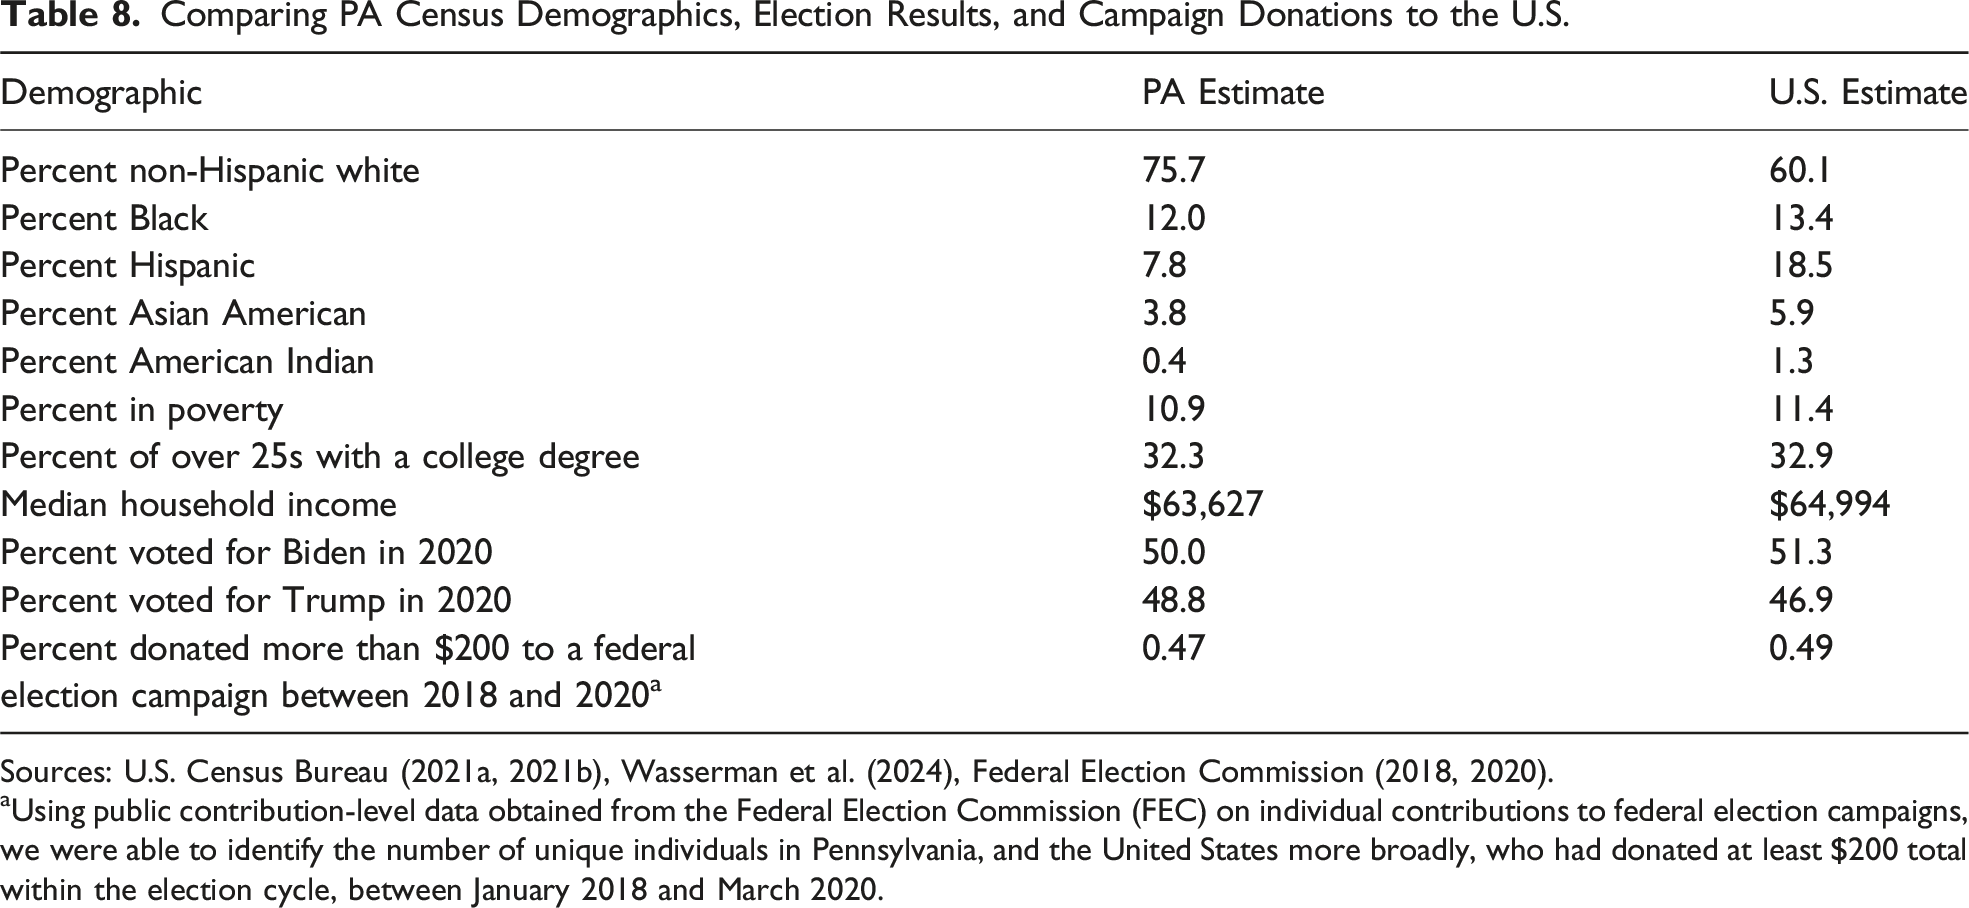
Even beyond its recent vintage, the panel we report has several features which make it an especially valuable tool through which to assess the opportunities and limits of samples recruited online to take uncompensated surveys. As Appendix Table 8 illustrates, Pennsylvania is broadly representative of the U.S. overall. Recruiting in this large American state enabled us to compare our survey-based estimates with external benchmarks, including public records of vote history and campaign contributions alongside election returns, Census data, and newspaper reports. In fact, this study is among the only to use official, individual-level voter records as an externally validated benchmark when evaluating the bias in online, opt-in survey data—and the first to our knowledge in more than a decade (see also Rivers and Bailey 2009; Vavreck and Rivers 2008).
We also contribute by evaluating the properties of not just a one-time cross-section but a multi-wave panel (see also Vavreck and Rivers 2008). Doing so is especially important given the increased use of panels to measure the outcomes of field experiments (Broockman et al. 2017). By assessing who participates in such panels, we will be better positioned to understand the populations to whom such field experiments generalize.
Via online advertisements on Facebook, Google, and Instagram, we recruited sizable numbers of Democrats and Republicans to take brief surveys, with high re-interview rates that facilitate over-time study. These respondents were recruited via Civiqs’ usual recruitment channels and were combined with pre-existing members of Civiqs’ panel who were Pennsylvania residents—48% of our full panel was newly recruited for this project, with the remaining 52% coming from Civiqs’ existing panelists. However, our sample is very politically engaged: of those we were able to match to voter files, 87% voted in the 2018 midterm election and 72% in the 2020 primary. The actual figures in Pennsylvania were significantly lower, at 58% and 34%, respectively. We also find levels of campaign contributions and Trump rally attendance far higher than among Pennsylvanian adults overall. Our respondents' vote choice preferences are very stable over a campaign, even relative to a national, population-based panel. Deliberate efforts to reduce such biases by targeting lower-engagement Pennsylvanians yielded few additional respondents.
These results reinforce an expressive account of survey response, in which those who are most motivated to participate are highly engaged partisans (see also Graham and Huber 2021). However, in contrast to Gelman et al. (2016), such motivations vary little over time among this sample. An experiment before and after the November 2021 election uncovers no evidence that individuals are motivated to respond to our survey by events that are positive or negative for their party.
Our results also corroborate prior findings (Hillygus et al. 2014; Kennedy et al. 2016; MacInnis et al. 2018): racial/ethnic minorities are under-represented in our panel relative to their share of the population, as are younger voters. Comparisons with benchmarks from the Current Population Survey (CPS) illustrate that lower income Black registered voters and Black or Latino registered voters without college degrees are particularly under-represented.
Researcher involvement in the design and recruiting of panelists provides procedural transparency and opportunities for experimentation. 3 Unlike some similar online, non-probability surveys, our panel does not offer respondents material incentives (see MacInnis et al. 2018). Recruiting respondents to take free, short surveys avoids the need to solicit personal information for payment, and so has the potential to include some respondents who would not otherwise participate while reducing the incentive for disruptive bots (Aronow et al. 2020).
While many contemporary online, opt-in surveys provide compensation (e.g., Ansolabehere et al. 2023), it is nonetheless key to understand samples motivated by non-monetary incentives, in part because such expressive incentives are likely to play some role even in surveys in which respondents are modestly compensated. That said, recent research has commonly employed uncompensated surveys, at times because certain research designs make compensating otherwise anonymous survey respondents difficult and/or because of the need to maintain anonymity (e.g., Carpenter 2012; Hopkins et al. 2024; Hopkins and Gorton 2024; Medeiros and Gravelle 2023; Weiss 2021; Williams, Gravelle and Klar 2022; Zhang et al. 2018). (Surveys administered through other modes, such as telephone surveys and exit polls, are also commonly uncompensated—e.g., Croco et al. 2019; Tyler and Iyengar 2023; Sambanis, Simonson, and Yaylacı 2023—so insights from this study may also apply to those survey modes.)
We define activists as those who engage in political activities beyond voting (Hopkins and Noel 2022). In recent years, such activists have arguably been understudied relative to both political elites and the mass public (Blum 2020; Han 2014; Parker and Barreto 2014). These results clarify that online, opt-in samples can effectively survey such highly engaged partisans repeatedly at relatively low cost. 4 When coupled with prior results on treatment effect stability (Berinsky et al. 2012; Coppock et al. 2018; Mullinix et al. 2015), they indicate a meaningful role for free, online, opt-in samples in contemporary research (Krupnikov et al. 2021). This approach thus opens up many opportunities for studying activists from both parties. However, these results also clarify that our ability to sample lower-engagement voters is quite limited—and that in cases where researchers are interested in that side of the engagement divide (Krupnikov and Ryan 2022), or in Black or Latino citizens without college degrees, they will need to employ alternatives. Moreover, free surveys may disproportionately attract those with expressive motivations—such as strong, highly engaged partisans and activists—and may also have lower response rates (Yan et al. 2018).
Prior Research
The popularity of surveys administered online has soared recently (Tourangeau et al. 2013). The increasing use of online surveys has transformed two different elements of survey research: the dominant interview mode and the typical sampling procedure (Gooch and Vavreck 2016). Our emphasis here is on samples of respondents available online for opt-in surveys. 5
The popular “Total Survey Error” framework encourages survey researchers to move beyond a focus on sampling error (Weisberg 2010). It distinguishes between errors of nonobservation (including coverage error) and errors of observation (such as social desirability bias; Groves and Lyberg 2010, 855), and we focus squarely on the former. Specifically, we emphasize coverage errors resulting from the differential accessibility of some in the target population when surveying online.
Online, opt-in survey respondents often select into taking surveys by proactively seeking them out or by being among the few people who respond to online advertisements, raising concerns about representativeness (Baker et al. 2010; Callegaro et al. 2014; Chang and Krosnick 2009; Mercer et al. 2018; Yeager et al. 2011). Among this self-selected group are professional respondents who take part for the incentives or based on their interest in the survey topic (Hillygus et al. 2014).
For researchers to make inferences about a population from a survey sample, respondents must be drawn from the broader population with known, non-zero probabilities. Non-response bias is a particular concern when it is associated with key measures of interest and when it is non-ignorable, meaning not fully explained by covariates captured in the survey. For example, if contemporary survey samples are disproportionately highly politically engaged, we risk over-estimating the fraction of those with strong partisan identities (Huddy 2018; Jackman and Spahn, 2021; Cavari and Freedman 2022; but see Mellon and Prosser 2021).
Non-response biases may be getting worse. Telephone response rates have been declining for decades (Leeper 2019; Luiten, Hox, and de Leeuw 2020), and researchers increasingly use online, probability-based or opt-in samples where response rates may be lower still (MacInnis et al. 2018; Mutz 2011). Given researchers’ growing reliance on online, opt-in samples—and the substantively meaningful differences between Americans who are or are not politically engaged (Krupnikov and Ryan 2022)—the question of who participates in such surveys is crucial (Porter and Whitcomb 2005).
Prior research has already begun to address this question. In an analysis of Pew telephone and face-to-face interviews, Keeter (2018) finds that surveys with low response rates tend to over-represent the politically and civically engaged, though not people with any particular political leaning. To date, research validating online, opt-in recruitment has typically compared such samples to Census data or other survey benchmarks (see esp. Malhotra and Krosnick 2007; Vavreck and Rivers 2008; Rivers and Bailey 2009; Yeager et al. 2011; Ansolabehere and Schaffner 2014; Kennedy et al. 2016; Dutwin and Buskirk 2017; Keeter 2018; MacInnis et al. 2018). Of those studies, the only two to benchmark opt-in samples using voter file data were published more than a decade ago (e.g., Rivers and Bailey 2009; Vavreck and Rivers 2008).
Partisan Motivations
One possibility is that opt-in respondents—and especially those who aren’t paid or quasi-professional (Hillygus et al. 2014)—will respond (or not) in ways that express their partisan identity. For example, Gelman et al. (2016) show that in the 2012 presidential elections, the shift in polls against Democrat Barack Obama in the wake of his poor debate performance was driven primarily by a pro-Republican shift in survey participation. Relatedly, Clinton et al. (2022) show that in 2020 Democrats were more likely to respond to telephone polls than Republicans or independents. Given the strength of contemporary partisan identities and their integration with many Americans’ self-concepts (Huddy et al. 2015; Iyengar et al. 2019; Malka and Adelman 2022; Osmundsen et al. 2021), it seems quite plausible that split-second decisions about whether to participate in a survey or how to respond to a question may be shaped by a desire to associate one’s self with copartisans (see also Schuessler 1999).
Consistent with an expressive account of survey participation, Graham and Huber (2021) find that when offered the opportunity to answer additional survey questions, between 50 and 80% of respondents accept, suggesting that respondents receive expressive benefits from answering survey questions (see also Schaffner and Luks 2018). Acceptance was especially high for questions previewed as explicitly partisan, such as presidential approval. Respondents’ desire to express their partisanship seems to be a potent motivation for taking surveys, one likely to influence who participates in uncompensated surveys.
Recruitment Procedure
We focus on a single state so as to collect benchmark data from various sources. (The COVID-19 pandemic forced us to cancel a planned 2020 statewide exit poll which was one benchmark.) As Appendix Table 8 shows, in key respects, Pennsylvania’s demographics closely mirror those of the nation overall; it is also a swing state which has voted for the winner of every presidential election since 2004. 6
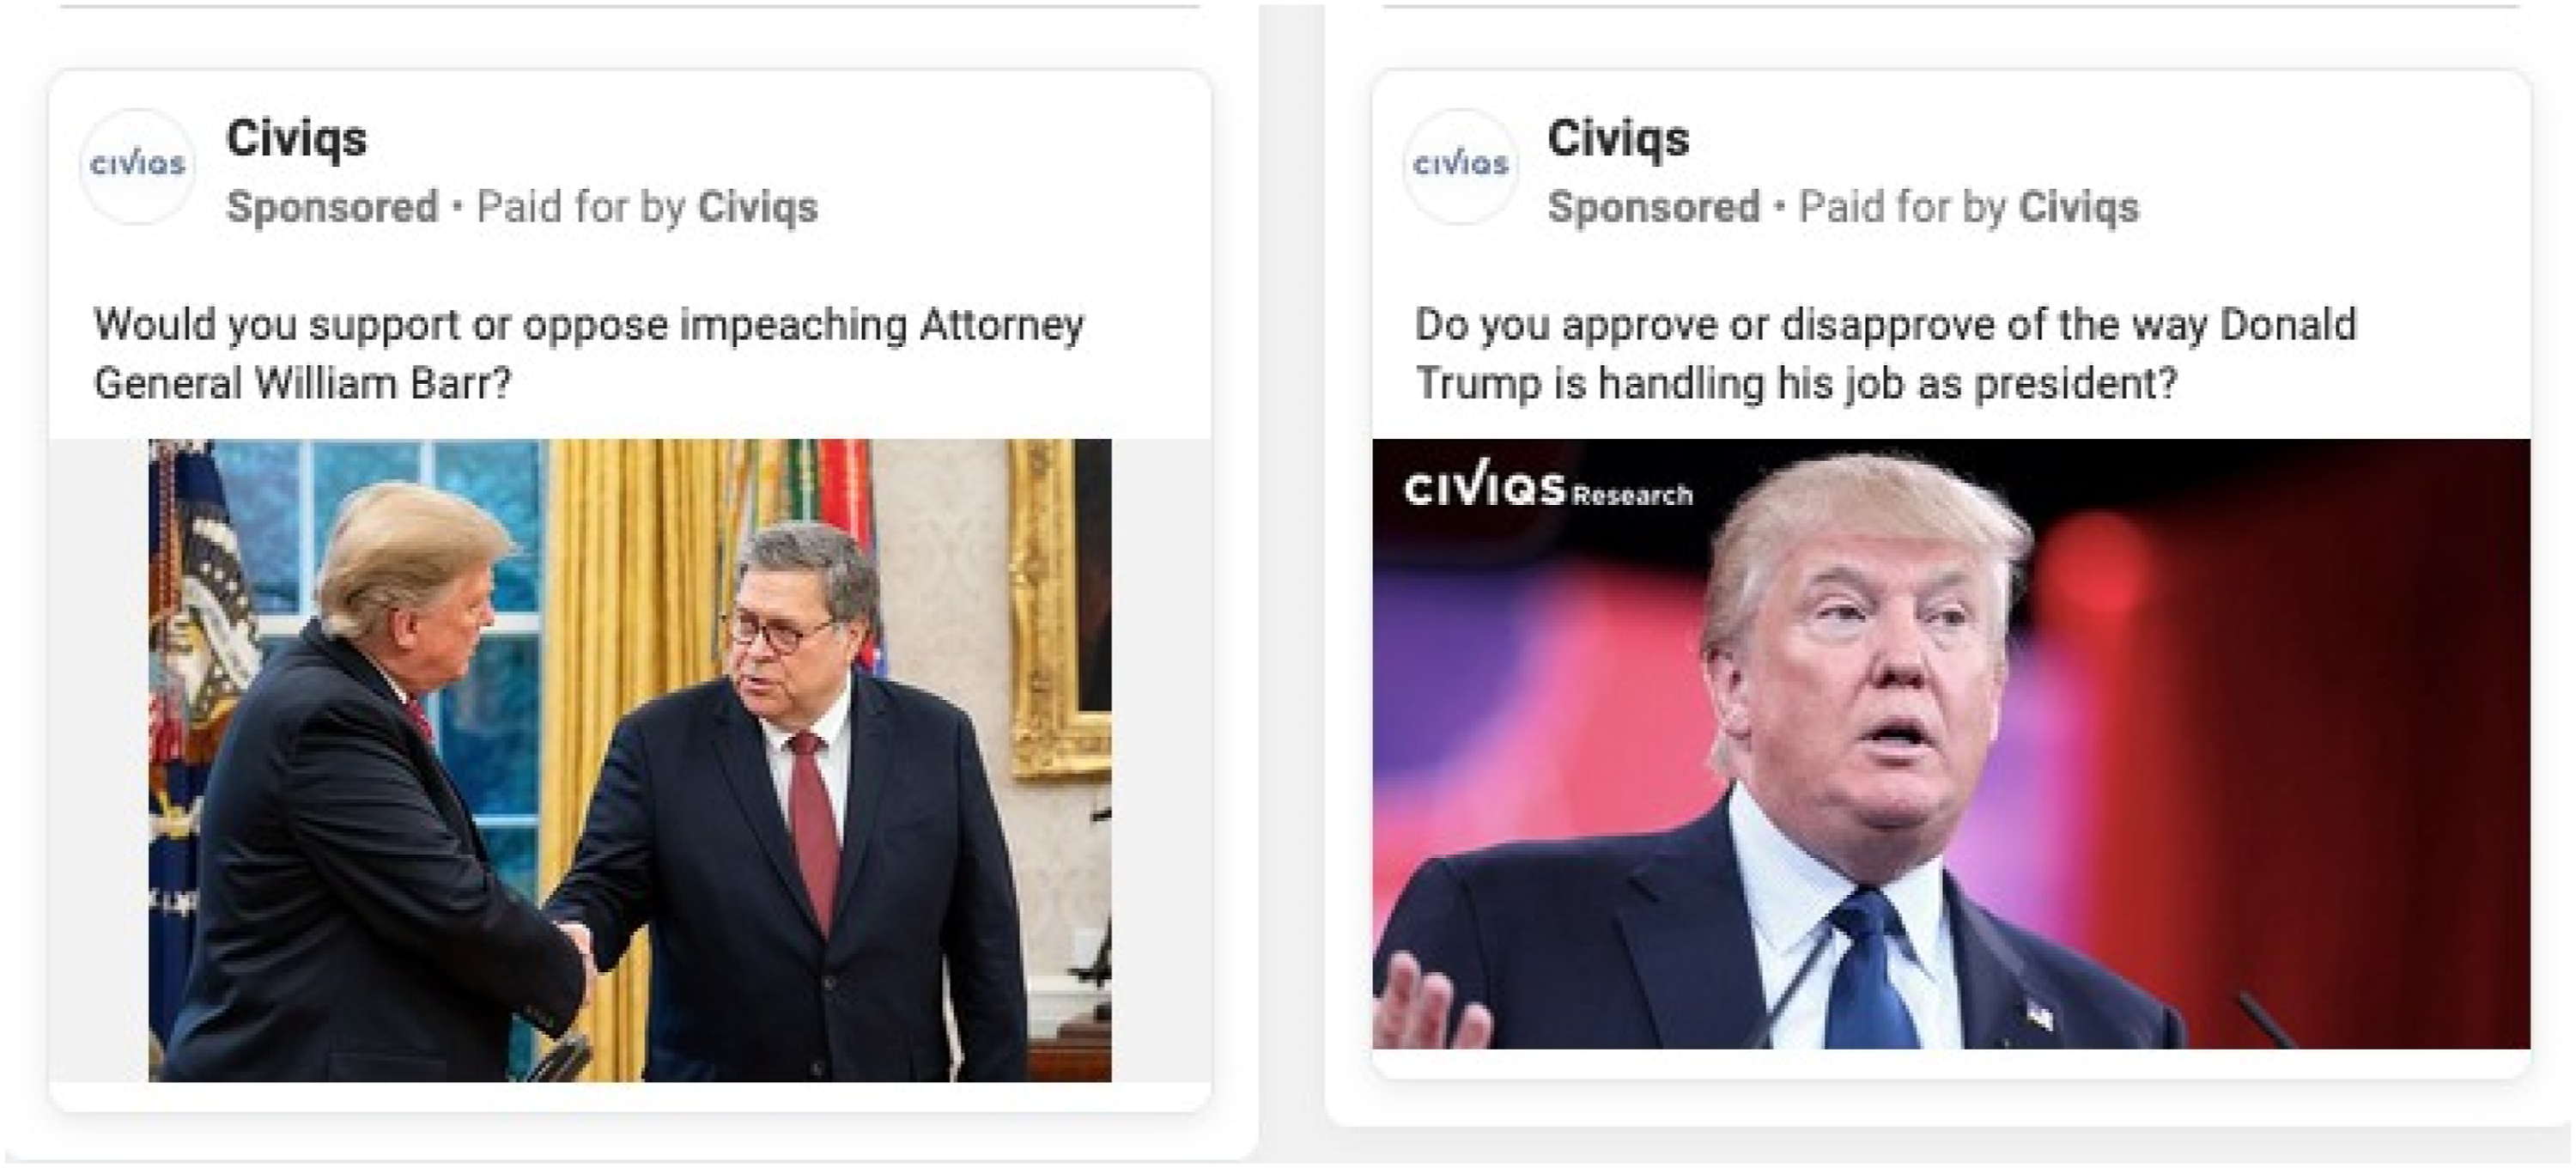
We first worked with Civiqs to increase its base of Pennsylvania panelists. Civiqs scaled up its usual online recruitment, placing various advertisements via multiple web platforms—of the 5189 panelists for whom source data is known, 67% came from Facebook, 31% from Google, and the remainder from Instagram. The recruitment advertisements varied but typically focused on current political issues; Appendix Figures 3 and 4 illustrate examples of the recruitment done for this study. 7 (It is plausible that these ads' political content encouraged politically engaged respondents to reply; below we report the results of a test with a less explicitly political advertisement. See also Hopkins et al. 2024, which employ Facebook ads with images of respondents' neighborhoods to recruit respondents.) In all, 48% of our panelists were drawn from Civiqs' augmented recruitment in Pennsylvania while the remaining 52% had been empaneled previously. Below, we report attempts to recruit respondents via less political materials. On the potential to recruit diverse samples via Facebook, see Zhang et al. (2018) and Sances (2021).
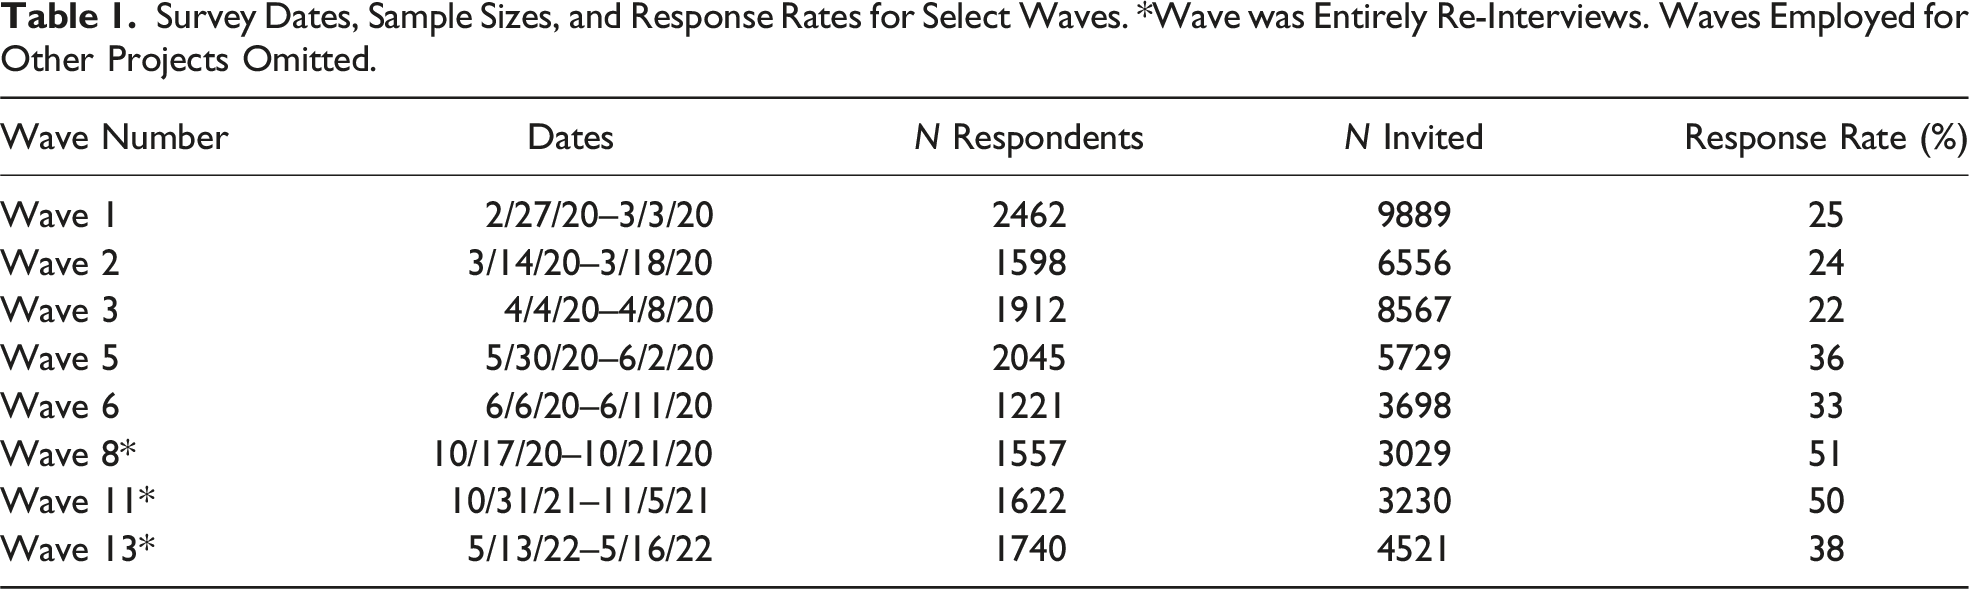
Survey Dates, Sample Sizes, and Response Rates for Select Waves. *Wave was Entirely Re-Interviews. Waves Employed for Other Projects Omitted.
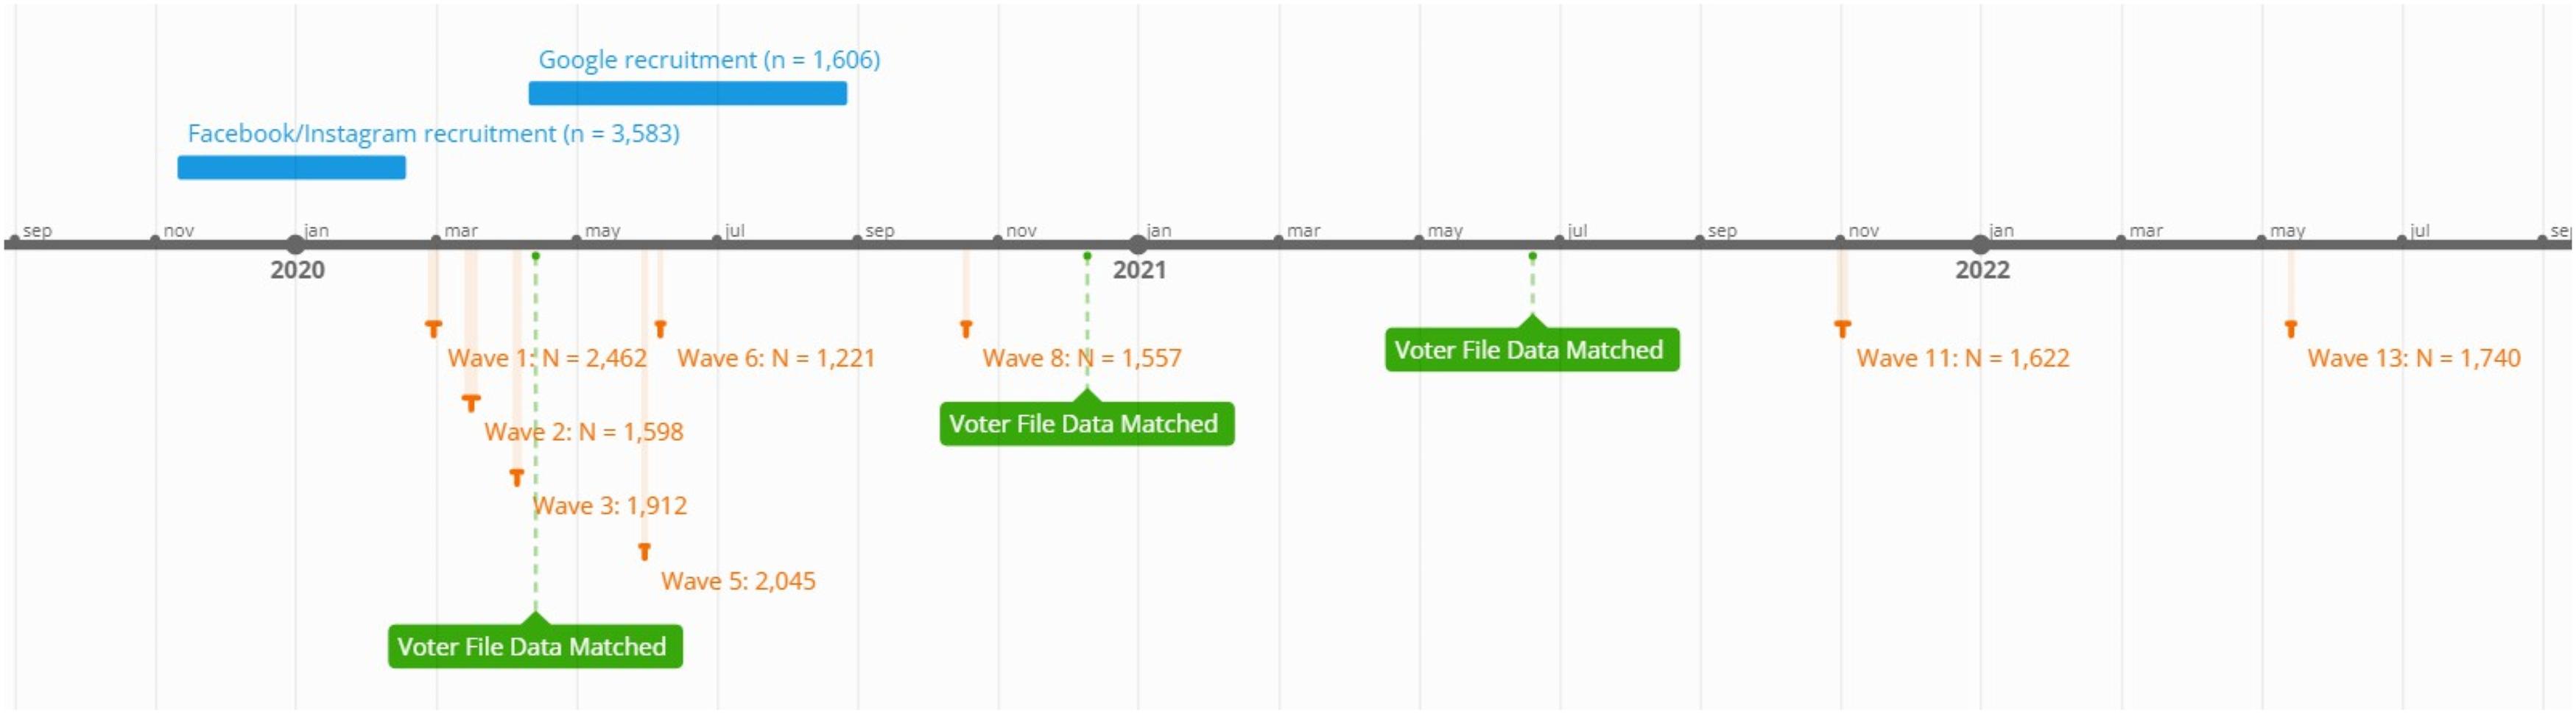
Flowchart illustrating timing for recruitment, surveys, and voter file matching.
Compliance with Ethical Standards
This research adheres to the American Political Science Association’s Principles and Guidance on Human Subject Research. It was reviewed by the University of Pennsylvania Institutional Review Board twice, with the survey and intervention determined exempt. In response to Civiqs advertisements on Facebook, Google, and Instagram, 8 subjects volunteered to take occasional, brief online surveys for free. Survey links were provided by email, and subjects could decline to participate.9,10
Comparisons with Benchmarks
How do our panelists compare to registered Pennsylvania voters? To answer, we acquired validated vote history information. Partnering with two outside vendors—Civiqs and TargetSmart—we were able to obtain such information for 65% of our respondents. The remaining 35% of respondents could be unmatched for multiple reasons: either they did not provide Civiqs with the correct personally identifying information (PII) necessary or they did not appear in TargetSmart’s database of registered voters. 11 The 65% match rate is quite similar to the 69% of 2022 Cooperative Election Study respondents who matched to TargetSmart (Ansolabehere et al. 2023).
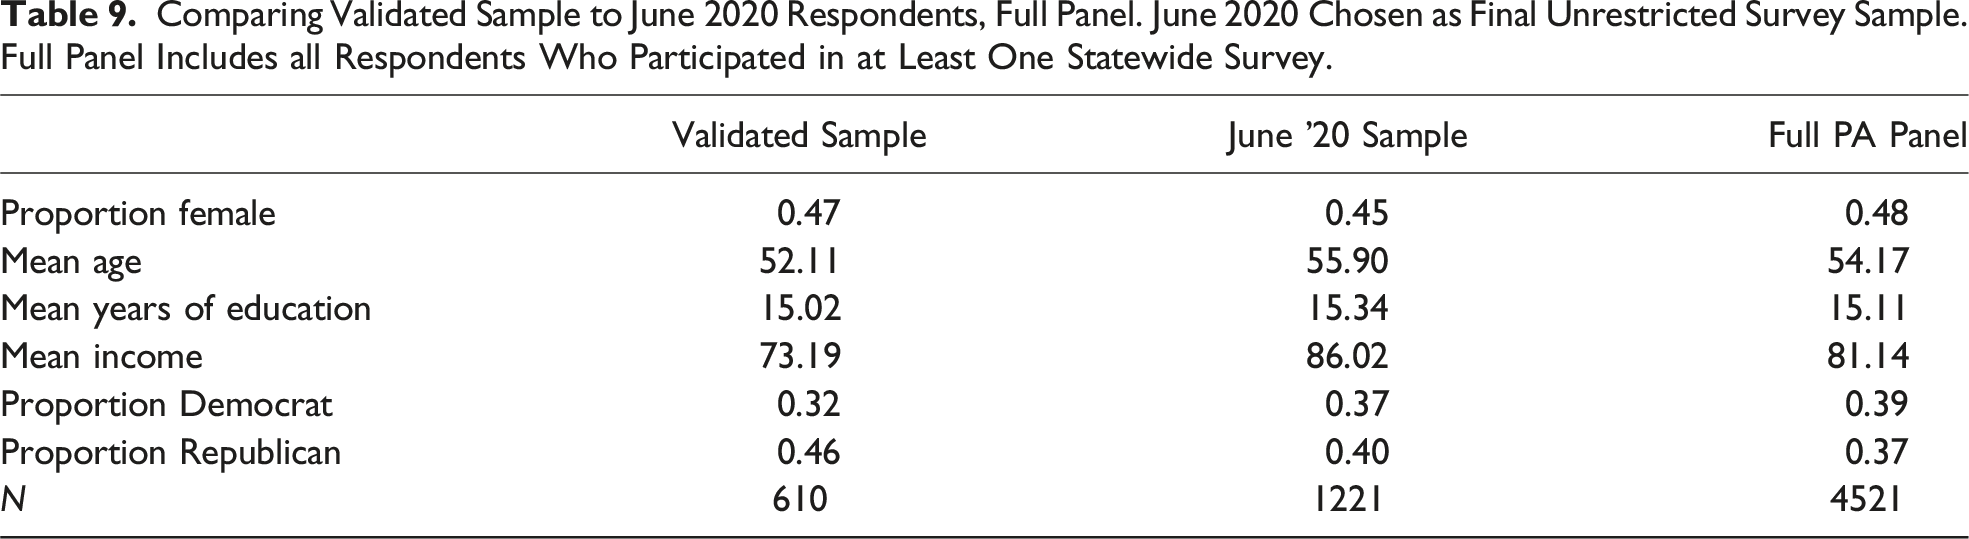
Civiqs’ panelist recruitment and matching to TargetSmart data was ongoing during the ad-ministration of this panel. Thus, while we acquired TargetSmart data three separate times, these analyses focus on 610 panelists whose vote histories were obtained from TargetSmart on June 20, 2021. We opt to highlight this subset because all of these respondents were recruited as part of this panel, meaning that it excludes respondents recruited by Civiqs for surveys prior to the inception of this project and so reduces heterogeneity by recruitment date.
One straightforward concern is that those who do match to the voter file might be more politically engaged than other respondents. However, when analyzing self-reported political giving, we find that respondents who did match in June 2021 reported lower levels of donations (41% versus 49%; t test p-value = 0.01) compared to those who did not. The two groups do not differ meaningfully in their self-reported attendance at Trump rallies (10% versus 9%; t test p-value = 0.64). This suggests that by analyzing the turnout patterns of respondents who did match to the voter file, we are not systematically excluding less-engaged individuals.
Appendix Table 9 provides evidence that these respondents are broadly similar to panelists outside this sample on other dimensions, although those who matched are (unexpectedly) more Republican-leaning. Appendix Table 9 suggests that the pro-Republican lean may originate partly from the matching process—which respondents are willing to give valid names and addresses—although the partisan skew is less pronounced when looking at respondents who matched in December 2020. 12 Accordingly, the partisan skew may also be partly an artifact of the timing by which Republicans were willing to provide personal information.
Separately, we obtained voter history information for a random sample of 20,000 Pennsylvania registered voters which serves as a baseline.
13
For both the random sample of voters and our matched panelists, we calculated the fraction who had voted in 0, 1, 2, or 3 of the most recent three federal elections (2016, 2018, and 2020); the results are displayed in Figure 2. Among the baseline sample of registered voters (light grey bars), 11% voted in none of those three elections, 18% voted in one, 19% in two, and the remaining 53% in all three. However, among the matched panelists (dark grey bars), turnout is much higher: 80% voted in all three elections and 14% voted in two. As compared to a random sample of Pennsylvania’s registered voters, our matched panelists are much more likely to consistently vote. Fraction of a random sample of 20,000 Pennsylvania registered voters and our panelists (n = 610) by number of validated votes cast in general elections, 2016–2020.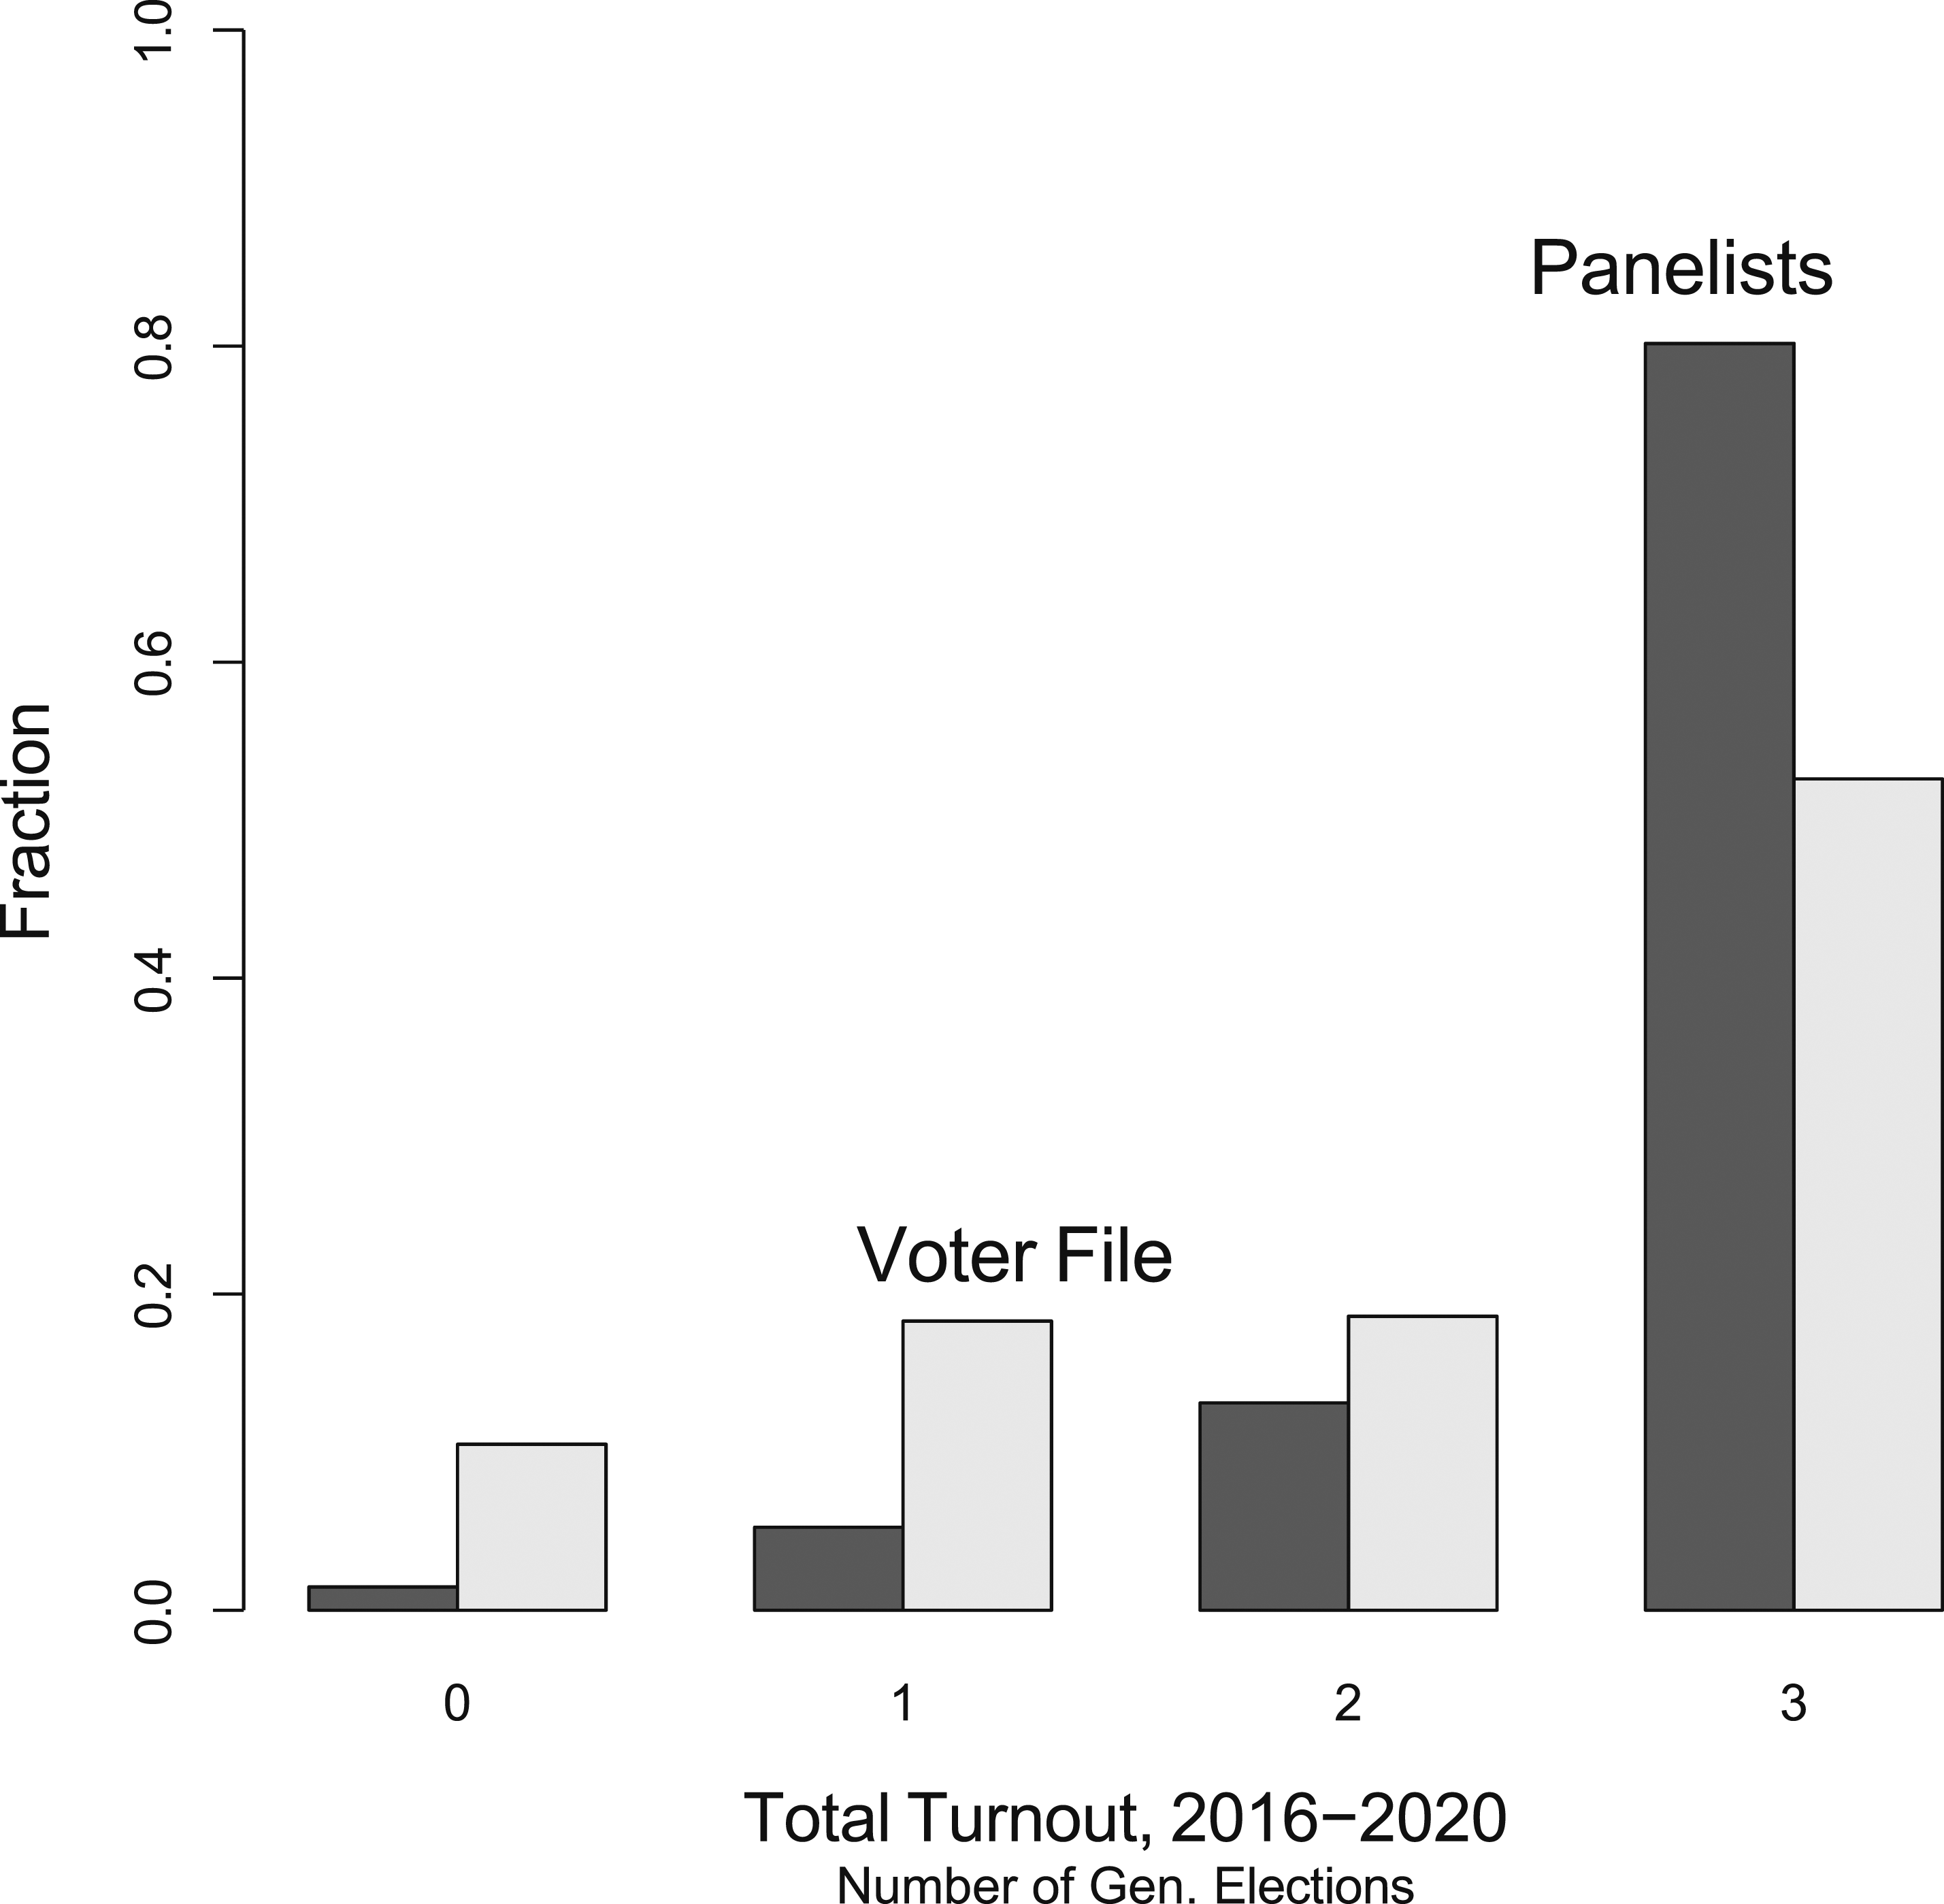
Means for a Random Sample of 20,000 Pennsylvania Registered Voters Compared to 610 of Our Panelists With Voter File data. Racial Demographics and Marital Status Estimated by TargetSmart.
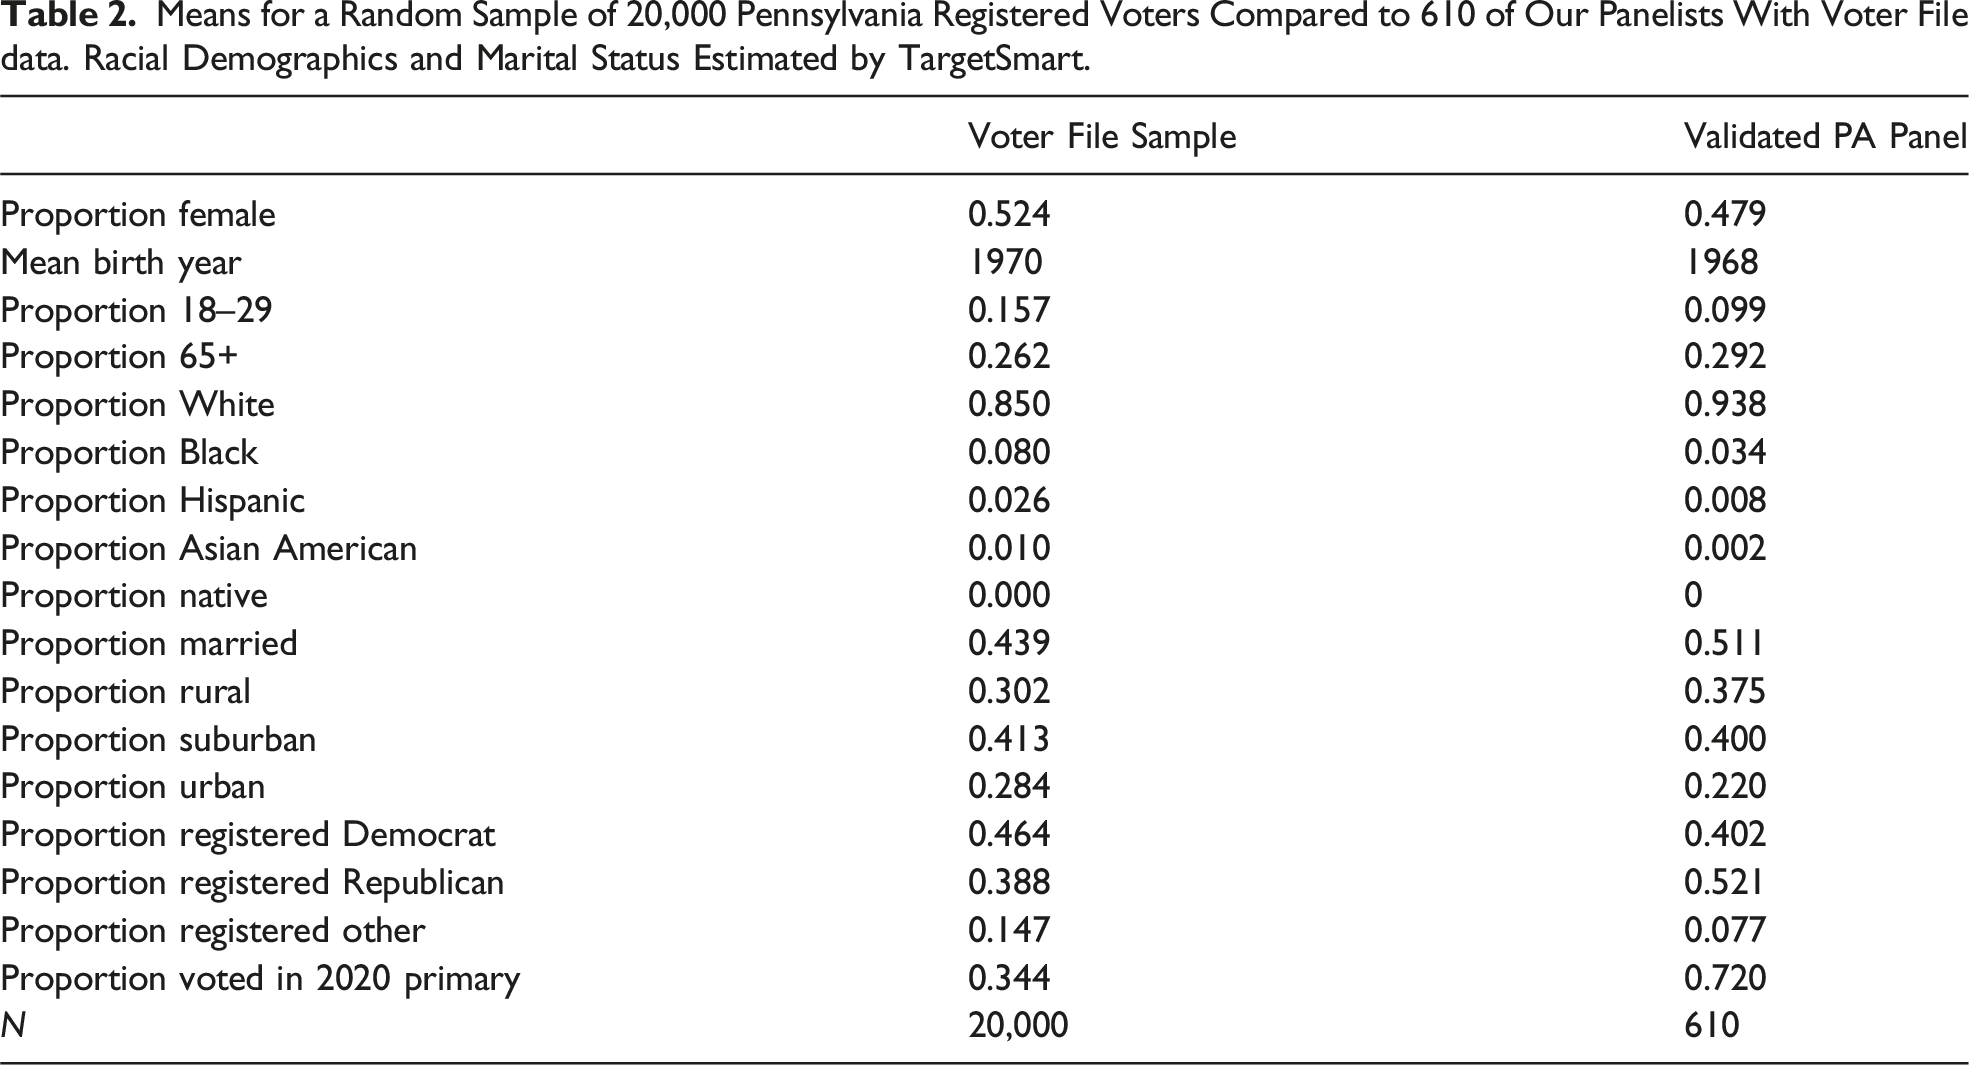
TargetSmart also provides model-based estimates of various demographics; these show that our panelists are more likely to be White (88% of statewide registered voters via TargetSmart or 90% via the CPS versus 94% in our panel) and less likely to be Black (8% statewide via TargetSmart or 7% via the CPS versus 3% in our panel), 15 Hispanic (3% statewide via TargetSmart or the CPS versus 1% in our panel), or Asian American (1.0% statewide via TargetSmart or the CPS versus 0.2%). 16 The online panel also under-represents urban residents (28% versus 22%). Our panelists are born 2 years earlier on average, making them slightly older than the state population. Stereotypes that older voters are harder to reach online appear to be incorrect.
When asked in Wave 1 (February/March of 2020) if they had “donated money to any political candidates in the last 2 years,” 47.8% of unweighted respondents said “yes,” and that number changes only slightly—to 47.5%—with weights. 17 As a baseline comparison, we found that only 0.47% of the Pennsylvanian voting age population made an itemized contribution to a federal candidate during the same period. 18 That figure is almost certainly an under-estimate, as not all donations to federal candidates are itemized. Hughes (2017) reports that in the 2016 cycle, 15% of national survey respondents reported making a political donation. Our panel’s estimate (48%) clearly reflects a difference from the general population—the question is of what order of magnitude.
The panel’s first wave also asked respondents, “Have you ever attended a political rally for Donald Trump?” 9.3% of all respondents—and 17.9% of all Republican respondents—said “yes.” 19 As a baseline comparison, we used real-world crowd-size reports to estimate the proportion of Pennsylvania voters who have attended Trump rallies at between 0.7 and 1.4%. 20 Trump rallygoers, many of whom are strong partisans, are vastly over-represented in our data set. Also, unlike our validated measures of turnout, it is possible that respondents may over-report donations or rally attendance in surveys, perhaps due to social desirability biases. Sampling may not be the only reason for our panel’s inflated estimates.
Race, Ethnicity, and Socioeconomic Status
Given that a majority of Americans identify as White, accuracy assessments in surveys targeting the population overall will be driven more by that group than others. As a consequence, it is particularly important to investigate who within different racial/ethnic groups participates in surveys.
We accordingly used the November 2020 CPS—accessed via IPUMS—to benchmark family income and education measures by race/ethnicity. We identified 1714 Pennsylvania respondents to that CPS, enabling us to isolate registered voters and employ that wave’s weights. Given the high levels of political engagement evident in our sample, we view registered voters as a valuable benchmark, even as we acknowledge that our panel’s sampling frame is technically adult residents of Pennsylvania rather than registered voters. Prior research demonstrates that registered voters tend to be older, more highly educated, and are more likely to be White than adults (Fraga 2018; Leighley and Nagler 2013; Verba et al. 1995), so if anything, our use of registered voters as a benchmark understates the extent of the biases.
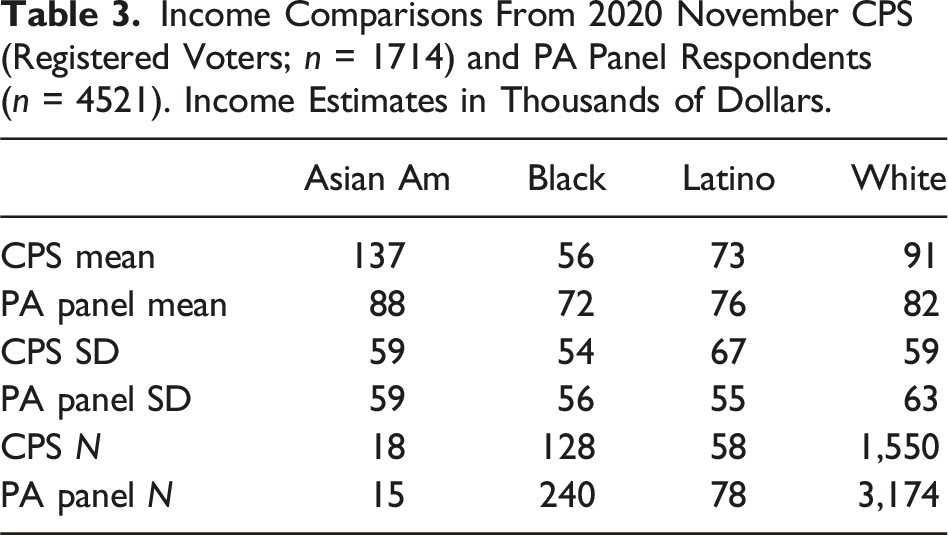
Income Comparisons From 2020 November CPS (Registered Voters; n = 1714) and PA Panel Respondents (n = 4521). Income Estimates in Thousands of Dollars.
Proportion of Respondents Completing College by Racial/Ethnic Group; Data From 2020 November CPS (Registered Voters; n = 1714) and PA Panel Respondents (n = 4521).
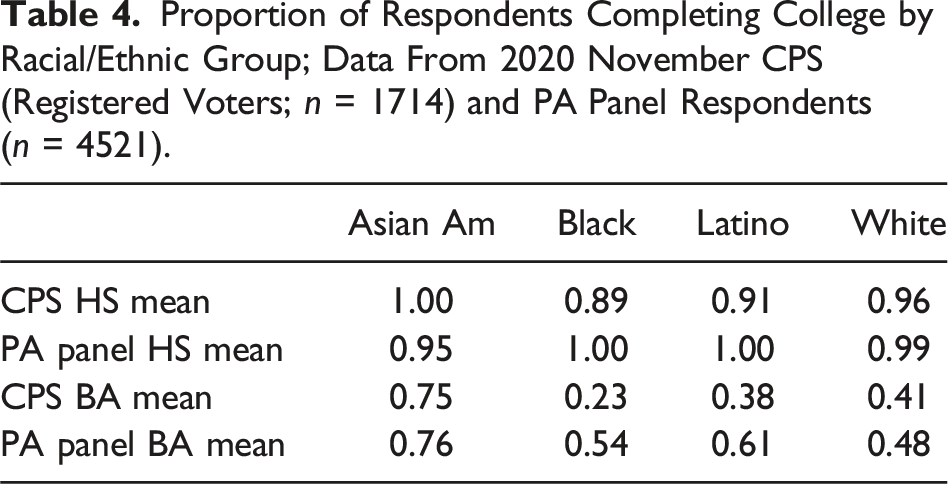
With respect to college degrees, the biases are even more pronounced. According to the CPS, 23% of Black registered voters in Pennsylvania have college degrees, but in our sample, the estimate is 54%. Among Latinos, the estimates are 38% (CPS) versus 61% (PA panel); for White respondents the estimates are meaningfully closer, at 41% and 48% (PA panel). In short, our sample significantly under-represents Black and Latino respondents without college degrees. While those without college degrees are under-represented, that under-representation varies by race/ethnicity. Given the association between educational attainment and political engagement, one likely effect is to overstate political engagement (Verba et al. 1995; see also Krupnikov and Ryan 2022).
Response Stability and Vote Choice
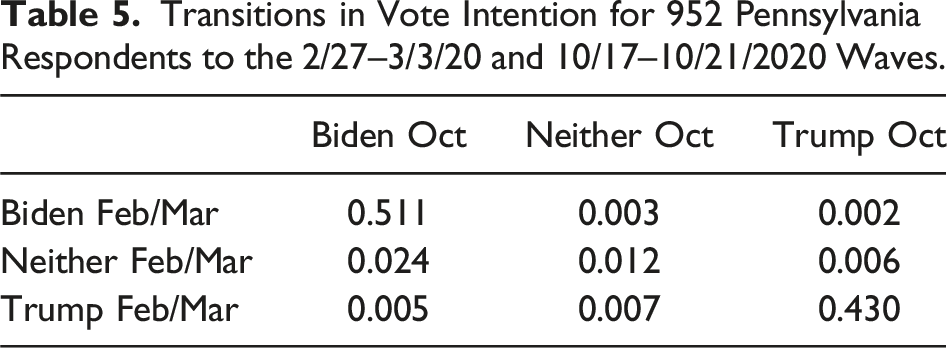
Transitions in Vote Intention for 952 Pennsylvania Respondents to the 2/27–3/3/20 and 10/17–10/21/2020 Waves.
This Table Reports Transitions in Vote Intention for 970 Respondents to a Separate Population-Based Panel Administered to a National Sample of Respondents 30 and Over.
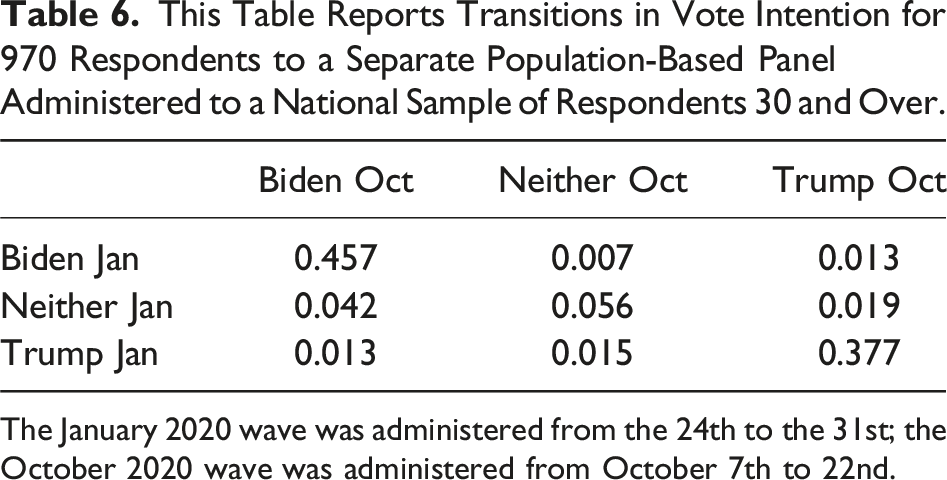
The January 2020 wave was administered from the 24th to the 31st; the October 2020 wave was administered from October 7th to 22nd.
Our panel’s sampling for the October 2020 wave focused on February/March respondents, and so was not designed to estimate Pennsylvania voters’ preferences. However, the weighted breakdown was 51.6% for Biden versus 46.4% for Trump. In reality, Biden won Pennsylvania by a similar but smaller margin of 50.0 to 48.8.
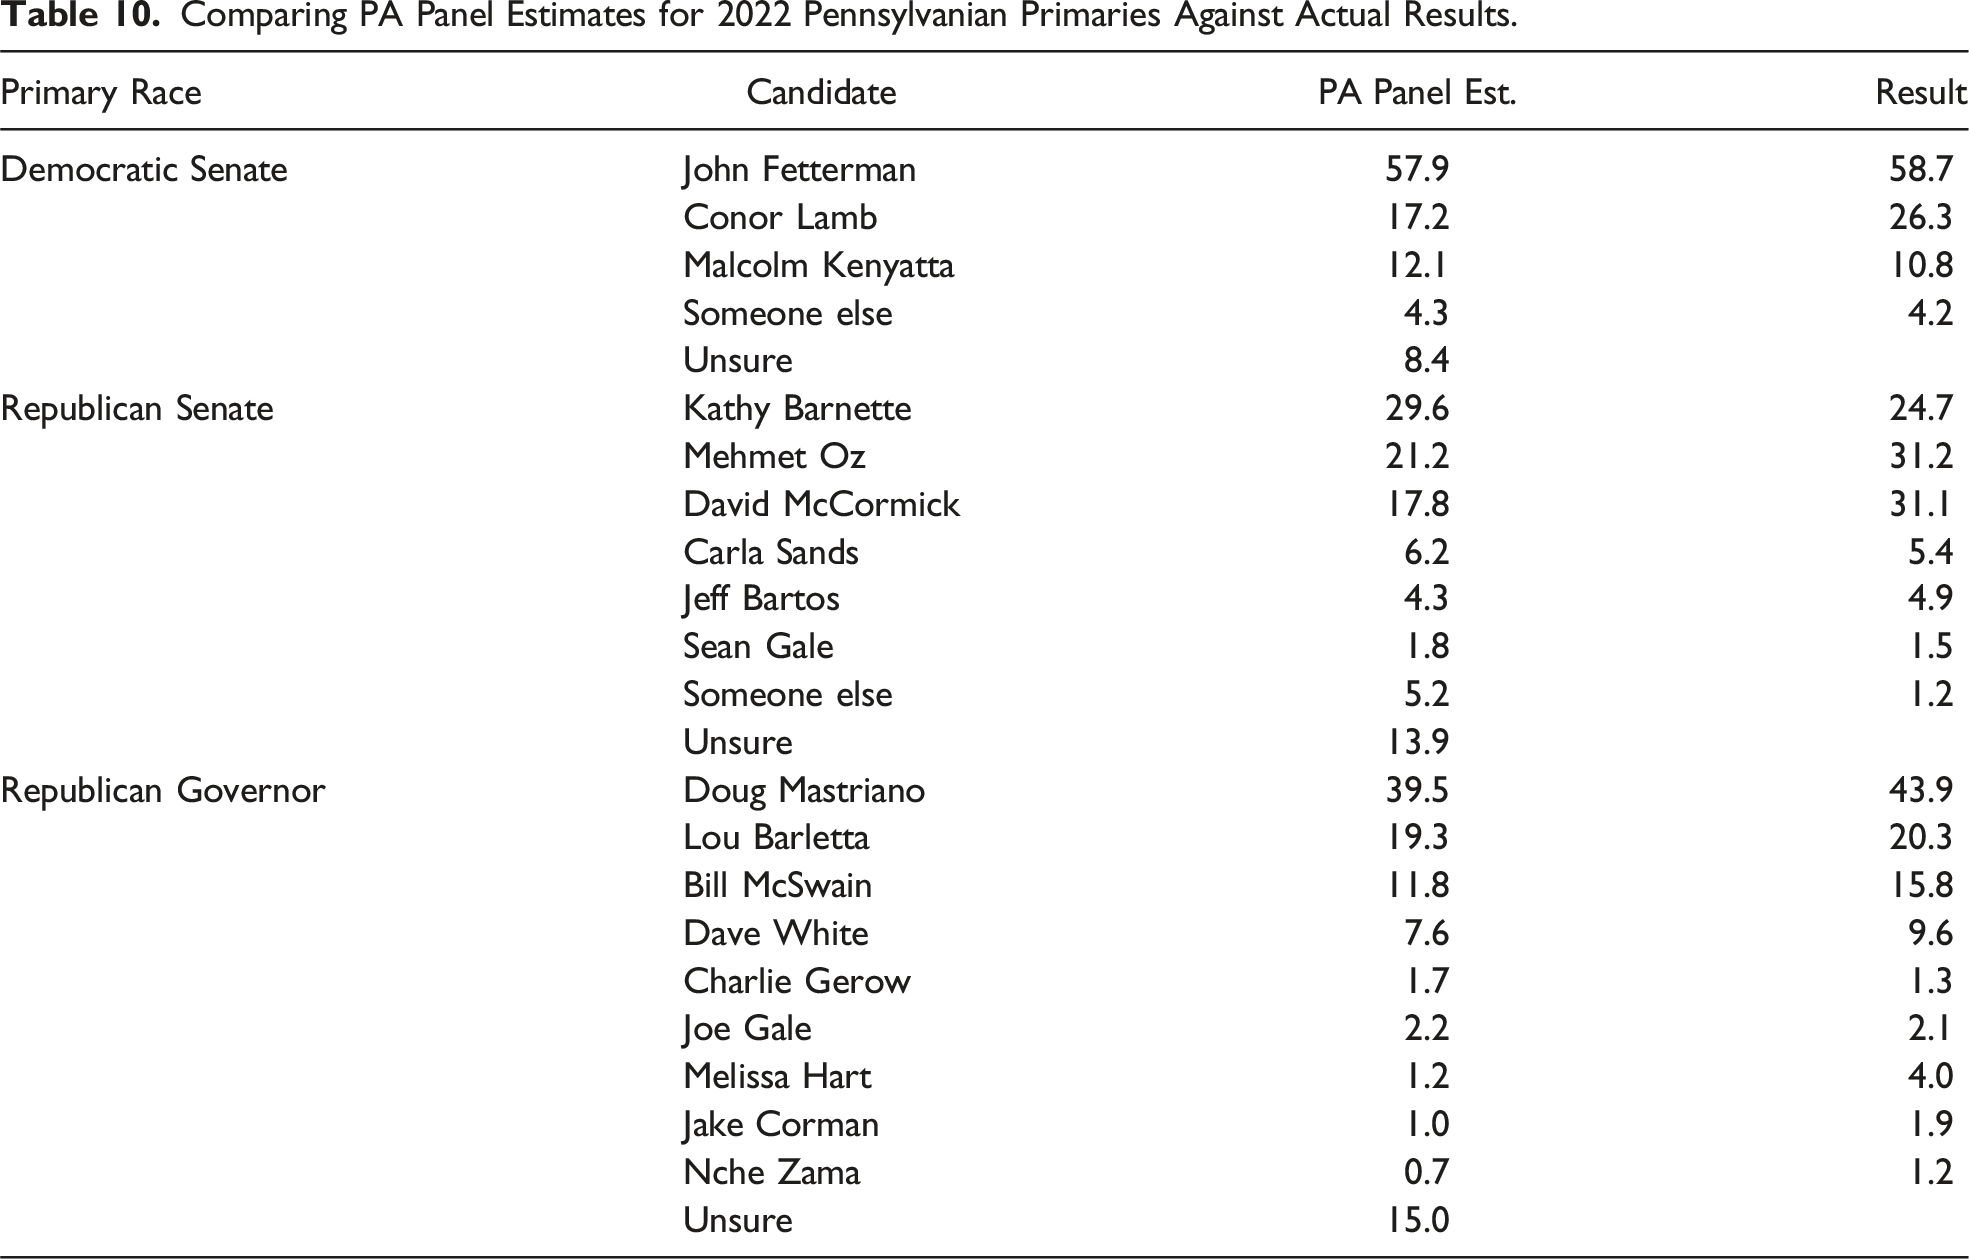
The May 2022 Pennsylvania primaries provide another opportunity to test whether our panelists under-represent support for specific types of candidates. Voting in primaries is not anchored by partisanship to nearly the same extent as in general elections, meaning that primaries represent a harder test for survey research. As Appendix Table 10 illustrates, after removing respondents who said they would not vote in the GOP primary, 29.6% of our weighted panelists expressed support for Senate candidate Kathy Barnette, 21.2% for Mehmet Oz, and 17.8% for David McCormick. 21 In reality, Barnette received 24.7% of the vote, Oz got 31.2%, and McCormick secured 31.1%. Very conservative, Barnette lacked the campaign budget of her chief rivals and relied more on media appearances to garner support; her support appeared to grow late in the campaign, and she may have done especially well among voters who followed the campaign closely. The over-representation of Barnette support is thus consistent with a characterization of our panelists as very politically active. Still, why our sample under-represented support for Oz and (to a greater degree) McCormick is not clear, as both (Trump-backed) Oz and McCormick had well-funded campaigns and ran millions of dollars in advertisements.
In the GOP’s 2022 gubernatorial primary, 39.5% of respondents backed Doug Mastriano while 19.3% backed Lou Barletta and another 11.8% backed Bill McSwain. These results were reasonably close to the election returns, which put the Trump-backed populist Mastriano in the lead with 43.9% of the vote, ahead of the Trump-style former Congressperson Barletta with 20.3% and former prosecutor McSwain (whom Trump pointedly did not endorse) with 15.8%. In the Democratic Senate primary, 57.9% of panelists backed John Fetterman versus 17.2% for Conor Lamb and 12.1% for Malcolm Kenyatta. Those numbers are not far from the reality of Fetterman winning with 58.7% of votes, followed by Lamb with 26.3%, and Kenyatta with 10.8%, although the survey did under-state support for the more moderate Conor Lamb.
Overall, these results indicate that our panelists are reasonably representative of primary voters, and that more populist, Trump-style candidates are not consistently disadvantaged. If anything, our poll under-represented support for more establishment-oriented candidates like McSwain and Lamb while overstating support for Barnette. In sum, our poll does not appear to have some of the biases noted in other surveys, such as a consistent bias against Trump-style candidates or candidates from minority ethnic/racial or religious backgrounds (Hopkins 2009).
Recruiting Lower-Turnout Voters
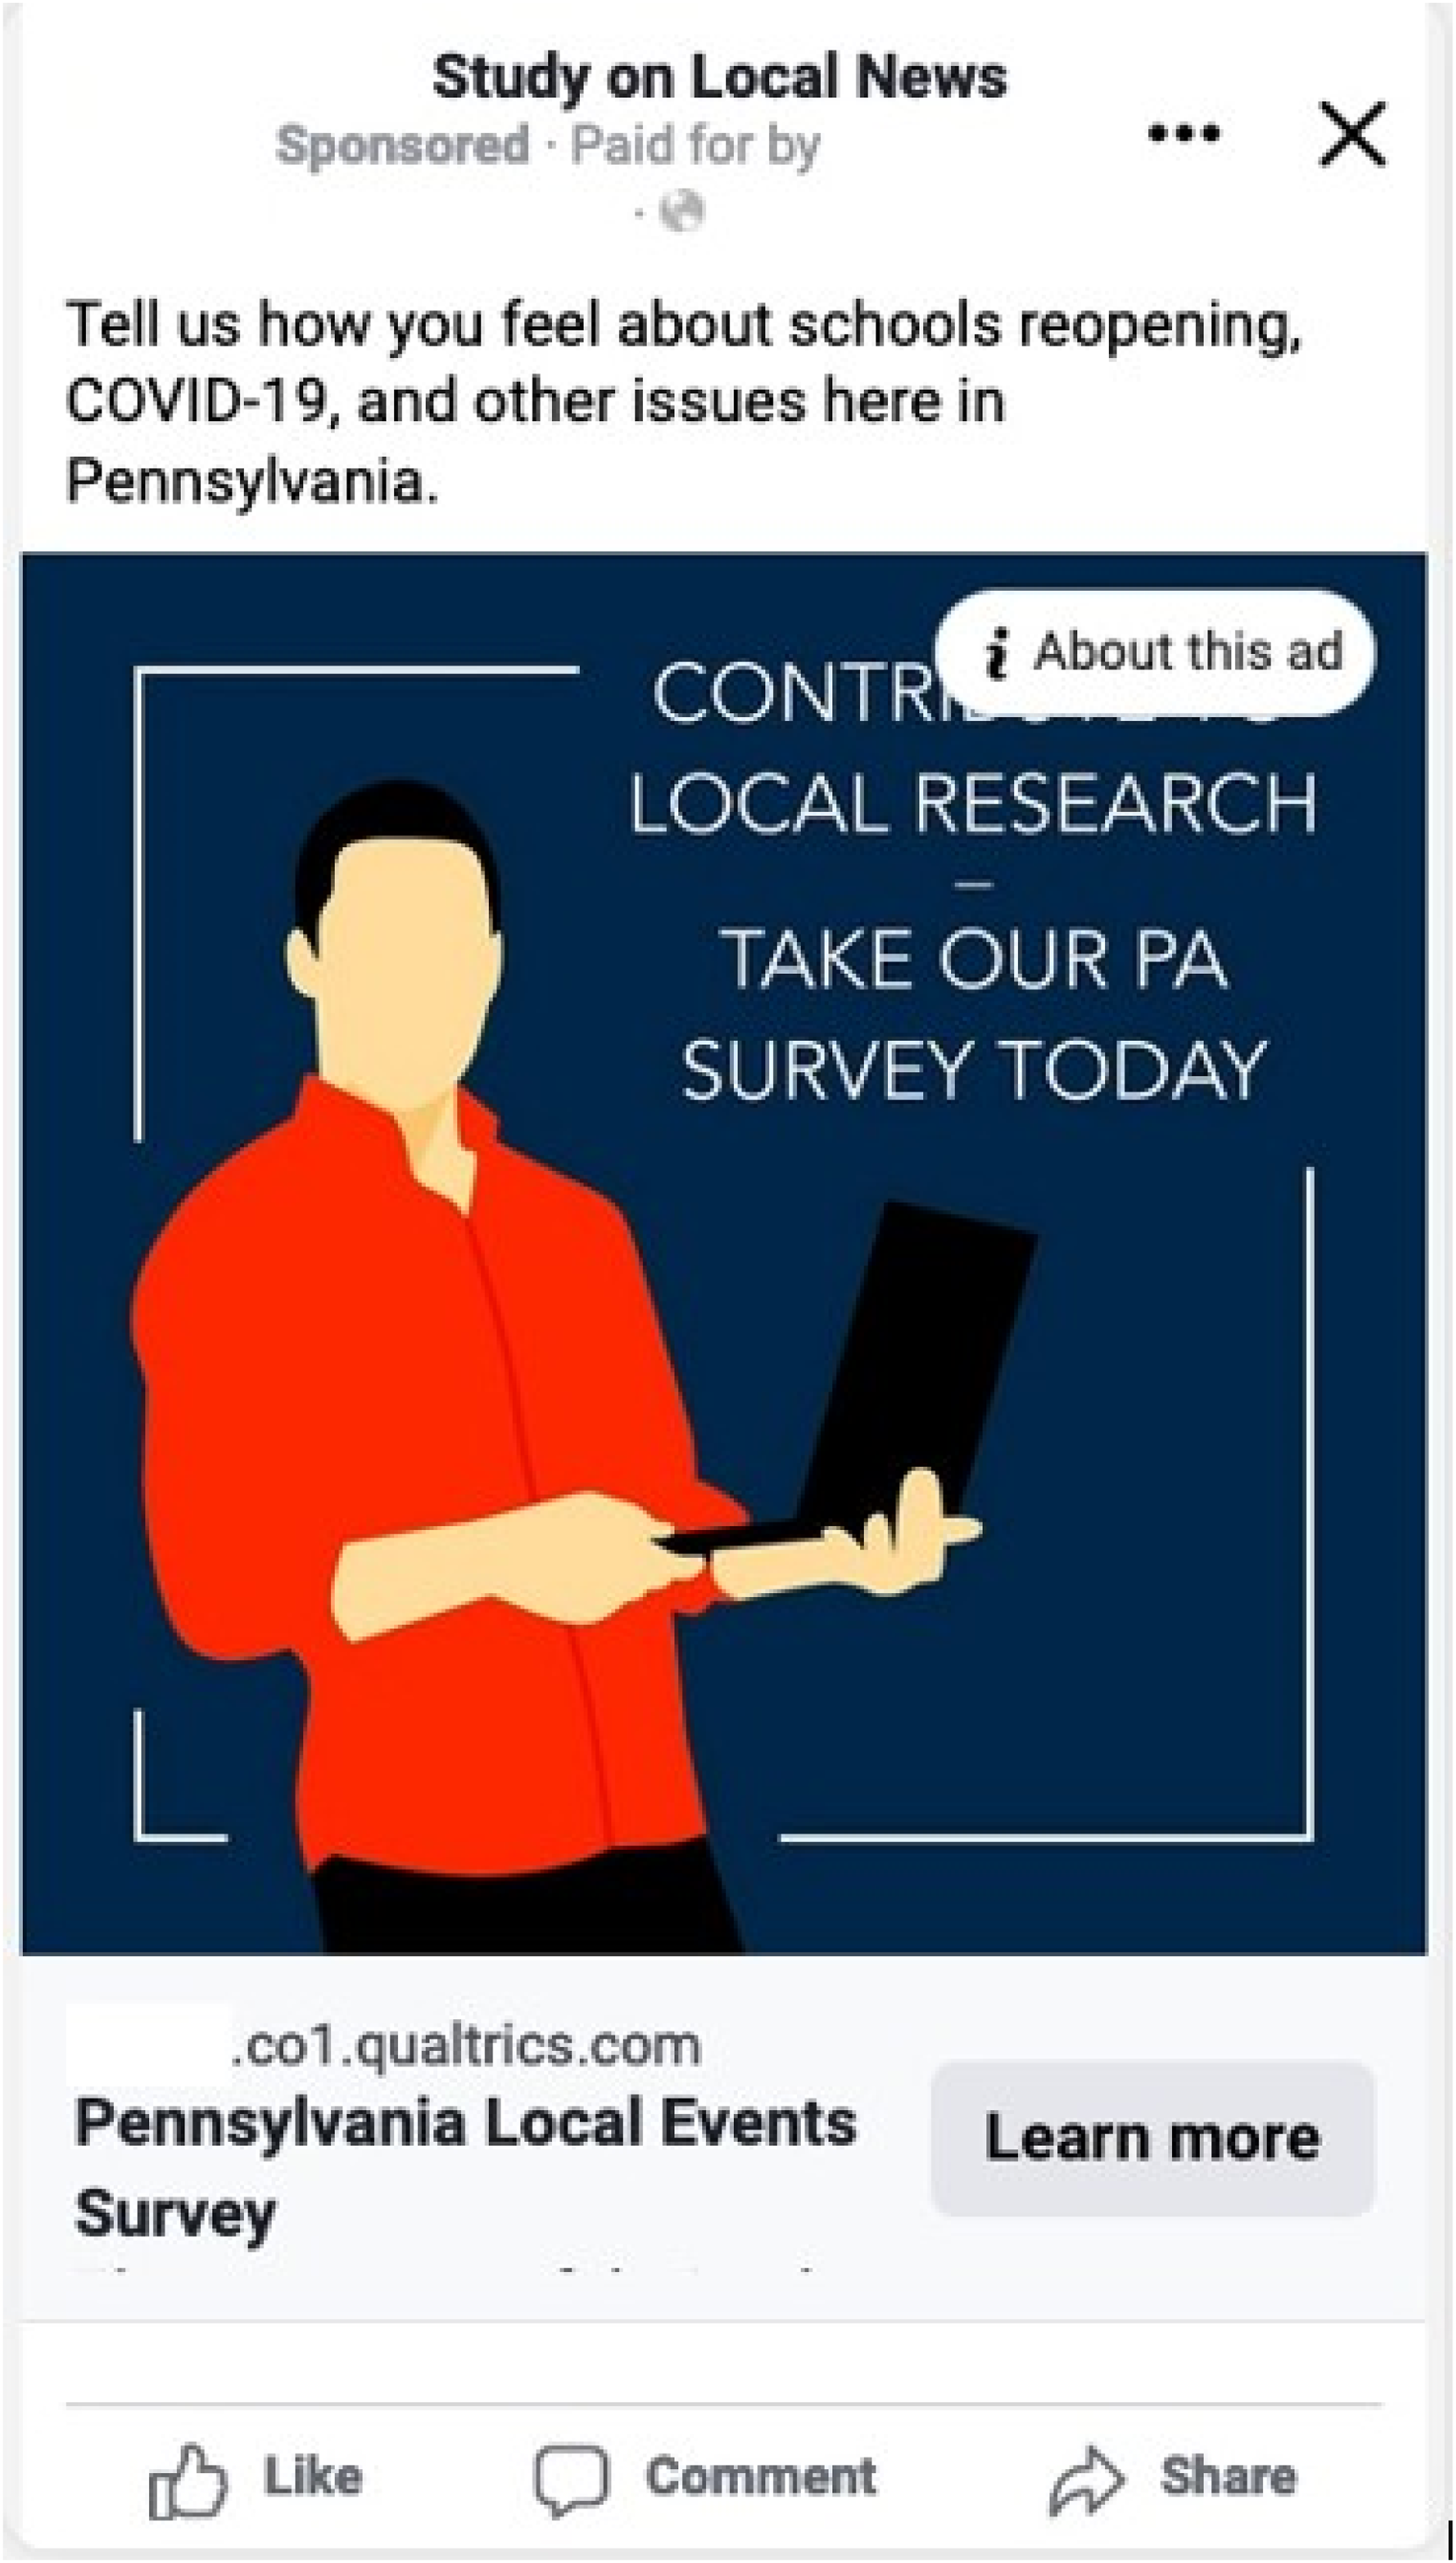
Given the high levels of political engagement detailed above, we attempted a separate effort to survey low-turnout Pennsylvania voters, which was conducted outside of our partnership with Civiqs. We first drew a random sample of 9937 registered Pennsylvania voters who had voted no more than one time in the 2012, 2014, 2016, and 2018 cycles from a February 2019 Pennsylvania statewide voter file. Via TargetSmart, we then successfully matched 9332 of these registered voters to its database, and were able to purchase 9627 phone numbers for these individuals as well as 2849 email addresses. We next uploaded the TargetSmart data to Facebook using its Custom Audience feature, and served 1321 separate targeted individuals with advertisements inviting them to take a survey (see Appendix Figure 5 for the advertisement). Note that this advertisement was less explicitly political than some of those employed in the Civiqs recruitment detailed above. In total, we paid $235.53. Facebook records indicate 66 individuals clicked on the advertisement. Of these, 7 began the survey, 6 completed it, and 1 left an email address for possible follow-up surveys.
Even if we only consider those who saw the Facebook advertisement, the response rate was 0.4%. While assessing low-engagement registered voters via these methods is much more costly, such costs are broadly in line with those for recruiting population-based samples. Thus, such methods may be useful in some cases, especially when complementing the lower-cost recruitment of more engaged respondents. Future research should consider survey invitations that are entirely apolitical, such as those inviting respondents to participate in a survey about entertainment or sports.
Differential Partisan Response: An Experiment
Our panelists are more partisan and politically engaged than registered Pennsylvania voters. At least for these panelists, panel enrollment and survey response have the appearance of being opportunities to express their political identities (see also Malka and Adelman 2022). The evidence to date is consistent with a model of respondents as motivated partisans who participate in surveys to represent their partisan side (see also Clinton et al. 2022; Graham and Huber 2021). These observations lead to a follow-up question: is there a temporal dimension to their survey participation, with panelists more likely to take surveys when their partisan side is advantaged? Gelman et al. (2016) report that in the 2012 election, sample composition explained more of the change in polling than did actual vote intentions. It’s possible such threats are especially pronounced with highly engaged samples.
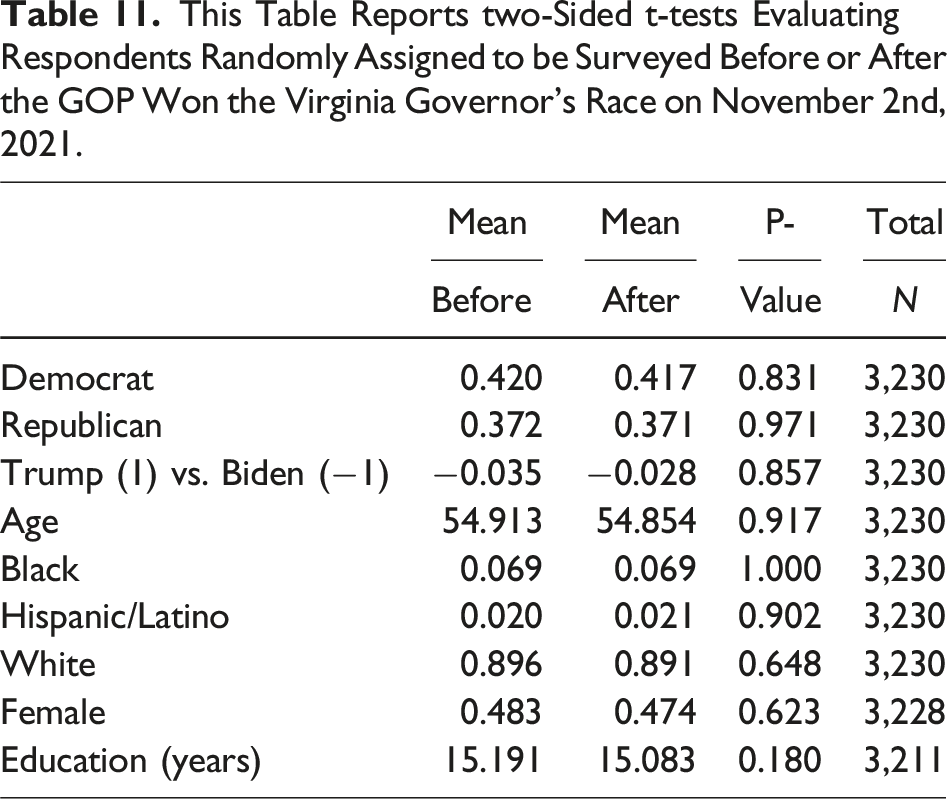
To test that prospect, we conducted an experiment straddling the November 2021 elections. Specifically, in late October 2021, we blocked 3230 panelists from prior survey waves into pairs using demographics such as racial self-identification and political partisanship (Moore 2012). 22 Within each matched pair, we then randomly assigned respondents to be invited to take a survey either on Sunday, October 31st or Wednesday, November 3rd. In the intervening period, Virginia Republican gubernatorial candidate Glenn Youngkin won an unexpected victory over his Democratic rival on Tuesday evening, November 2nd. While this was a governor’s race outside Pennsylvania, it was closely followed by political activists, and made national headlines; a Republican won a statewide race in Virginia for the first time since 2009. Our hypothesis was straightforward: Republicans invited to participate just after Youngkin’s victory would be energized and would be more likely to complete the survey, while Democrats would be less likely. Of the 1615 panelists randomly assigned to be invited before the election, 806 completed the survey, for a response rate of 49.9%. After the election, of the other 1615 panelists, 816 responded (50.5%). A test of equal proportions indicates no meaningful difference between the samples (p = 0.75). Overall, the response rate was virtually identical before and after the election.
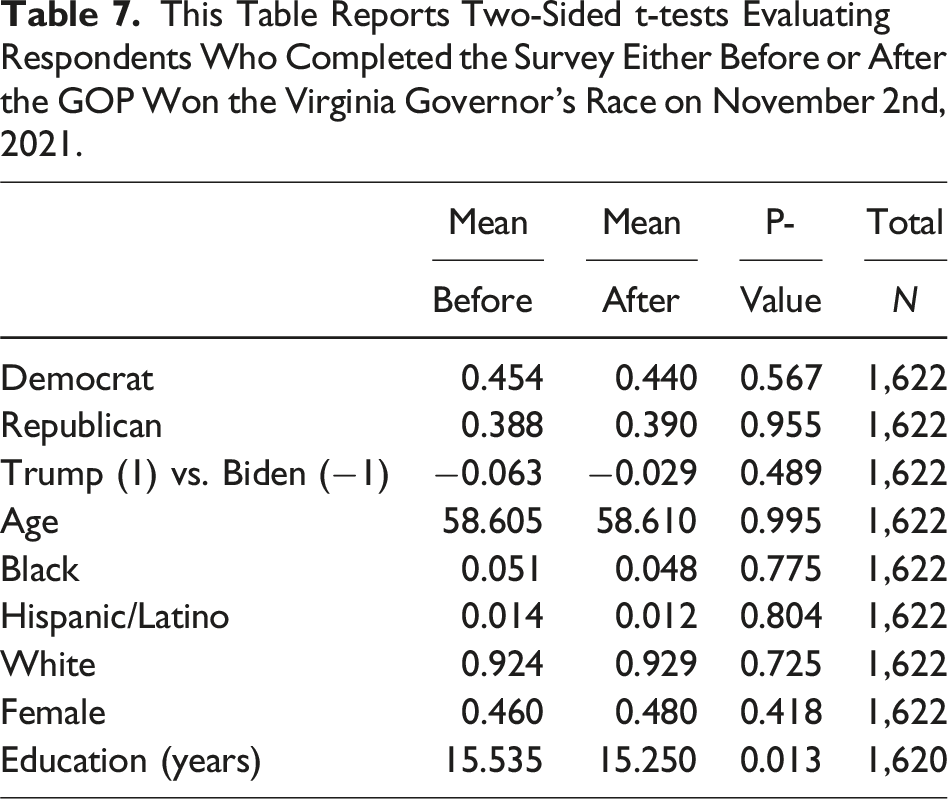
This Table Reports Two-Sided t-tests Evaluating Respondents Who Completed the Survey Either Before or After the GOP Won the Virginia Governor’s Race on November 2nd, 2021.
Conclusion
Contemporary political science hinges on researchers' capacity to survey populations of interest. In recent years, declining response rates via traditional telephone polls—alongside new opportunities afforded by online survey administration—have led to an explosion of online polls, many with non-probability samples (e.g., Ansolabehere and Schaffner 2014; Rivers and Bailey 2009). For researchers, such polls have provided newfound opportunities to conduct cost-effective survey experiments with broader, more diverse populations. They also afford the opportunity to resample respondents at relatively low cost (see also Broockman et al. 2017).
Nonetheless, as survey response rates decline, understanding the correlates of survey participation—and the effects of various recruitment strategies—becomes increasingly vital. Survey non-response can produce a distorted image of the electorate which overstates political awareness and polarization (Ansolabehere and Hersh 2012; Cavari and Freedman 2022; Krupnikov and Ryan 2022). In 2020, polls under-estimated support for incumbent president Donald Trump, in part because of the under-representation of less engaged voters (see also Clinton et al. 2021; Clinton et al. 2022; Krupnikov and Ryan 2022).
Already, researchers have undertaken several efforts to validate online, opt-in samples (e.g., Ansolabehere and Schaffner 2014; Dutwin and Buskirk 2017; Keeter 2018; Kennedy et al. 2016; MacInnis et al. 2018; Malhotra and Krosnick 2007; Yeager et al. 2011) as well as online recruitment methods (Sances 2021; Zhang et al. 2018). This paper contributes by focusing on online respondents from one large American state who opt to take short, free surveys. This methodological approach has multiple advantages. For one, it enables us to benchmark various estimates against public records or other external estimates. It also permits researchers to be involved in the recruitment of online, opt-in respondents directly. Without compensation, bots may be less of a concern. Even today, telephone polling is typically uncompensated. Moreover, with rare exceptions (Shineman 2018), political participation itself is an uncompensated activity, so uncompensated surveys may help researchers understand political engagement and motivations. However, there are certainly downsides to uncompensated surveys. In some contexts, researchers may want or need to compensate subjects for their time, whether for ethical reasons or to enable varying experimental incentives.
We find that at an affordable cost, researchers can recruit sizeable numbers of highly engaged Republicans as well as Democrats to take uncompensated surveys—and that such respondents are frequently available for re-interviews, facilitating panels and experiments (Broockman et al. 2017) and opening new areas of inquiry. Activists are a vital, under-studied actor in American politics (but see Skocpol and Williamson 2012; Parker and Barreto 2014; Blum 2020), and research designs like those detailed here can access them repeatedly. In contrast to other research (Clinton et al. 2022; Gelman et al. 2016), we do not find evidence of differential partisan responsiveness. Activists from both sides are thus consistently available for surveys via this method. While we study participation in uncompensated surveys here, the prominent role of expressive partisanship in motivating survey responses may extend to decisions to participate in compensated surveys, too. Survey participation itself is a political behavior and needs to be understood as such.
In an era of low response rates and declining trust in researchers (Leeper 2019), many strategies for drawing samples will have limitations, and the strategy employed here is no exception. The free, online panel we have built under-represents registered voters who are Black, Latino, or Asian American, especially those with low educational attainment. That means that online, opt-in samples of respondents from these groups may be particularly skewed, a worrisome prospect given that those groups are often under-studied and under-represented (Segura and Rodrigues 2006). The danger that some emerging findings may not generalize to racial/ethnic minority populations is acute and normatively troubling. Given the stability of our respondents' attitudes, it is also possible that experiments with similar populations will under-state the effects of interventions.
It is possible that our results are influenced by the period of time in which we undertook this study. The COVID-19 pandemic disrupted many lives and may have influenced the population interested in taking online surveys. Another limitation of the sampling strategy detailed here is that activists may be particularly stable in their attitudes and hard to influence. As a consequence, experiments run with such samples may be more likely to generate null results than those using more broadly representative samples with more heterogeneity on political engagement.
The advantages and limitations uncovered here do not apply equally to all opt-in surveys. In- stead, they apply chiefly to those surveys using similar designs in which individuals are recruited online to periodically take short surveys for free. That, in turn, underscores that even among the surveys termed “opt-in,” there are important differences. The strengths and weaknesses of one opt-in sample may differ from those of another. It’s thus key to catalog the specific features of samples collected using varying strategies.
Still, opt-in designs like those studied here are commonly employed, especially in evaluating the impact of experimental interventions or in settings where maintaining anonymity is paramount (e.g., Carpenter 2012; Ceelen et al. 2019; Hopkins and Gorton, 2024; Williams, Gravelle and Klar 2022). Moreover, this research identifies straightforward ways to improve current practice. Researchers using online, opt-in samples would do well to learn and report key facts about the recruitment methods employed in sample construction. They also benefit from collecting and reporting external benchmarks not just on demographic measures but also political engagement, especially verifiable behaviors such as vote history. Experiments with heterogeneous effects across levels of political engagement may not generalize (Egami and Hartman 2022), making it important to test key results for heterogeneity on political engagement. Employing alternative survey modes such as mail or in-person surveys can be key supplements for hard-to-reach populations, too (Hopkins et al. 2024; Yan et al. 2018) (Supplemental material).
Supplemental Material
Supplemental Material - On the Internet, No One Knows You’re an Activist: Patterns of Participation and Response in an Online, Opt-in Survey Panel
Supplemental Material for On the Internet, No One Knows You’re an Activist: Patterns of Participation and Response in an Online, Opt-in Survey Panel by Daniel J. Hopkins and Tori Gorton in Political Research Quarterly.
Footnotes
Acknowledgments
This research was reviewed by the University of Pennsylvania IRB (834884 and 834094). The authors express deep thanks to partners who made this possible: Drew Linzer and Rachel Sinderbrand of Civiqs. David Azizi, Camilla Alarcon, Will Halm, Oliver Kleinman, Sophia Leung, Matthew Rabinowitz, and Gall Sigler provided stellar research assistance, and Nejla Asimovic, Matt Graham, Greg Huber, Josh Kalla, Silvia Kim, Matt Levendusky, Efrén Pérez, Nicholas Sambanis, and Chris Warshaw provided astute comments.
Declaration of Conflicting Interests
The author(s) declared no potential conflicts of interest with respect to the research, authorship, and/or publication of this article.
Funding
The author(s) received no financial support for the research, authorship, and/or publication of this article.
Supplemental Material
Supplemental material for this article is available online.
Notes
Appendix
Sample Civiqs advertisement placed on Facebook to recruit survey respondents for this study. Sample Civiqs advertisements placed on Facebook to recruit survey respondents for this study. Advertisement placed on Facebook to recruit survey respondents. Comparing PA Census Demographics, Election Results, and Campaign Donations to the U.S. Sources: U.S. Census Bureau (2021a, 2021b), Wasserman et al. (2024), Federal Election Commission (2018, 2020). aUsing public contribution-level data obtained from the Federal Election Commission (FEC) on individual contributions to federal election campaigns, we were able to identify the number of unique individuals in Pennsylvania, and the United States more broadly, who had donated at least $200 total within the election cycle, between January 2018 and March 2020. Comparing Validated Sample to June 2020 Respondents, Full Panel. June 2020 Chosen as Final Unrestricted Survey Sample. Full Panel Includes all Respondents Who Participated in at Least One Statewide Survey. Comparing PA Panel Estimates for 2022 Pennsylvanian Primaries Against Actual Results. This Table Reports two-Sided t-tests Evaluating Respondents Randomly Assigned to be Surveyed Before or After the GOP Won the Virginia Governor’s Race on November 2nd, 2021.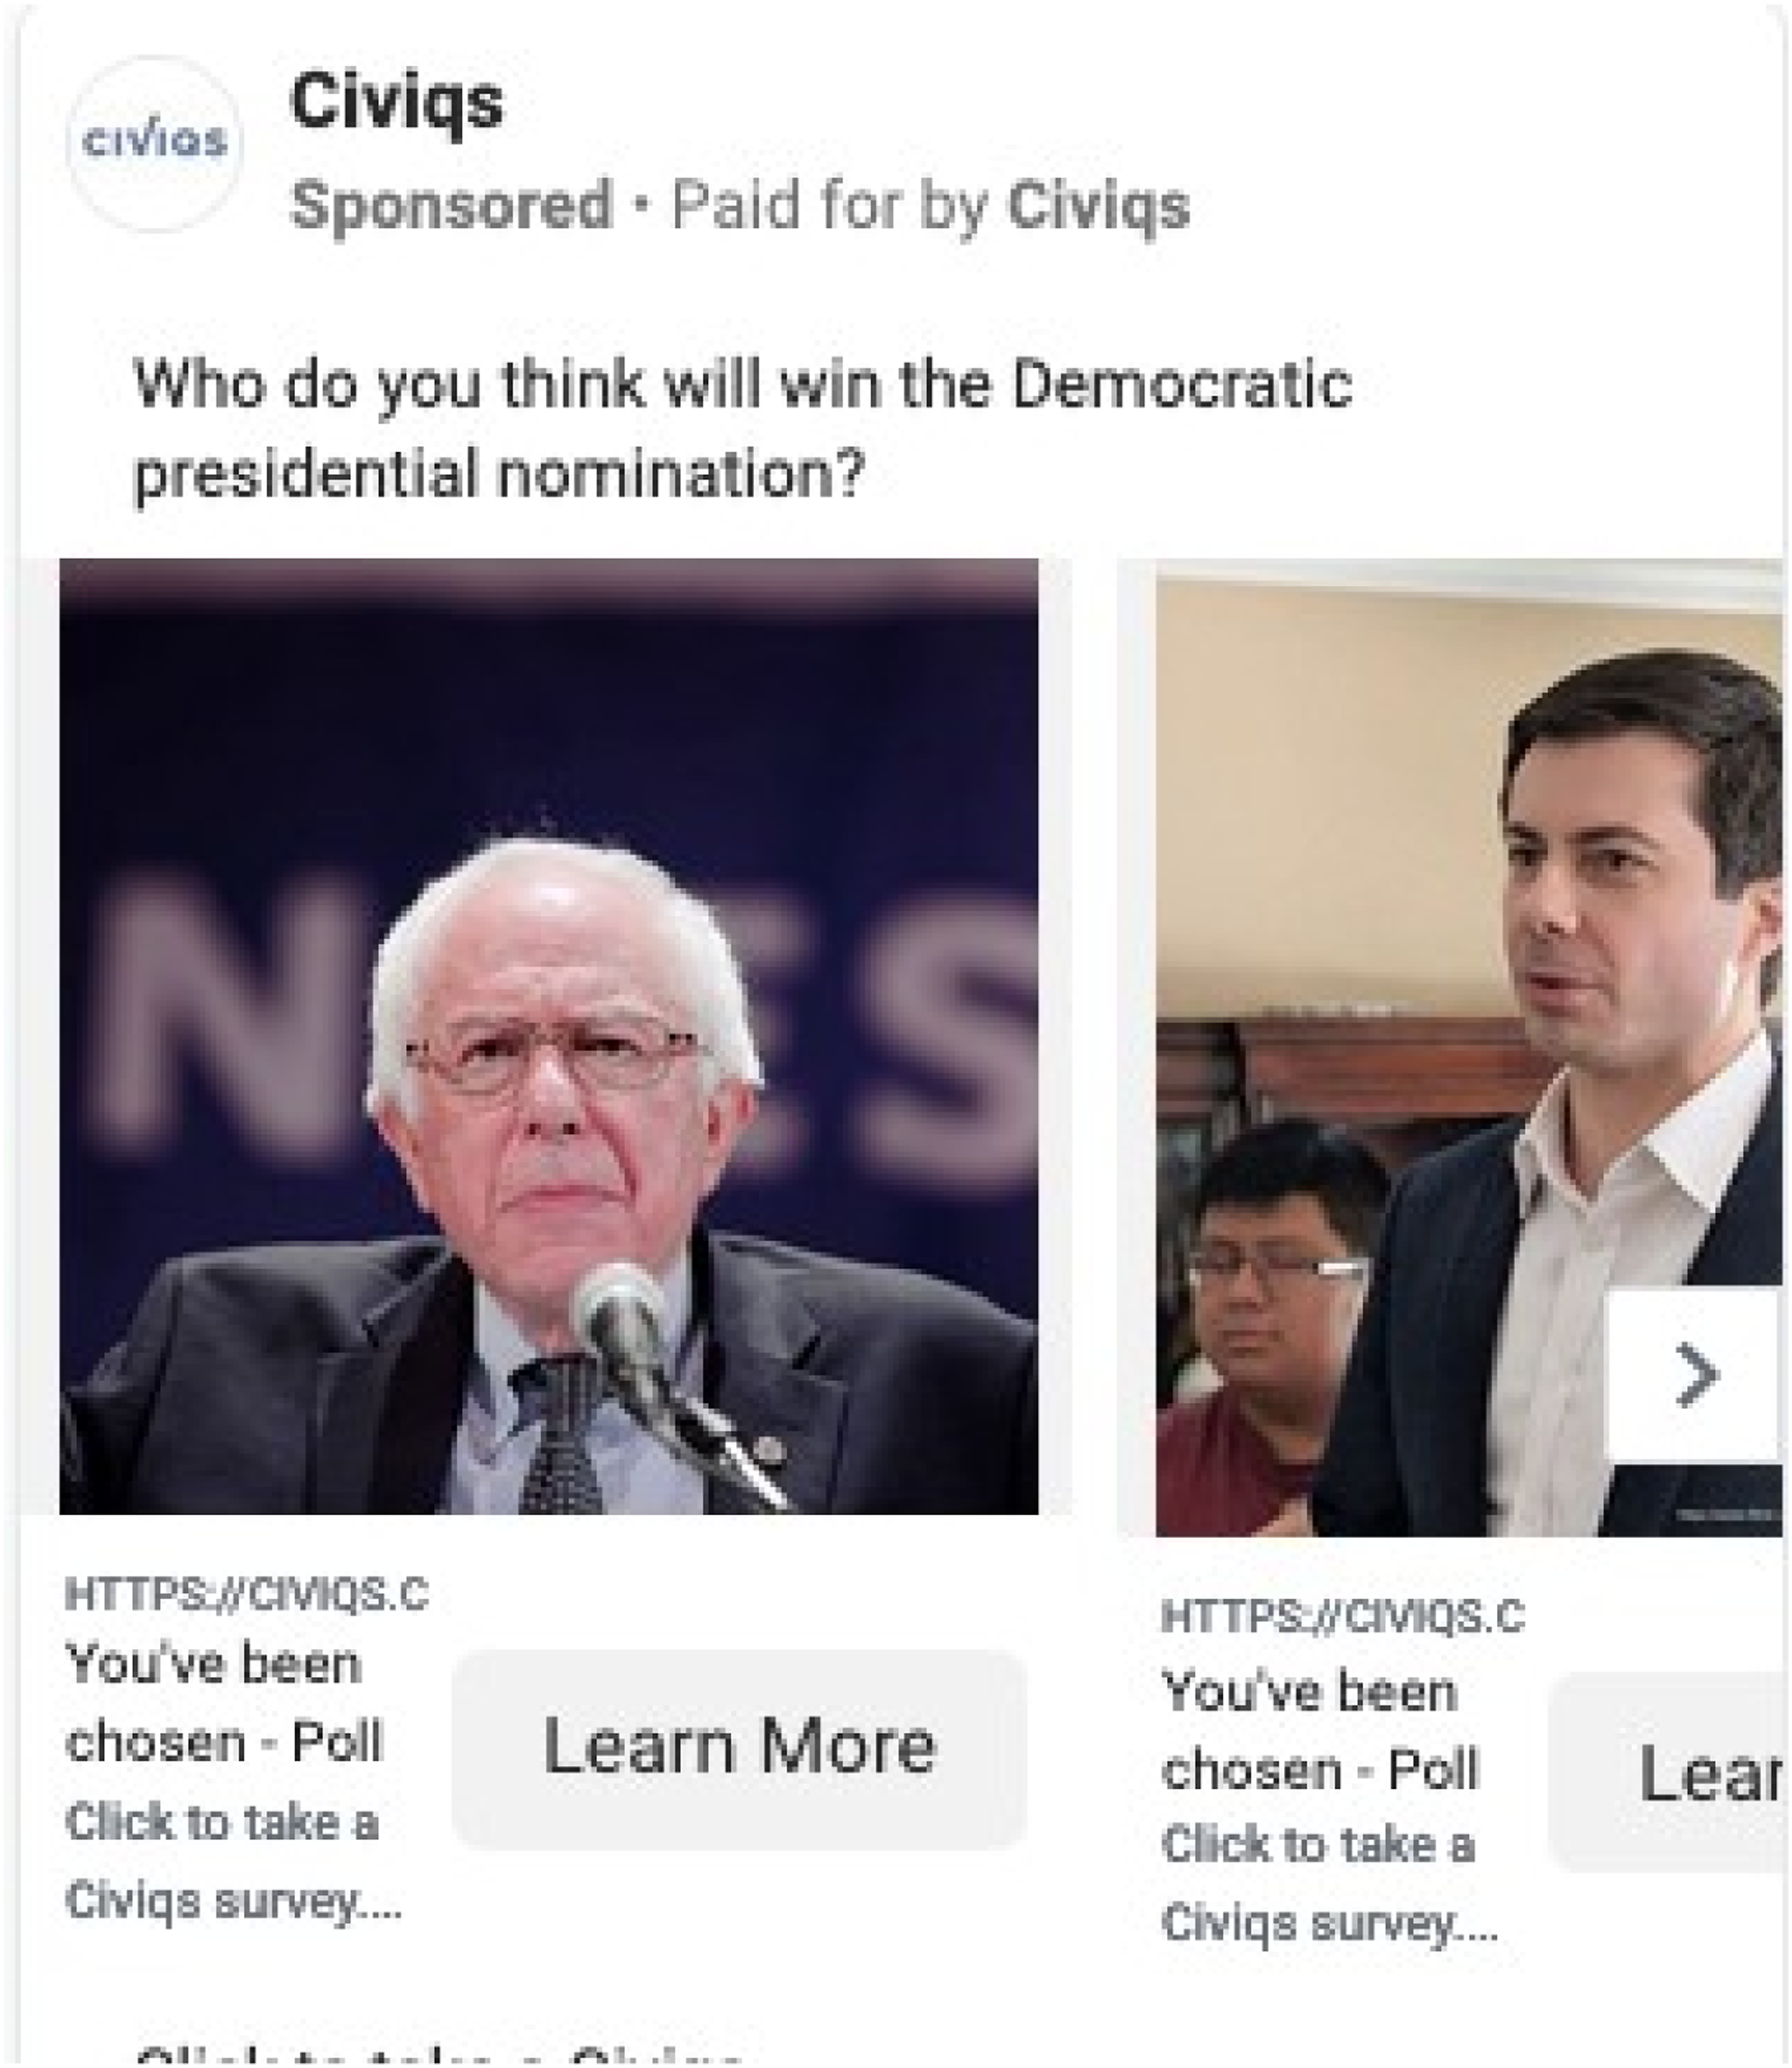
Demographic
PA Estimate
U.S. Estimate
Percent non-Hispanic white
75.7
60.1
Percent Black
12.0
13.4
Percent Hispanic
7.8
18.5
Percent Asian American
3.8
5.9
Percent American Indian
0.4
1.3
Percent in poverty
10.9
11.4
Percent of over 25s with a college degree
32.3
32.9
Median household income
$63,627
$64,994
Percent voted for Biden in 2020
50.0
51.3
Percent voted for Trump in 2020
48.8
46.9
Percent donated more than $200 to a federal
0.47
0.49
election campaign between 2018 and 2020
a
Validated Sample
June ’20 Sample
Full PA Panel
Proportion female
0.47
0.45
0.48
Mean age
52.11
55.90
54.17
Mean years of education
15.02
15.34
15.11
Mean income
73.19
86.02
81.14
Proportion Democrat
0.32
0.37
0.39
Proportion Republican
0.46
0.40
0.37
N
610
1221
4521
Primary Race
Candidate
PA Panel Est.
Result
Democratic Senate
John Fetterman
57.9
58.7
Conor Lamb
17.2
26.3
Malcolm Kenyatta
12.1
10.8
Someone else
4.3
4.2
Unsure
8.4
Republican Senate
Kathy Barnette
29.6
24.7
Mehmet Oz
21.2
31.2
David McCormick
17.8
31.1
Carla Sands
6.2
5.4
Jeff Bartos
4.3
4.9
Sean Gale
1.8
1.5
Someone else
5.2
1.2
Unsure
13.9
Republican Governor
Doug Mastriano
39.5
43.9
Lou Barletta
19.3
20.3
Bill McSwain
11.8
15.8
Dave White
7.6
9.6
Charlie Gerow
1.7
1.3
Joe Gale
2.2
2.1
Melissa Hart
1.2
4.0
Jake Corman
1.0
1.9
Nche Zama
0.7
1.2
Unsure
15.0
Mean
Mean
P-
Total
Before
After
Value
N
Democrat
0.420
0.417
0.831
3,230
Republican
0.372
0.371
0.971
3,230
Trump (1) vs. Biden (−1)
−0.035
−0.028
0.857
3,230
Age
54.913
54.854
0.917
3,230
Black
0.069
0.069
1.000
3,230
Hispanic/Latino
0.020
0.021
0.902
3,230
White
0.896
0.891
0.648
3,230
Female
0.483
0.474
0.623
3,228
Education (years)
15.191
15.083
0.180
3,211
References
Supplementary Material
Please find the following supplemental material available below.
For Open Access articles published under a Creative Commons License, all supplemental material carries the same license as the article it is associated with.
For non-Open Access articles published, all supplemental material carries a non-exclusive license, and permission requests for re-use of supplemental material or any part of supplemental material shall be sent directly to the copyright owner as specified in the copyright notice associated with the article.