
Abstract
Why do citizens vary in their perceptions about the frequency of corruption? We hypothesize that those most harmed by corruption—the socioeconomically disadvantaged—should perceive corruption to be more frequent. Using multiple cross-national surveys, we find that the poor and the uneducated tend to perceive higher levels of corruption than the wealthy and the well educated. However, this relationship only holds in countries at high levels of economic development. In poorer countries, the statistical relationship is much weaker and sometimes runs in the opposite direction.
What explains why people in the same society perceive varying levels of corruption? Individuals often perceive the same phenomenon differently, whether it is the health of the economy (Duch et al., 2000) or the number of war casualties (Berinsky, 2007). Perceptions of corruption should be no different, particularly since corruption is an illicit phenomenon that is typically concealed and therefore difficult to measure. Most explanations privilege attitudes and predispositions, such as partisanship (Anduiza et al., 2013; Davis et al., 2004), support for the incumbent government (Tverdova, 2011), levels of trust (Cover, 2007; Uslaner, 2008), and ideological leanings (Razafindrakoto and Roubaud, 2010). In this article, we focus on socioeconomic status, a variable directly related to corruption’s ill effects. We hypothesize that those who are most harmed by corruption, the socioeconomically disadvantaged, will tend to perceive higher levels of corruption. Using surveys from dozens of countries and multiple data sources, we find robust evidence in support of this hypothesis, but only in advanced countries. In lower- and middle-income countries, the negative relationship between socioeconomic status and corruption perceptions is weaker and less consistent.
Understanding how socioeconomic status relates to corruption perceptions is important for two reasons. First, absent high-quality cross-national indicators of corruption, scholars frequently use perception-based measures as proxies for actual corruption. Knowing how and why corruption perceptions systematically vary across individuals is essential for understanding potential biases in these perception-based measures. Second, identifying who in a society perceives more or less corruption matters because perceptions motivate behavior, irrespective of their accuracy (Gerber and Huber, 2009). Beliefs that corruption is widespread diminish trust in government and other members of society (Chang and Chu, 2006; Rothstein and Eek, 2009), discourage political participation (Cover, 2007), and influence vote choice (Slomczynski and Shabad, 2012). Thus, knowing which socioeconomic groups are likely to perceive more corruption can shed light on patterns of mass political behavior and explain why a phenomenon like corruption might affect various segments of the population differently.
The unequal effects of corruption
Most commonly defined as the “the misuse of public office for private gain” (Treisman, 2000: 399), corruption comprises a variety of behaviors, including when politicians and bureaucrats steal money and resources from public coffers, demand remuneration from citizens in return for special favors, or make the provision of government goods and services conditional on the receipt of bribes or votes. Scholars further distinguish between grand corruption and petty corruption (Bussell, 2012; Uslaner, 2008). Whereas petty corruption occurs in the course of citizens’ everyday transactions with the state, grand corruption typically involves large sums of money and the participation of high-level bureaucrats, politicians, and businesspeople.
Previous research has argued that corruption disproportionately harms the socioeconomically disadvantaged, as it exacerbates existing inequalities (Gupta et al., 2002; Johnston, 1989; Mauro, 1995; Tanzi, 1998; Uslaner, 2008). At an aggregate level, corruption causes higher levels of income inequality and poverty (Gupta et al., 2002), which are likely to exert the greatest toll on those who are already poor. More specifically, petty corruption harms the socioeconomically disadvantaged because the poor are less able to pay bribes that are required to access public services. Furthermore, petty corruption harms citizens with little education because they are less knowledgeable about how the bureaucracy works and potential recourse should they find themselves asked for bribes, thus making them easy targets for corrupt officials. Grand corruption also harms the poor disproportionately. When corrupt officials steal public funds or the wealthy pay bribes to avoid paying taxes, the state has fewer resources to spend on programs that benefit the poor, such as primary education and welfare services. Bribes to legislators can produce public policy that disproportionately benefits the privileged, such as through a regressive taxation system. Finally, grand corruption can exact a non-material harm on the socioeconomically disadvantaged by corroborating beliefs that the political system is stacked against them, thereby diminishing their feelings of trust in the political system and their perceptions of the system’s efficacy.
Given the disproportionate harm that the socioeconomically disadvantaged suffer from corruption, we hypothesize that they should perceive higher levels of corruption. In particular, the poor and the uneducated should perceive higher levels of corruption than the wealthy and the well educated. This is not to say that the disadvantaged necessarily experience corruption more often (though they might), but rather that they are disproportionately harmed by corruption.
At least three mechanisms explain why disproportionate harm should translate into higher levels of perceived corruption among the socioeconomically disadvantaged. The first involves the resolution of cognitive dissonance (Festinger, 1957). If corruption does someone great harm and she consequently cares deeply about it, she may overestimate the frequency of corruption in order to justify her preoccupation with it. The second mechanism involves the selective consumption of information on corruption. Just as people selectively expose themselves to information that reinforces existing political attitudes (Stroud, 2008), they may pay greater attention to information that confirms their beliefs about the gravity of corruption. Knowing that corruption harms them disproportionately, the disadvantaged may pay more attention to information about corruption and therefore recall more instances of it than more socioeconomically advantaged citizens. Finally, the third mechanism involves distinct conceptions of corruption. Citizens of lower socioeconomic status often take a more expansive view of corruption that encompasses a broad range of unethical, but often legal, behaviors in which certain people benefit from favoritism (Johnston, 1986; Redlawsk and McCann, 2005). What the privileged see as normal politics, the disadvantaged may see as corrupt. If those who do not benefit from favoritism treat a wider range of behaviors as corrupt, then they should perceive higher levels of corruption than those who define corruption more narrowly. If, for these reasons, the disadvantaged indeed perceive higher levels of corruption, then an individual’s income and education should be negatively associated with her beliefs about corruption’s pervasiveness.
So far, relatively little empirical research has focused on the relationship between socioeconomic status and perceptions of corruption. Studies that include income and education as predictors of corruption perceptions (often as controls) usually examine one or a handful of countries and have arrived at mixed findings. 1 Some have found that the wealthy (Davis et al., 2004) and educated (Olken, 2009) perceive more corruption, while others find no relationship (Cover, 2007) or that the wealthy and educated perceive less corruption (Redlawsk and McCann, 2005; Tverdova, 2011). By simultaneously analyzing surveys from dozens of countries and multiple data sources, we aim to uncover broader patterns in the association between socioeconomic status and corruption perceptions.
Data
To examine whether socioeconomically disadvantaged citizens tend to perceive higher levels of corruption, we use cross-country surveys that ask citizens how they evaluate corruption’s frequency in their countries. Specifically, we use Module 2 of the Comparative Study of Electoral Systems (CSES), Wave 3 of the World Values Survey (WVS), and the 2006 version of the International Social Survey Programme (ISSP). 2 Working with multiple surveys ensures that our findings do not result from idiosyncrasies inherent in any single survey. In each of these surveys, we use the level of perceived corruption as the outcome variable and income and education, as measures of socioeconomic status, as the predictors.
For the outcome variables, we use the original scales for the 4-point corruption perception variables in CSES and WVS and take an average of the two 5-point corruption perception variables in ISSP, one about politicians and the other about public officials. For the predictors, we use the original scales for income and education in CSES and WVS. In CSES, the income variable is based on a 5-point scale, whereas the education variable is based on an 8-point scale. In WVS, the income variable is based on a 10-point scale, whereas the education variable is based on an 8-point scale. In ISSP, we use the 6-point education variable, but transform the income variable by recoding the national currency units into US dollars and taking the log. The major challenge in using multiple surveys is comparability, since the surveys vary in how they measure corruption perceptions, income, and education. In analysis available in the online appendix, we show that the results below do not substantively change when we standardize both the predictors and the outcome variables.
Analysis
No-pooling regression
Given that richer countries tend to have lower average levels of perceived corruption than poorer countries (Treisman, 2000), 3 we cannot pool data from multiple countries and regress each respondent’s level of perceived corruption on her income and education. We may wrongly infer that educated citizens are more likely to perceive lower levels of corruption, even if no such relationship exists within most countries, because education levels are likely to be higher and the mean level of perceived corruption lower in rich countries. Moreover, since previous studies have found differing relationships between income, education, and corruption perceptions in different national contexts, we cannot simply assume that the size and magnitude of the relationship between socioeconomic status and corruption perceptions are identical across countries.
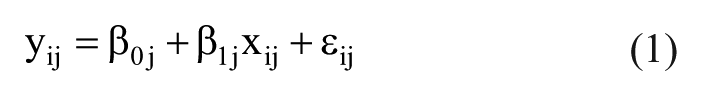
We therefore allow each country to have its own regression coefficient, running separate regressions for each country without pooling the data. In other words, we treat the data for each country j as a separate dataset, and fit the following regression model.
In this equation,
To illustrate our approach, we take the CSES dataset and regress corruption perceptions on household income in each country. Figure 1 presents the results. The black circles show the estimated coefficients, and the bars show the 95% confidence intervals. In countries with estimates on the left half of the figure, poorer citizens perceive higher levels of corruption, whereas in the countries on the right half of the figure, richer citizens perceive corruption to be more widespread. The gray circles in the figure represent estimates controlling for education, gender, and age. In a preliminary analysis we also added urban residence and unemployment but the estimates did not noticeably change. Since these variables were not available for many countries, we do not include them in the analysis presented here. In analysis presented in the online appendix, we also show that controlling for the ethnicity of the respondent does not alter the results.

Income and corruption perception (CSES).
The figure reveals considerable variation across countries. In the most extreme case, the coefficient for the United States is −0.11. This indicates that the level of corruption perceptions for citizens in the richest quintile is likely to be 0.4 points lower on a 4-point scale than for citizens in the poorest quintile. This difference represents about half of a standard deviation in the corruption perception variable (0.78). Concretely, more than three-quarters of American respondents from the poorest quintile considered corruption to be either “Quite widespread” or “Very widespread,” while a majority of respondents from the richest quintile perceived corruption to be “Not very widespread” or that “It doesn’t happen at all”. 4 This rather striking disparity in how the two income groups perceive corruption in the United States indicates that our findings uncover substantively important variation. A somewhat surprising result is that the addition of control variables for education, gender, and age—none of which should introduce post-treatment bias—does not drastically change the results. Despite the correlation between the predictor and the control variables, the estimates are roughly the same except for Finland and Portugal.
When we repeat a similar analysis for WVS and ISSP, the results are remarkably similar to those in Figure 1. Using education instead of income as a predictor also shows a similar pattern. On the whole, we find that in most countries, the disadvantaged—those who are poorer and less well educated—perceive higher levels of corruption than fellow citizens who are wealthier and better educated. However, as evident in Figure 1, there is considerable variation across countries, with some coefficients in the data close to zero or even somewhat positive.
Exploring cross-national variation
Having analyzed respondents from each country separately, we find partial support for our hypothesis that the socioeconomically disadvantaged perceive higher levels of corruption. However, like the existing literature, the findings are somewhat mixed, revealing a number of countries where this relationship does not hold. To gain a better handle on where we do and do not find support for our hypothesis, we investigate whether the regression coefficients in our previous analysis vary systematically across countries.
Although existing studies provide relatively little guidance as to why the relationship between socioeconomic status and corruption perceptions should vary cross-nationally, one exception is Uslaner’s (2008) claim about the tight connection between corruption and inequality. Based on his argument, we should expect that the negative association between socioeconomic status and corruption perceptions is particularly strong in highly unequal societies. However, as we show in the online appendix, we do not find evidence that fits this prediction. The association between socioeconomic status and corruption perceptions does not vary based on income inequality.
Economic development is another variable that may explain variation in the relationship between socioeconomic status and corruption perceptions. Countries at varying levels of economic development experience not only different levels, but also different forms, of corruption (Johnston, 2005; Treisman, 2000; Uslaner, 2008). Wealthier countries experience less overall corruption and relatively little petty corruption, while poorer countries experience more overall corruption, including both grand and petty corruption. This variation in the corruption environment might influence the relationship between socioeconomic disadvantage and corruption perceptions. Specifically, in wealthier countries where grand corruption is the main form of corruption, corruption’s harm to the poor may be more obvious. After all, the beneficiaries of grand corruption are invariably those of high socioeconomic status. By contrast, the widespread nature of petty corruption in poor countries—in which both rich and poor are often implicated—could make the wealthy as sensitive to corruption as the poor, reducing the statistical relationship between socioeconomic status and corruption perceptions.
To examine this possibility, we compare the regression coefficients obtained from regressing corruption perceptions on income and education across countries at different levels of economic development. For the level of economic development, we use the per capita gross domestic product (GDP)—measured as the purchasing power parity (PPP) converted value in US dollars—for each country in the year the survey was conducted based on data from Penn World Tables 7.0. The results are shown in Figure 2. Per capita GDP is plotted on the x-axis, and the regression coefficients on the y-axis. For each of the datasets, we show the results using income as the predictor in the left panel and education in the right panel. The black circles show the regression coefficient in each country, and the bars show the 95% confidence intervals. To indicate the general pattern in the data, we fit a LOWESS line on the estimated coefficients predicted by the level of per capita GDP.

Regression coefficients and the level of per capita GDP.
In Figure 2, a clear pattern emerges. In all of the subgraphs in this figure, most of the coefficients are negative (indicating that the poor and uneducated perceive higher levels of corruption), but these coefficients become much closer to zero and some even become positive in poorer countries. In all of the surveys, the LOWESS line shows a negative slope that intersects the x-axis at low levels of per capita GDP. Whereas in advanced countries, high-income, highly educated citizens tend to perceive lower levels of corruption compared with other citizens, in developing countries, the relationship is much weaker. The pattern for each survey is roughly the same if we include the other predictors as controls. 5
Multilevel models
We repeat the previous analysis with multilevel models to address the concern that differences in the coefficients across levels of economic development may be small enough to have been generated by chance (Gelman and Hill, 2007; Steenbergen and Jones, 2002). We use the corruption perceptions variables and the socioeconomic status variables in their original scales and fit a multilevel linear model allowing the intercepts and the slope parameters to vary by country. In the context of equation (1), the individual-level parameters

Marginal effects from multilevel models.
Figure 3 is comparable to Figure 2 except that the graphs are based on multilevel models. The regression line shows the predicted marginal effect of income or education on corruption perceptions by a country’s level of per capita GDP, and the scatterplot shows the predicted regression coefficient of income (left column) or education (right column) on corruption perception for each country when the country-level errors are added to the predicted marginal effects. The vertical bars show the 95% confidence intervals. Comparing Figures 2 and 3, the two estimates show a roughly similar pattern.
Discussion
We began with the intuition that those most harmed by corruption should perceive more of it. Using dozens of surveys from countries around the world, we found that this intuition is correct—but only in affluent countries. In poorer countries, the relationship between income and corruption perceptions is much murkier. These findings are remarkably similar across different sources of data, and they are highly robust. An alternative explanation for our findings is that lower-income citizens actually observe more corruption. Given that petty corruption involving the average citizen tends to be lower in affluent countries (Uslaner, 2008)—where our results are strongest—it seems unlikely that the poor consistently observe more corruption than the rich. However, the data analysis cannot ultimately distinguish between these two explanations, and we cannot therefore rule out the possibility that lower-income citizens’ perceptions of greater corruption simply reflect their greater exposure to it.
Nevertheless, our consistent empirical findings have two important implications. First, studies that employ corruption perceptions as a proxy for actual corruption should bear in mind that perceptions of corruption will vary based on who is being asked. Importantly, relying on expert opinions implies different biases in different countries, since the affluent and educated will systematically perceive less corruption than the poor and poorly educated mainly in wealthy countries and less so elsewhere. Second, this article contributes to a growing literature about heterogeneity in individuals’ perceptions of the world around them. Whereas previous work has focused largely on the impact of attitudes and beliefs on corruption perceptions, we draw attention to socioeconomic status as a key shaper of an individual’s perceptions.
Finally, this article raises interesting questions for future research. Most notably, why do the disadvantaged in poorer countries not perceive more corruption than their comparatively advantaged compatriots? We speculated that developing and middle-income countries differ from high-income countries in their corruption environment because of high overall levels of corruption and the prevailing forms of corruption. However, an alternative possibility is that corruption is mobilized as a political issue differently across countries. Perhaps in poorer countries, low-income citizens tend to be concerned with other issues, such that corruption is a largely middle-class preoccupation. This question of why precisely the relationship between socioeconomic status and corruption perceptions varies across levels of economic development is therefore ripe for future research.
Footnotes
Declaration of conflicting interest
The authors declare that there is no conflict of interest.
Funding
This research received no specific grant from any funding agency in the public, commercial, or not-for-profit sectors.
Supplementary material
The online appendix is available at http://thedata.harvard.edu/dvn/faces/StudyListingPage.xhtml?vdcId=2137&studyListingIndex=1_1bcf21f234b451a909343757f9fa