
Abstract
Scientific work on national election forecasting has become most developed for the United States case, where three dominant approaches can be identified: Structuralists, Aggregators, and Synthesizers. For European cases, election forecasting models remain almost exclusively Structuralist. Here we join together structural modeling and aggregate polling results, to form a hybrid, which we label a Synthetic Model. This model contains a political economy core, to which poll numbers are added (to tap omitted variables). We apply this model to a sample of three Western European countries: Germany, Ireland, and the United Kingdom. This combinatory strategy appears to offer clear forecasting gains, in terms of lead and accuracy.
The world of scientific election forecasting has expanded considerably over the last few years. 1 Dominant approaches to scientific forecasting elections privilege the role of theory and lead time in predicting outcomes. Next to that approach, there is also a stream of atheoretical efforts to predicting election outcomes, which mainly focus on reducing the error of forecasts. This article adopts an innovative synthetic approach to predict the outcome of elections in Europe by combining structural predictions with information from polls. We find that polls do not add much to the predictive value of sound structural models of vote choice, but that approaches which balance theory, data, and time considerations forecast elections best.
We adopt the categorization of dominant scientific approaches that emerged in the pivotal 2012 US presidential election, sorting forecasters according to three 2 labels: Structuralists, Aggregators, and Synthesizers (Lewis-Beck and Stegmaier, 2014a). These approaches can be differentiated by their application of theory, data, and time. The Structuralists (Abramowitz, 2012; Campbell, 2012b; Holbrook, 2012; Lewis-Beck and Tien, 2012) offer a theoretical model of the election outcome. They usually begin with a core political economy explanation, such as vote = f (presidential popularity, economic growth). The unit of analysis tends to be the nation and the estimation is ordinary least squares (OLS) on single equations. Furthermore, this estimation is static, rather than dynamic, resulting in a unique final forecast.
In contrast, the Aggregators (Blumenthal, 2014; Traugott, 2014; Jackman, 2014), aggregate vote intentions in opinion polls. A well-known example comes from Real Clear Politics, with its voter preferences (percentages) combined over a number of multiple polls. Unlike the Structuralists, the Aggregators offer no theory of the vote, but the unit of analysis is still usually the nation. Further, unlike the Structuralists, forecasting by Aggregators is dynamic, with repeated estimates across the campaign.
Taking a different approach, the Synthesizers (e.g. Erikson and Wlezien, 2014; Linzer, 2013; Silver, 2012) borrow from both the Structuralists and the Aggregators. They start with a political economy theory of the vote, and employ aggregated and ongoing polling preferences as well. They analyze data either at the national level or the state level. The analysis may include multiple equations and may be Bayesian. Forecasts are updated, with repeated estimates across the campaign. In sum, these models join election theory with the strengths of aggregation and dynamic updating. Synthetic modeling will be the focus of our European analyses here. In terms of general approach, the Synthetic Model operates much like contemporary weather forecasting models. The fundamental variables governing the atmosphere (the electorate) first generate an event forecast, say a rain storm (an election). That forecast is subsequently checked against additional, incoming information, as the storm pattern (or vote intentions) is tracked. Thus, the initial forecast is updated, and modified regularly by ever more current forecasts. The process then becomes dynamic (on this weather analogy, see Lewis-Beck and Stegmaier, 2014b).
Election forecasting in Europe: the state-of-the-art
What is the state-of-the-art with respect to election forecasting in Europe? Structuralists dominate, as is clear from the work of Whiteley (2005) on the UK, Nadeau et al. (2010) on France, Norpoth and Gschwend (2010) on Germany, Dassonneville and Hooghe (2012) on Belgium and Magalhães et al. (2012) on Spain. These models tend to be based on a political economic theory of voting. The modeling is single-country, single-equation OLS work. Estimation remains static, with one unique forecast issued. The unit of analysis is usually, but not always, the nation. Dubois and Fauvelle-Aymar (2004: 216) provide a typical French example, with the unit of analysis being the region, rather than nation:

where V = legislative vote share of parties on the left, first-round; P = popularity of parties on the left, SOFRES polls, three months prior to the election; E = regional unemployment rate, from the quarter before the election. (Note that the model fits the French data about as well as it fits US data of the same sort.)
What about Aggregators? This approach, where polls are combined and systematically used to forecast, is almost non-existent in Europe. 3 However, using individual polls on vote intention to forecast represents a long-standing tradition, especially within the media. In the UK in particular, there has been plentiful work in the aggregator tradition since the 1970s. 4
What about Synthesizers? We know of no examples of Synthetic Models for a general national election in Europe. This piece is the first attempt to build such a Synthetic Model.
Building synthetic models to forecast European national elections
Our aim is to combine a sound Structural Model with a sound Aggregate Polling Model, so forming a hybrid—a Synthetic Model—which can forecast national election outcomes (incumbent vote share Vt) accurately across a sample of European democracies. Given that this is a first effort at developing Synthetic Models for European countries, we do not wish to be exhaustive in the cases covered. Instead, we focus on a limited number of established democracies, with sufficient variation in electoral and party systems. In addition, in order to develop stable and robust forecasting models, we aim to maximize the number of cases on which these national estimations are based. This implies we seek out countries with extended time series data on at least 10 general elections with sound coverage of macro-economic and government support indicators, as well as sufficient polling data on voting intentions. The United Kingdom, Germany, and Ireland all met these stringent data requirements and were accordingly selected for this founding examination.
We aim to use a structural forecasting model that will be applicable across a number of European countries, even given all their multi-party variety. Therefore, the decision on the forecasting target is of utmost importance. Previous research developing election forecasting models for different European nations indicates that accountability-mechanisms are context specific. Lewis-Beck and Paldam (2000: 119) have argued that “in a multi-party system, the economic voter may target a whole coalition, a party within the coalition, or even assign a particular economic policy to a particular party.” Given that we seek a generally applicable model, our preferred forecasting target is the vote of the incumbent government—irrespective of whether this is a single-party government, a minority coalition government or a majority coalition government. Despite potential differences in the extent to which coalition parties are blamed for the economy, a number of studies forecasting multi-party elections demonstrate an overall link between economic conditions and the vote for the governing parties (Aichholzer and Willmann, 2014; Bellucci, 2010; Dassonneville and Lewis-Beck, 2014; Magalhães and Aguiar-Conraria, 2009; Norpoth and Gschwend, 2003, 2010). We believe it is substantively interesting to forecast the combined vote of the incumbent coalition in a multi-party context, rather than individual parties’ vote shares. Our work echoes Norpoth and Gschwend (2003: 17), who have referred to a simple rule from their German work: “a governing coalition whose parties obtain a majority of seats in an election continues in office, while a coalition that fails in that objective is replaced by another one.”
The proposed Structural Model, with its political economy core, reads Vt = f(Economy, Government Support). Operationally, it might read Vt = f(GDPt-x, Government Popularityt-x). The proposed Aggregate Polling Model predicts the incumbent vote share as a function of (aggregated) vote intention, Vt = f(Vote Intentiont-x). Operationally, it might read Vt = f(Median Vote Intentiont-x). 5
The Synthetic Model begins with the long-term fixed effects from electoral theory, as captured in the Structural Model. Then, it adds to that the short-term effects induced by other forces, as represented by the Polling Model (with its use here of Median Vote Intention, VIt-x.) The addition of this variable can be justified on several grounds. First, it represents “omitted variables” in the theoretical specification of the vote function. This justification seems highly plausible, given the parsimony of the structural specification itself. Also, its inclusion can be regarded as a proxy variable for the vote itself. To the extent that these arguments are sound, we should find that VIt-x has a significant coefficient and reduces prediction error, improving the forecast over time.
Thus, the Synthetic Model offers a combination of theory and empirics, in dynamic form, featuring progressive re-estimations as the election becomes closer. With reference to the 2012 US presidential election forecasting work, it is most similar to the superlative efforts of Erikson and Wlezien (2012, 2013). Our estimation is non-Bayesian, and discrete, i.e. the estimates are at monthly intervals, beginning at t-6 down to t-1. 6
Synthetic models: the analysis strategy in practice
We first estimate the Structural Model (at t-6) for each European country. Then, we estimate the Aggregate Polling Model (t-6 to t-1). Finally, we estimate a combined, single-equation Synthetic Model (t-6 to t-1). This dynamic assumes that while the Structural Model is fixed (at t-6), the Aggregate Polling Model moves each month (from t-6 to t-1). This formulation allows a new “nowcast” of the election result with each passing month (Lewis-Beck and Tien, 2013). For our initial tests, we look at three different parliamentary democracies of Western Europe: Germany (1980–2013), Ireland (1977–2011) and the United Kingdom (1959–2010).
We present the same basic structural forecasting model for each of these European democracies, which implies that we are using analogous measures for each of our cases. To this end we rely on one macro-political indicator and one macro-economic indicator. Following a standard approach in the election forecasting literature, the political indicator is a measure of government approval. 7 We have chosen to include this general government approval indicator instead of approval of the prime minister for three main reasons. First, our dependent variable is general, referring to the vote of the coalition as a whole. Second, given our aim of developing a generally applicable model for European democracies, government approval data appears to be a common denominator for single-party governments, coalition governments and minority governments. Third, in countries where politics is extremely personalized, we would expect the PM’s popularity to be reflected in approval ratings of his/her government as well. 8 We build in a lead time in the structural models by including the data for government approval as measured six months before Election Day. As evident from the country-specific plots in Figure 1, there is a positive relationship between governmental approval and incumbent vote share in each of the countries analyzed.

Government approval and incumbent vote share in Germany, Ireland and the United Kingdom.
As a measure of the economy in each of the democracies analyzed, we make use of GDP growth rates (quarterly national accounts, change compared to the same quarter of the previous year). 9 Within research on economic voting, GDP and unemployment are considered to be “the big two” (Lewis-Beck and Stegmaier, 2013: 376). Moreover, Kayser and Wlezien (2011: 376) even refer to GDP growth as “the most general objective measure of economic welfare.” We thus believe it fair to assume GDP growth serves as a good general measure for the state of the economy in the countries under study. As with the political indicator, this economic variable will be measured with a lead time of about 6 months. To this end, we include GDP growth rates from two quarters before the election quarter. The bivariate country-specific plots in Figure 2 illustrate that relationship between GDP growth and incumbency vote share is as expected. The better the economy is doing—and thus the more economic growth there is—the higher the vote share that incumbents obtain on Election Day.

GDP growth rate and incumbent vote share in Germany, Ireland and the United Kingdom.
Having presented our measures, in a next step, we include the political and economic indicators in a model to predict the incumbent vote share for each of these European democracies. 10 The structural models are estimated (OLS) in Table 1 below. We can evaluate their forecasting performance in terms of the following criteria: Accuracy, Lead, Parsimony, Replication and Currency (Lewis-Beck, 2005; Lewis-Beck and Tien, 2013). With respect to accuracy, the R2 ranges from .58 to .87, while the RMSE ranges from 2.7 to 5.5. These numbers suggest, qualitatively, that accuracy is “good” to “very good.” With respect to lead time, it is 6 months before the election, which must be rated “excellent.” The model is quite parsimonious, with only two independent variables, drawn from strong election theory. Replication is easy enough, given the straightforward and available measures used. With respect to currency, which refers to how updated the forecast is, we see that it is static, offered once 6 months out. The model appears to work best for Germany, which yields the highest goodness-of-fit, the lowest prediction error, and the lowest collinearity.
Structural models.Vote = f(Incumbent approval, GDP).

Model estimations for German bundestagelections 1980–2013; Ireland parliamentary elections 1977–2011; UK parliamentary elections, 1959–2010. Significance levels: *p<0.05, **p<0.01, ***p<0.001.
As a second step, we estimate a number of polling models, predicting the incumbent vote share by means of information from the polls. 11 The estimations for these polling models appear in Table 2 below. Let us evaluate them by the same criteria. With respect to accuracy, the R2 ranges from .50 to .90 and the RMSE ranges from 2.40 to 6.00. These numbers suggest, qualitatively, that accuracy ranges from “fair” to “very good.” Lead time now varies from a “long distance,” at 6 months, steadily down to 1 month, a “short distance” from the election. The model is extremely parsimonious, with only one independent variable; however, that variable is predictive rather than explanatory (i.e. it is not based on election theory). Replication is relatively easy, as these polling numbers are generally available. With respect to currency, or the fact that a model is regularly updated and hence provides news value on the “now” (Lewis-Beck and Tien, 2013), we can say the model is dynamic, moving from a lead of 6 months down to 1 month before the election. A 1-month lead time appears to offer the best accuracy, yielding a prediction error of 2.2 to 4.1 depending on the country. We cannot easily point out what model performs best in terms of accuracy, as different indicators would lead to contrasting conclusions. On the one hand, it looks like the synthetic model predicts best in Germany, which is the country with the highest R2 range (.67 to .85). On the other hand, it looks like the model performs best for the United Kingdom, which has the lowest RMSE of 2.36.
Polling models.Germany.

Model estimations for German bundestagelections 1980–2013. Significance levels: *p<0.05, **p<0.01, ***p<0.001.
Ireland.

Model estimations for Ireland parliamentary elections 1977–2011. Significance levels: *p<0.05, **p<0.01, ***p<0.001.
United Kingdom.
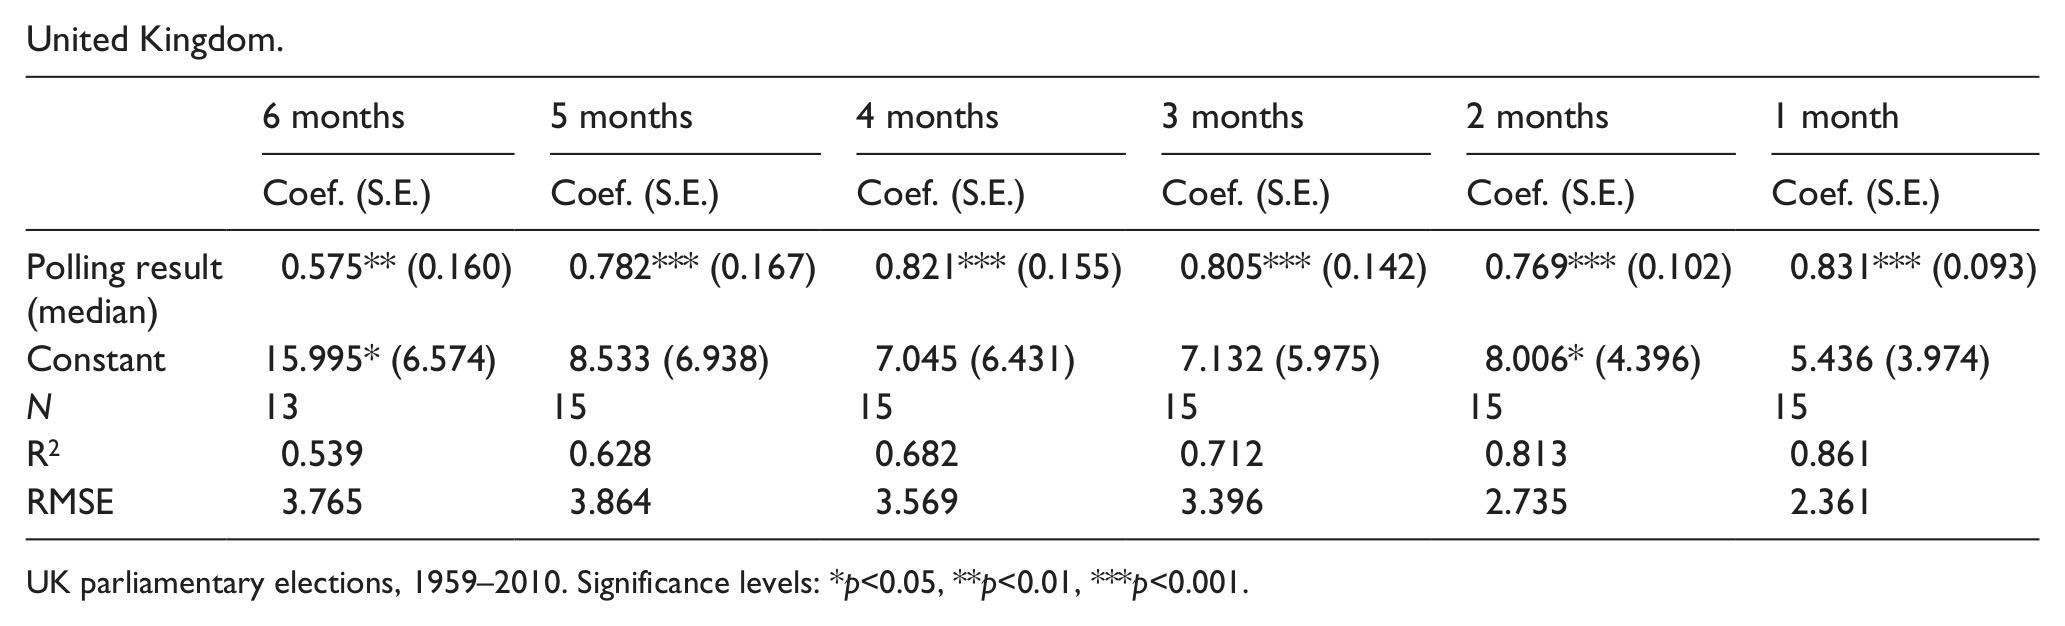
UK parliamentary elections, 1959–2010. Significance levels: *p<0.05, **p<0.01, ***p<0.001.
The estimations for the Synthetic Models appear in Table 3 below. Let us evaluate these models by the same criteria (Accuracy, Lead, Parsimony, Replication and Currency). With respect to accuracy, the R2 ranges from .64 to .98) and the RMSE ranges from 2.3 to 6.5. These numbers suggest, qualitatively, that accuracy ranges from “good” to “excellent.” Lead time varies from a long distance to a short distance, i.e., from 6 months before the election to just 1 month before. The model is relatively parsimonious, with two explanatory variables (based on theory) and one predictor variable (a proxy based on empirics, or omitted variables). The replication of the model, with these simple available measures, poses no challenge. With respect to currency, it is dynamic, from 6 months down to 1 month. The model with a 1-month lead time performs quite well and has a prediction error range of 2.3 to 4.4; this model performs best in the United Kingdom and Germany, but not in Ireland. The 4-month models have a prediction error range of 2.6–2.9. This 4-month lead works about as well as the 1-month lead, and affords a good deal more distance from the election target.
Synthetic models – basic.Germany.
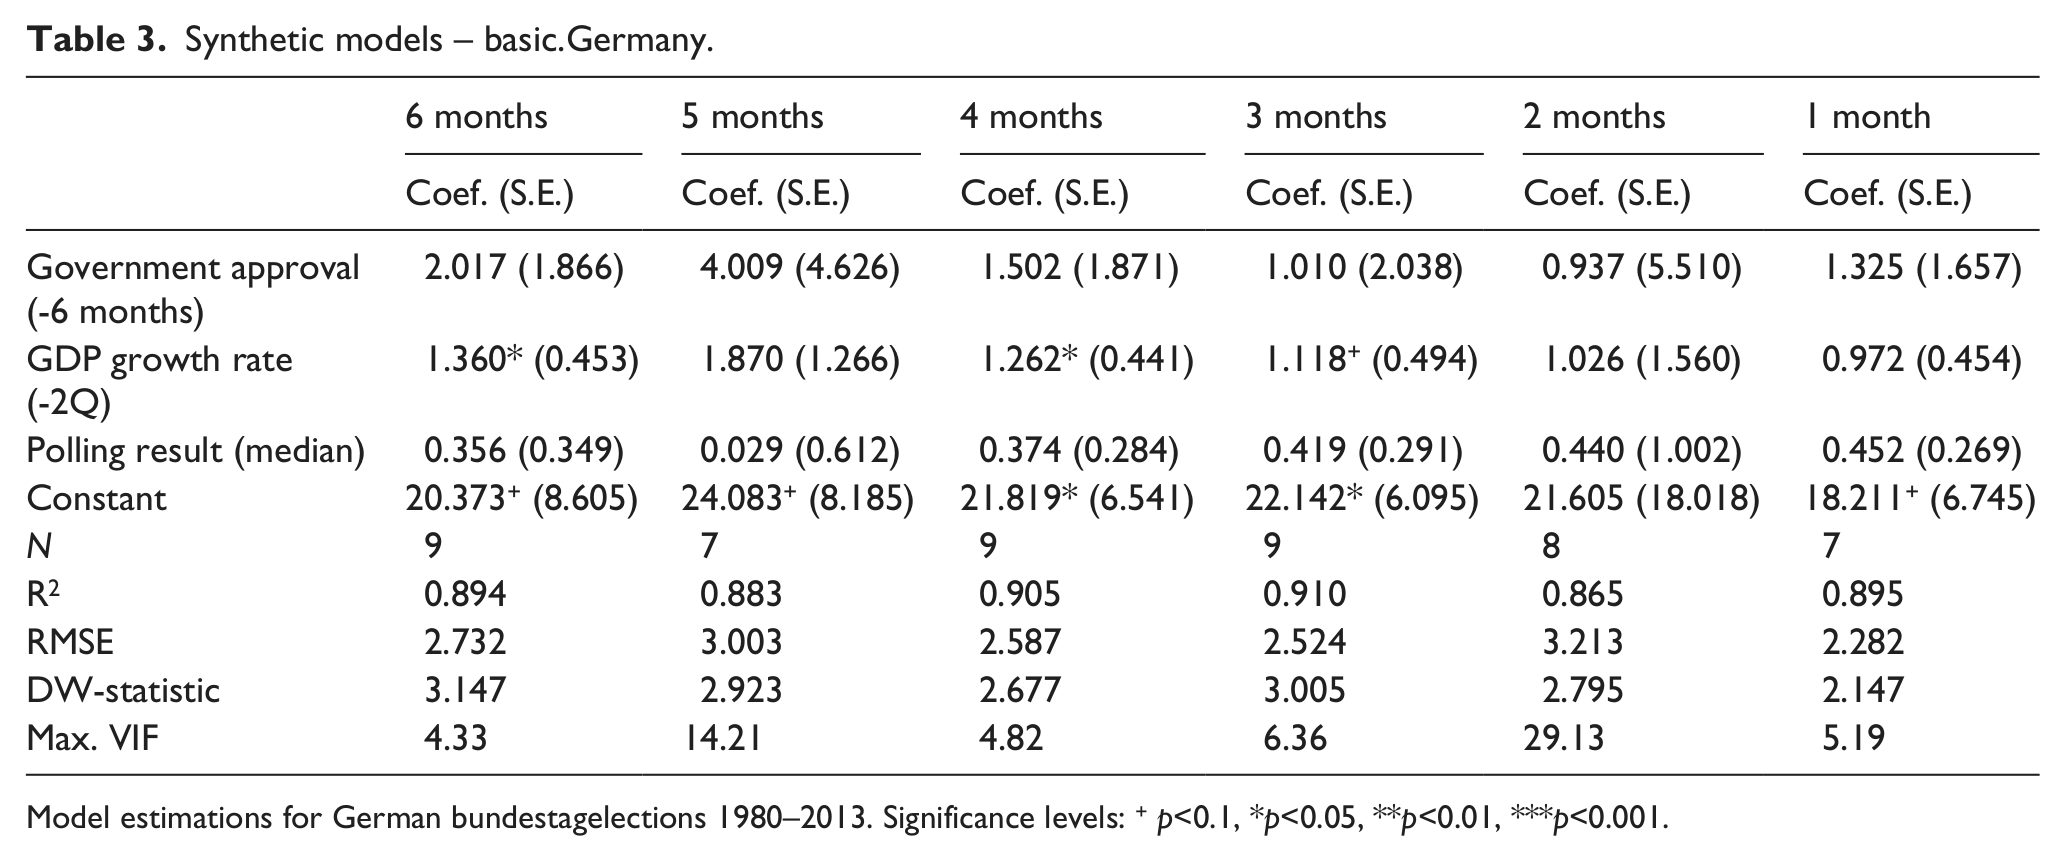
Model estimations for German bundestagelections 1980–2013. Significance levels: + p<0.1, *p<0.05, **p<0.01, ***p<0.001.
Ireland.

Model estimations for Ireland parliamentary elections 1977–2011. Significance levels: +p<0.1, *p<0.05, **p<0.01, ***p<0.001.
The United Kingdom.

Model estimations for UK parliament elections, 1959–2010. Significance levels: +p<0.1, *p<0.05, **p<0.01, ***p<0.001.
When we examine improvement in the model fit statistics, we discover that the incremental increase in model fit largely confines itself to the United Kingdom. There are two potential reasons why we do not observe such a pattern of gradual improvement in Ireland or Germany. First, the polling data on which the estimations are based are richer for the United Kingdom. Especially for the Irish case, the limited number of available polls can render the estimates particularly sensitive to the impact of outliers. 12 Second, the United Kingdom is the country for which the Structural Model performs worst. Consequently, the polling part—which quite logically becomes more accurate as Election Day draws near—is the more important part in the UK models. The improved model fit of the Polling Model thus has a greater observable effect on the combined models for the United Kingdom than it does for the German or Irish cases.
Performing multivariate analyses on small-N samples comes, of course, with some methodological problems, especially as the number of independent variables increases. As an alternative strategy, therefore, we present the results of a second set of Synthetic Models in Table 4. These models only include two main independent variables: a structural variable and a polling predictor. We first saved the predicted values of the Structural Models (see Table 1) and the Polling Models (see Table 2). These predicted values (or y-hats) were subsequently used as the independent variables of the models presented in Table 4. We therefore limit the number of independent variables included in the Synthetic Models while still making full use of the information and predictive power of the structural and polling models. As is clear from a comparison of the VIF-statistics in Table 3 and Table 4, this approach reduces collinearity in the models slightly.
Synthetic models – y-hats.Germany.

Model estimations for German bundestagelections 1980–2013. Significance levels: +p<0.1, *p<0.05, **p<0.01, *** p<0.001.
Ireland.

Model estimations for Ireland parliamentary elections 1977-2011. Significance levels: + p<0.1, * p<0.05, ** p<0.01, *** p<0.001.
United Kingdom.
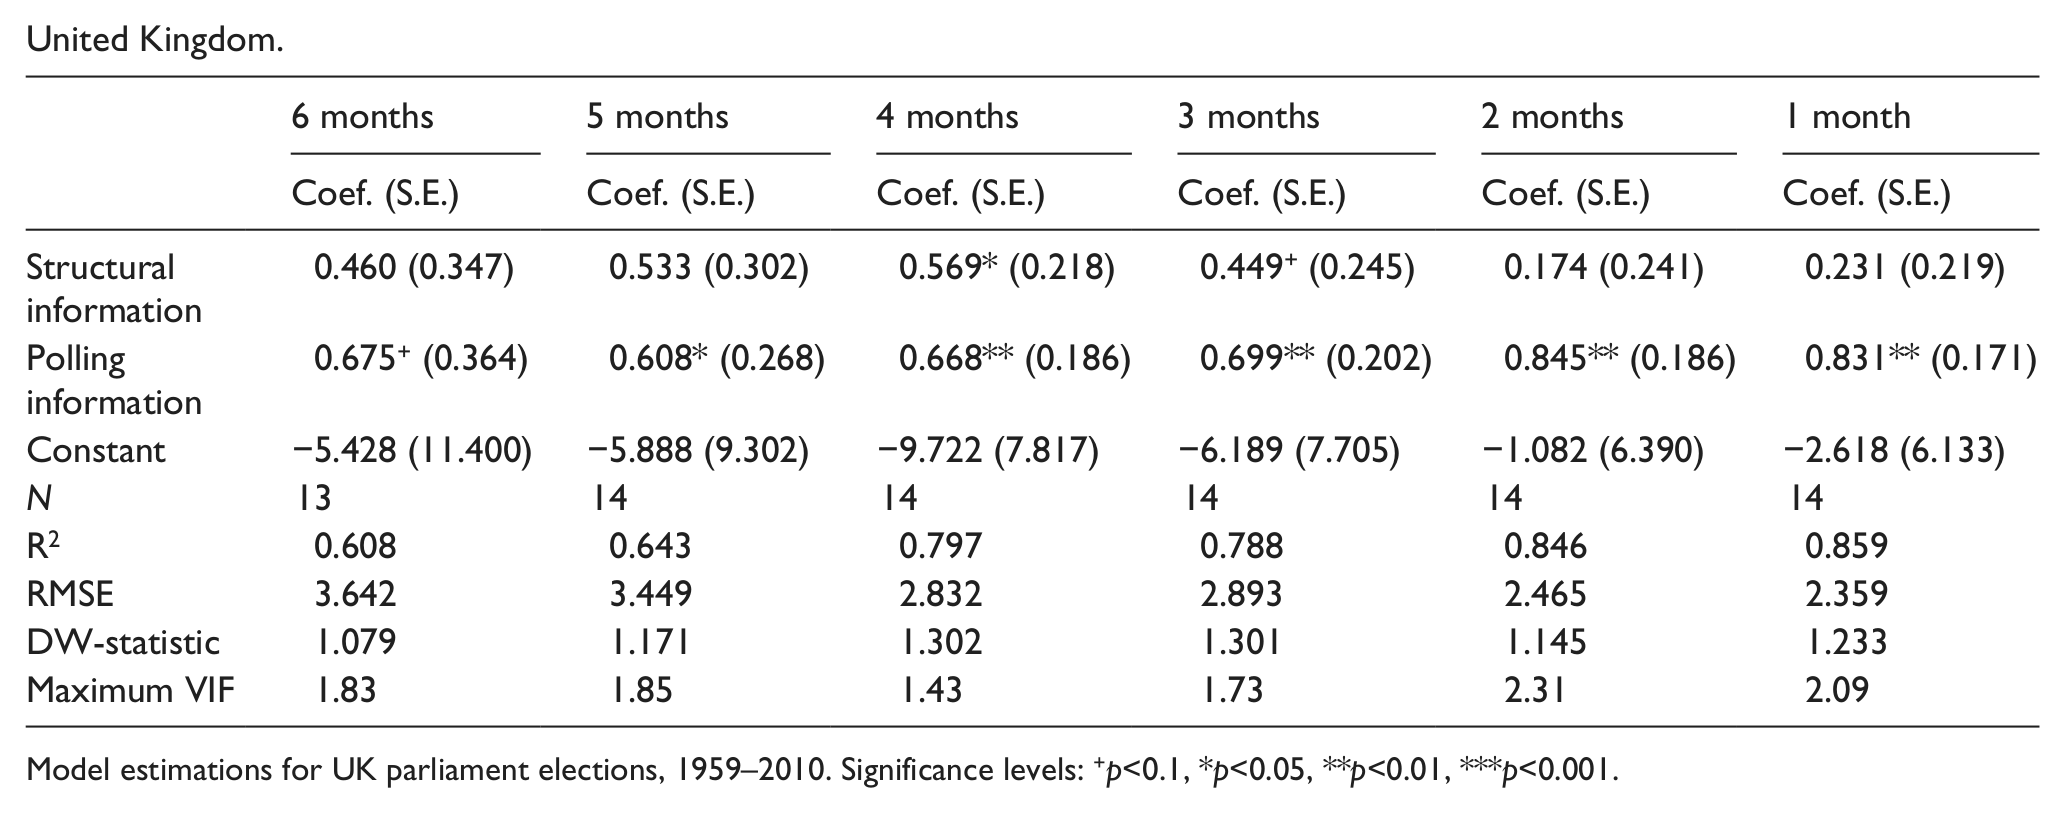
Model estimations for UK parliament elections, 1959–2010. Significance levels: +p<0.1, *p<0.05, **p<0.01, ***p<0.001.
Furthermore, the y-hat approach comes with the additional advantage of allowing a more straightforward comparison of the explanatory power of the structural part (government approval and GDP growth) and the polling part (vote intentions) in the Synthetic Model. From the results in Table 4 it is evident that in the German case, the structural part dominates, while for both Ireland and the United Kingdom the polling part dominates. The results for the United Kingdom are noteworthy; over time we can observe decreasing coefficients for the structural part and increasing coefficients for the polling part. As such, the UK example illustrates how the polls become a more accurate predictor of the results as Election Day draws near. Presumably that is because the polls come to reflect the fundamentals 13 of the Structural Model (Erikson and Wlezien, 2012), which is also why the importance of the structural part is reduced over time.
Comparative model evaluations
How do the three modeling approaches compare? First, there is the basic comparison between the Structural and the Polling Models. Taken alone, the Structural Model generally outperforms the Polling Model, i.e. better statistical fit, less prediction error, more lead time, better explanation of the vote. Thus, if a forecaster had to choose one of these two strategies, the Structural Model would be preferred. This recommendation offers comfort to those who put their faith in theory. But the forecaster does not in fact have to choose one of these two strategies. Instead, he or she could add the two together, via a Synthetic Model. Is the combination of the two strategies worth it? Yes. A synthetic approach offers clear reduction in prediction error, and it is dynamic, allowing continual nowcasting across the campaign. However, there are tradeoffs. The error reduction from selecting the Synthetic Model is not large, and the loss of lead time is not small, given that the optimal model is only 1 month out. As an important nuance, however, the data suggest that, in fact, almost the same accuracy can be gained at 4 months out. Predicting with a 4-month lead is therefore a marginally sub-optimal choice that might be worth it.
Conclusions
Synthetic Models should be pursued further in the quest to gain accuracy in forecasting national elections in Europe. There are two primary directions for future research. First, scholars should extend Synthetic Modeling to more European countries. Second, scholars should extend Synthetic Modeling to the subnational level, focusing on lower, perhaps more politically relevant, units of analysis. Such a subnational move would greatly increase the number of observations, which is an important consideration since this forecasting strategy gains statistical power with a large, independent database.
Our analyses offer a first effort at developing synthetic forecasts for elections in European countries. The results of these analyses indicates that when one succeeds in building a sound Structural Model that accurately forecasts elections, polls do not add much to what we can forecast six months out already. It seems, therefore, as if the fundamentals of vote choice theories can, to a large extent, predict elections in Europe. As an important nuance, however, the polls do add information—perhaps campaign effects—which these fundamentals cannot capture. This additional information becomes all the more important as Election Day approaches, and offers substantial insight for predicting the outcome of elections where structural factors play a smaller role in voters’ choices.