
Abstract
When pre-election polls fail, citizens make choices in an environment where the information is inaccurate. This is bad for democracy. Understanding the conditions under which polls succeed or fail is thus very important for the quality of democracy. Polling firms have often blamed voter turnout when they failed to provide accurate information. There is, however, no systematic test of the impact of voter turnout on polling errors. Using data from 2104 pre-election polls in 206 elections among 33 unique countries from 1942 to 2017, I test whether polling firms have legitimate reason to blame their errors on turnout. Results systematically fail to provide evidence that the quality of pre-election forecasting is a function of voter turnout. This research entails important implications for our understanding of polls’ capacity to predict electoral outcomes and polling firms’ public reactions across time and space.
Elections are citizens’ key mechanism to influence governments in modern liberal democracies and polls have become a key component of electoral campaigns. Hence, having a deep understanding of the conditions under which polls are more likely to fail appears crucial for social scientists and democracy. The stakes are clear: when polls fail, citizens make choices in an environment where the information is inaccurate. A well-known example of the potential democratic consequences that polls’ inaccuracy can generate is the 2002 French presidential election. Many voters supported a minor far-right candidate to send a signal and did so because the polls indicated that their preferred candidate was supposed to finish easily among the top two of the first round (Blais, 2004; Durand et al., 2004). However, things did not turn out as predicted and the far-right candidate ended up making it to the second round. More recently, the media (and most citizens) interpreted some political events like the Trump election in the United States, the United Kingdom 2015 general elections, and the UK 2016 referendum on European Union membership, as major failures of the polls. This situation seems to have invigorated interest in pre-election forecasting and their accuracy (Coppock, 2017; Fisher and Shorrocks, 2018; Wright and Wright, 2018).
Sturgis et al. (2016) provided an in-depth analysis of pre-election polls in the UK 2015 general election. The authors assessed eight potential factors, several of which (overseas voters, postal voting, etc.) were easily dismissed as potential major causes of the polls’ errors. Sturgis et al. (2016) argued that the representativeness of the samples was the primary cause of the gap between polls’ predictions and the electoral outcome. Moreover, the weighting procedures of the polling industry did not improve the predictions. Another in-depth case study comes from the American Association for Public Opinion Research (AAPOR) report on the US 2016 elections where Trump won the presidential election. While the representativeness of the sample was, like in the UK 2015 election, an issue (more specifically, the overrepresentation of college graduates), a late swing vote was also identified among the most important causes of the polls’ errors. Kennedy et al. (2018) also mention that the change in voter turnout (especially from African Americans in swing states) from 2012 favoured Trump.
These insightful case studies allow us to unpack several mechanisms potentially at play. However, one of their limitations is that some macro-level factors cannot be integrated in their analysis, or can only be integrated to a very a limited extent. There is a growing strand of research aiming to integrate macro-level factors in the study of pre-election forecasting. Jennings and Wlezien (2016) provided one of the first works of this kind by shedding light on several important contextual factors that could potentially affect how accurately pre-election polls predict the outcome. 1 The authors show that citizens’ electoral preferences come into focus closer to the election day in presidential elections compared to parliamentary elections. Moreover, using an updated version of their dataset, Jennings and Wlezien (2018) showed that polls’ errors are lower in proportional representation electoral systems (consistent with the idea that vote choice is more structured in terms of party loyalties). Most importantly, they showed, like Prosser and Mellon (2018), that the idea that polling has become less accurate over time (which is usually taken as the conventional wisdom) is a myth.
These contextual aspects like time, electoral systems, election type, and so on, are important macro-level variables to make sense of polling errors. However, it is surprising that they were analysed before another factor that is much more used as an argument to explain polls’ forecasting errors by the polling firms’ themselves: Voter turnout. The variance in voter turnout is used to explain the quality of polls’ forecasts when they fail to predict the electoral outcomes, even if polling firms try to adjust for respondents’ likelihood to vote using different techniques (weights, panel quality, updating the quota, etc.). This manipulation is precisely due to the variance in voter turnout across time and space.
Given that the amount of research is very limited (and lacking a longitudinal perspective), I aim to provide the first systematic test of the impact of voter turnout on polls’ accuracy that goes beyond the conventional wisdom. The strategy relies on an extensive comparative dataset that includes 2104 pre-election polls in 206 elections among 33 unique countries over a time span of 75 years (1942–2017). Results systematically find that turnout is not key to understanding polls’ predictions (and their failures). This conclusion is robust to several estimation techniques and is valid in a variety of contexts. The implication is straightforward: we should be much more sceptical when polling firms (or anyone) raise the turnout argument when explaining polls’ inaccuracy.
The conventional wisdom about turnout and poll accuracy
The idea that turnout can help explain polling errors is prevalent in several countries. In Canada, this argument was used by the vice-president of Angus Reid Public Opinion, a well-established polling firm in the country, when turnout was lower than expected in a Canadian provincial (British Columbia) election (Canadian Broadcast Corporation, 2013). David Coletto (from Abacus data, another Canadian polling firm) and Bryan Breguet (from Too Close to Call, one of the most popular poll aggregators of the country) also advanced the same argument (Coletto and Breguet, 2015). In the United States, political pundits and researchers alike have raised the issue of voter turnout and poll accuracy. Most importantly, the report from members of the American Association for Public Opinion Research acknowledged that changes in voter turnout from 2012 to 2016 favoured Trump, although it likely did not cause most or the errors between the forecasts and the outcome (Kennedy et al., 2018). This issue of voter turnout has also been raised in several European countries. For example, the head of political polling at Harris Interactive stated that (the anticipated) voter turnout is an important component to adjust and the firm’s success during the 2017 French presidential election was attributable to this calculation (Politico, 2017). Moreover, Mellon and Prosser (2017: 663) mention that ‘in many cases, pollsters have blamed differential turnout with little evidence’ citing the 2015 UK general election as an example.
Voter turnout is a recurrent argument advanced by political elites (politicians and polling firm representatives) to explain polls’ failures. However, as mentioned previously, it receives surprisingly little attention from scholars. 2 First, Giuliani (2019: 169) studied polls’ failures and successes during the 2014 European election in 28 countries and mentioned that one needs to control for voter turnout as it is ‘one of the challenging elements of European elections, strongly affecting our prediction capacity’ (my emphasis). However, and surprisingly, the author does not analyse this feature as the hypothesis focuses on other interesting variables and the effect of turnout is not even shown in the regression models. Second, Coletto and Breguet (2015) make use of variation in turnout and polls’ errors in nine Canadian provincial elections from 2011 to 2013 and conclude that polls’ accuracy is better when the change in turnout rate is greater.
Third, although Lauderdale et al. (2020) do not focus on voter turnout, they analyse the impact of that factor on polls’ predictions in a simple but efficient way. Their model includes a prediction of voter turnout in each of the 50 states for the 2016 US election, the 380 local-authority-level estimates in the United Kingdom for the 2016 referendum on European Union membership, and the 650 constituencies for the 2017 general election. When replaced by the true turnout rates (Lauderdale et al., 2020: section 5.3), the predictions’ errors decrease. Regarding the EU referendum, the prediction of the Leave option rose from 50.6% to 51%, getting slightly closer to the actual result of 51.9%. Most importantly, the overall error of 2.6% decreases to 1.8% for the 2017 general election. 3
These three studies mentioned earlier are the only ones, to my knowledge, that mention or analyse the impact of voter turnout on polls’ accuracy. The limited research on the subject is incongruous with the proportion of polling firm representatives and scholars who believe that the relationship is robust. While the exact theoretical mechanisms behind this claim have not been systematised, we can think of some arguments to support the conventional wisdom. When the proportion of voters changes over time, it can become more difficult to predict the outcome because there is a risk that some specific groups become over- and under-represented in the samples used to predict the election. This is why polling firms apply a ‘likely voter model’ (Erikson et al., 2004; Traugott, 2005). This is encapsulated by Coletto and Breguet (2015: 45) who mention that compulsory voting (where the vast majority of people vote) would make it easier for polling firms to accurately predict election outcomes. That said, the likely voter models used by polling firms are not a panacea. As Kennedy et al. (2018: 5) state, ‘When turnout patterns diverge from recent elections, historical data can be unhelpful or even misleading’. In other words, it is reasonable to expect that predictions would be easier to make if 100% of the population would vote and that deviations from this ideal entail more risks. That said, we lack a systematic empirical test of the relationship between voter turnout and polls’ accuracy.
In my research, I aim to provide the first systematic empirical investigation of the relationship between voter turnout and polls’ accuracy. The expected effect of voter turnout on polls’ predictions is clear. Polling firm representatives (i.e. the market, the practitioners) often raise the turnout factor in order to explain the failures of the polls. Academic research, although very limited, points in the same direction (Coletto and Breguet, 2015; Lauderdale et al., 2020). Hence, the hypothesis that I test in this research is the following:
Hypothesis 1. The greater the turnout rate, the better the polls’ predictions.
Data and indicators
In this research, I make use of what is, to the best of my knowledge, the largest cross-national collection of vote intention polls. It includes more than 30,000 polls in 351 national elections from 45 unique countries covering more than 70 years (1942–2017). Information on the project that led to the creation of this dataset is publicly available. 4 With the only exception of compulsory voting, all the variables that I used were included in the dataset and the sources of the data can be found in the Supporting Information of Jennings and Wlezien (2016). Finally, the codebook and the version of the dataset that I used are publicly accessible in Jennings and Wlezien (2017).
As I analyse polls’ accuracy, I focus on poll results that were published during the final week prior to the election day. Thus, every election where at least one poll was published within the final week of the electoral campaign is included, which corresponds to 206 elections in 33 different countries covering the entire timeline (1942–2017) of the dataset. The list of countries and election-years is detailed in Table SM.1 of the Supplementary Information.
The dependent variable is the error between the polls’ predictions and the electoral outcomes. There are different ways to calculate polls’ predictions and the error. For the sake of parsimony, I use the simple measure of the error ‘on the margin’. It corresponds to the lead of the party (or candidate) receiving the most votes over the second most popular one – see the robustness checks section for alternative measures of polls’ predictions. Equation 1 below illustrates this measure, where a represents the most popular party or candidate and b represents the second most popular one

The predictor of interest is voter turnout. There are two ways of measuring it: the percentage of registered voters that turn out, or the percentage of a country’s population eligible to vote that did vote). The dataset includes the measure that is used by the national public institution that organises the election. 5 Figure 1 shows the distributions of voter turnout and predictions’ errors. The error (panel a) ranges from 0.3 to 7.8, with a mean of 2.1 and a standard deviation of 1.4. Turnout (panel b) ranges from 32.5 to 96, with a mean of 71.1 and a standard deviation of 16.3. The next section presents the relationship between these two variables.
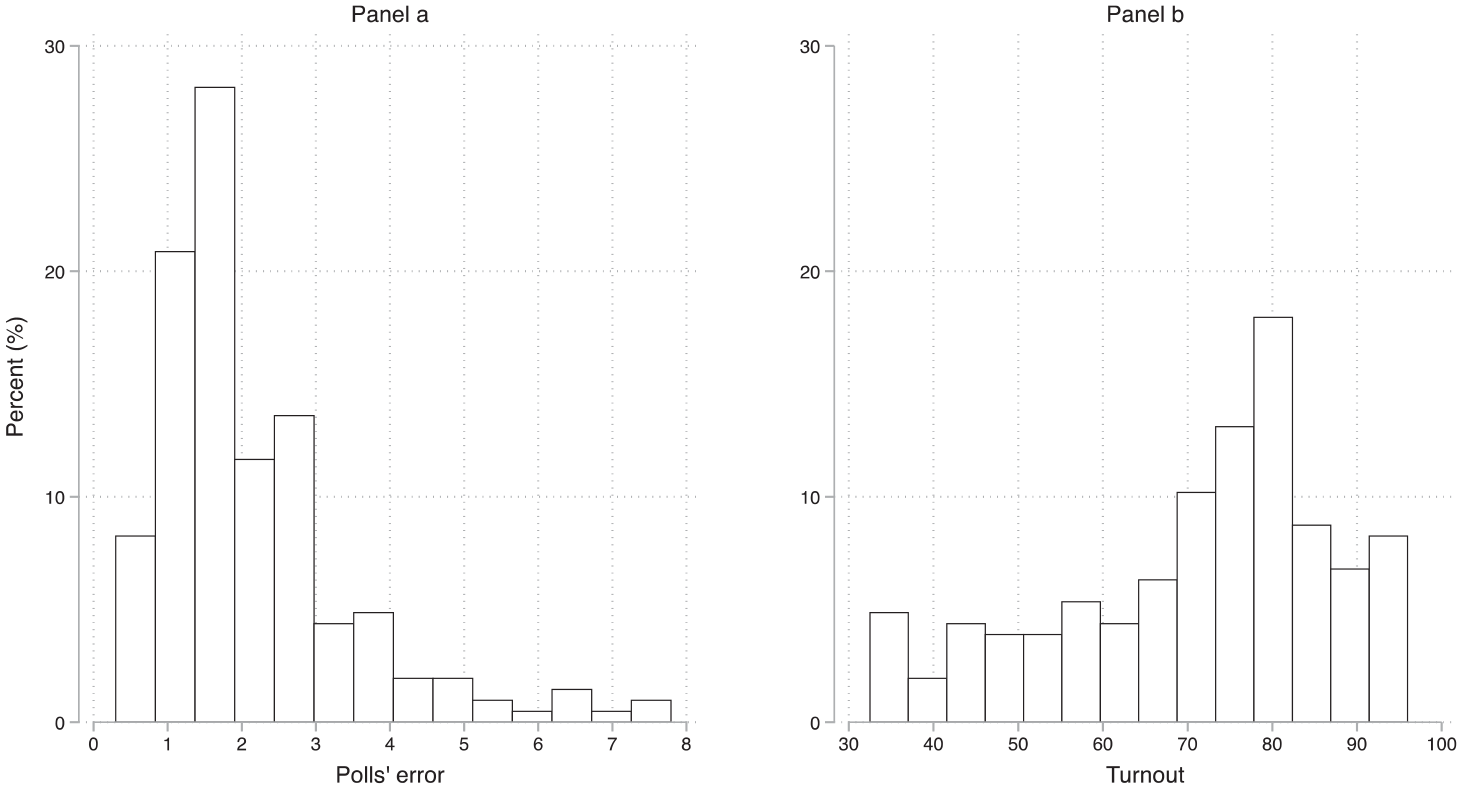
The distribution of the polls’ errors and voter turnout.
Results
The first strategy relies on the 206 elections. For every observation (election-year), there is an indicator of the national turnout and the polls’ errors. The bivariate relationship is shown in Figure 2. 6 The left panel (panel a) displays the linear trend. The slope is negative and the predicted errors at the minimum and the maximum are 2.6 and 1.8, for a total (maximum) effect of about −0.8. In the right panel of Figure 2 (panel b), the local regression 7 clearly shows an absence of any relationship. The predicted poll error never substantially differs from 2 points, regardless of voter turnout. Hence, Figure 2 suggests that turnout is not substantially linked to the quality of polls’ predictions of the electoral outcomes, regardless of whether the estimation technique is parametric or not.
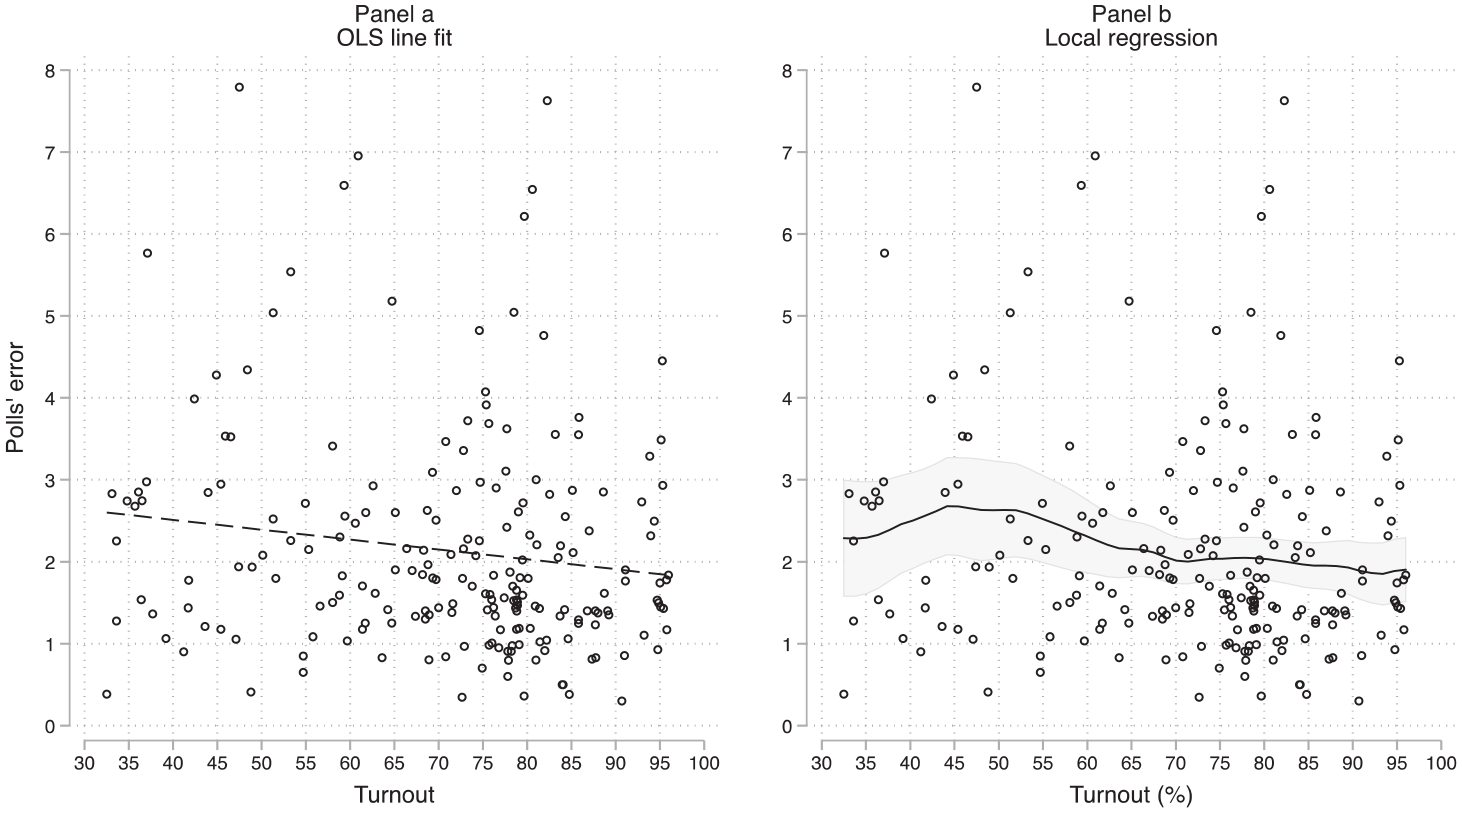
Voter turnout and polls’ errors using linear and non-linear functions.
In a second strategy, I estimate the polls’ predicted error focusing on the effect of voter turnout while keeping other factors constant. I first ran an ordinary least squares (OLS) regression with country fixed-effects and no control variables (Model 1), and then an OLS regression without country fixed-effects but including covariates for presidential elections, proportional representation electoral systems, effective number of electoral parties (ENP), established democracies, and compulsory voting (Model 2). 8 Table SM.3 of the Supplementary Information shows the full results of the regressions and Figure 3 illustrates the effects of voter turnout in these models by illustrating the predicted errors based on the proportion of citizens who turn out.
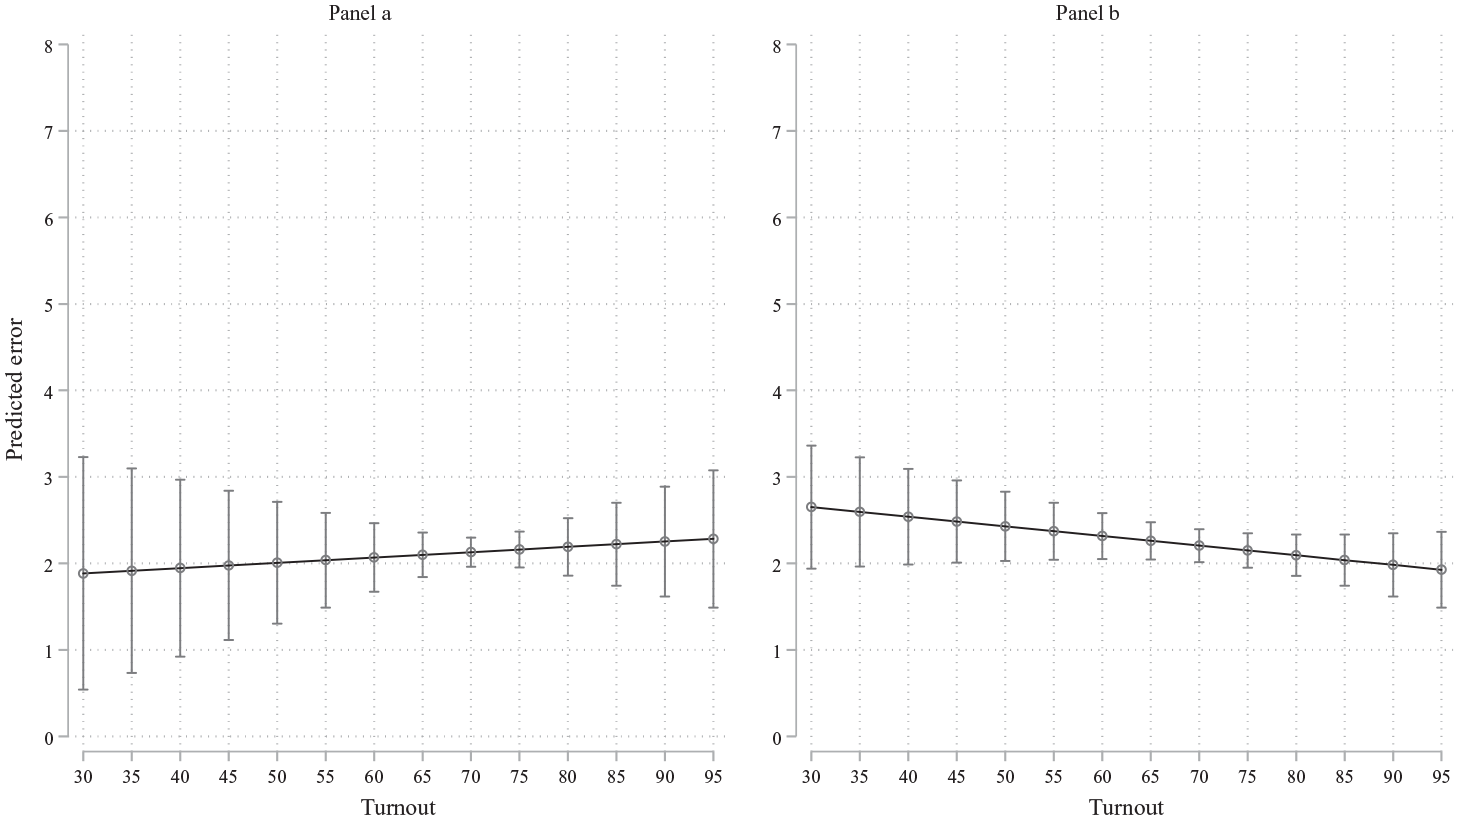
The impact of voter turnout on polls’ errors.
As evidenced by the coefficients and the standard errors of Table SM.3 of the Supplementary Information and the confidence intervals of Figure 3, turnout does not have an independent impact on polls’ predictions in both models. It never reaches conventional levels of statistical significance (p < .05 or even p < .10). However, as argued by Amrhein et al. (2019), I focus on the substantial effect rather than p-values. The maximum effect, if we compare the minimum to the maximum, is about 0.4 in both cases. This is less than half a standard deviation of the dependent variable, even when taking the maximum effect, which is far from a conservative approach. These results strongly suggest that voter turnout is unrelated to pre-election polls’ accuracy.
In a third strategy, I examine the impact of turnout on polls’ predictions by focusing on countries for which there are several observations over time. Focusing on the countries that have more than five observations over time, I am able to include 12 different countries: Australia, Canada, France, Germany, Ireland, the Netherlands, New Zealand, Norway, Portugal, Spain, the United Kingdom and the United States. 9 This approach allows a more thorough analysis of the changes in voter turnout and examines whether they are associated to the changes in polls’ errors. Figure 4 shows the results.
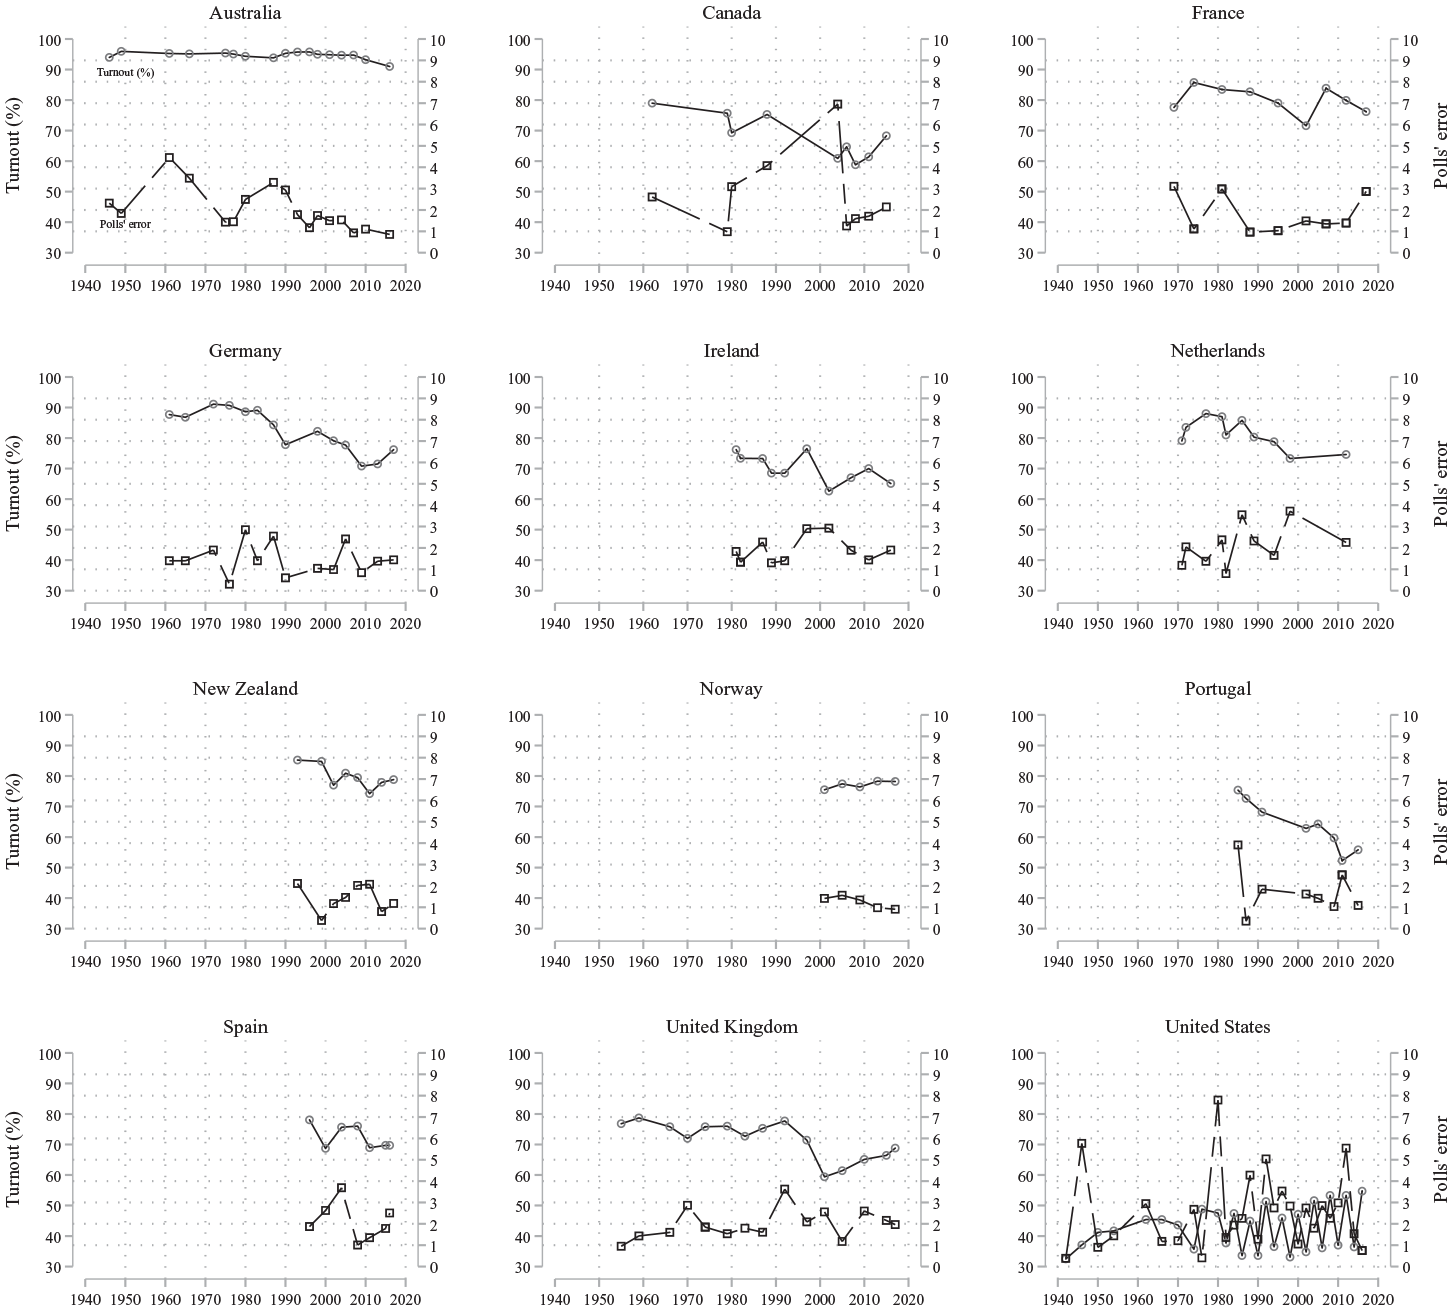
Voter turnout and polls’ errors in 12 countries with longitudinal perspective.
First, turnout is overall in decline over time. This trend was expected and has been the subject of many studies, some of which include the aforementioned 12 countries (Blais and Daoust, 2020; Blais and Rubenson, 2013; Franklin, 2004). The case of Australia is probably the most interesting because voting is compulsory, which prevents a substantial amount of variance on voter turnout. This is not a perfect ‘placebo’ or control group and we cannot (and should not try to) randomise voter turnout or polls’ predictions such as in an experimental setting. That said, if we have a case where there is very little variance on voter turnout, then we should also expect almost no variance in polls’ errors from one election to another – as the hypothesis is that voter turnout negatively affects polls’ predictions. However, even in Australia where turnout is very stable (due to compulsory voting), we can observe some non-trivial movements in the polls’ errors. These bumps over time in Australia would be difficult to explain if turnout had had an independent effect on polls’ errors. There could be other factors in that case and there could still be a substantial effect of voter turnout. Therefore, we should also look at the big picture from Figure 4.
The trends for both voter turnout and polls’ errors do not seem to correlate in any positive or negative systematic direction. In fact, when there is an important movement in the latter direction, it is rarely associated with a substantial change in voter turnout. Running bivariate OLS regression in these 12 countries shows the absence of any robust result. Focusing on the coefficients of voter turnout shown in Figure SM.1 of the Supplementary Information, none (out of 12) are significant and most importantly, the direction is not consistent as it is positive in four countries and negative in eight. 10 The third strategy focusing on within-country variation over-time strongly suggests that voter turnout is unrelated to the quality of polls’ predictions.
Robustness checks
In this section, I test whether different choices in my approach would lead to different conclusions. First, given the nested structure of the data where elections are conducted within different countries, I ran mixed-effects linear models where elections are nested in countries. Table SM.4 of the Supplementary Information shows that the results are robust using this technique whether I include covariates or not (Models 1 and 2). The results show non-substantive and statistically non-significant effects.
Second, I made use of the error on the margin (Equation 1) to measure polls’ errors because it is much simpler than other measures and it is easier to make sense of the distributions (Figure 1). One could think of other measures. The simplest one is to use the absolute error on the leader (i.e. the gap between the prediction and the outcome for one party only). We could also aim to refine the measure by making it more sensitive to multi-party systems. Arzheimer and Evans (2014) have argued that a measure based on the log of the odds ratio of polls to the election outcome is better to analyse polls’ accuracy in multi-party systems. I replicate the main findings in Table SM.5 of the Supplementary Information using these two different alternatives: the absolute error on the leader and the log of the odds ratio of polls to the election results. Models 1 and 2 of Table SM.5 of the Supplementary Information show that the results stand whether I use the absolute error on the winning or (the log of) the odds ratio of polls’ forecasts to the actual outcomes. The main conclusion remains: Voter turnout is unrelated to the quality of polls’ predictions. On potential measurement issues, I should mention that excluding countries where registration is initiated by individuals and not the state (like the United States) does not alter the results, which could be seen in Figure 4.
Third, although I included several covariates in the estimations of Figure 2 (panel b), one might wonder whether closeness of the election, even if not substantially related to turnout (Stockemer, 2017) might improve the estimations of the effect of voter turnout. Table SM.6 of the Supplementary Information shows that controlling for polls’ forecasts of the two most important parties in the same equation does not alter the results. Fourth, it is possible that the claim of the polling firms that lower turnout rates is linked to lower quality of predictions applies to a subset of countries. Hence, I included interaction terms between turnout and several contextual variables (effective number of parties, electoral systems, new democracy) in Models 1–4 of Table SM.7 of the Supplementary Information. Results are clear: the expected effect of voter turnout does not show up in any of these subsamples.
Discussion
Making sense of polls’ forecasts is crucial, notably because polls are now at the heart of modern electoral campaigns (Daoust et al., 2020). We should not be indifferent when they ‘fail’ (Fisher and Shorrocks, 2018), that is, when they provide inaccurate information to the public sphere. An important strand of literature has tried to explain the failures of pre-election polls to predict electoral outcomes, but it has been a difficult task because of the nature of the level of observation. As the predictions and the outcomes are at the election level, major electoral inquiries such as the American National Election Study (ANES) or the British Election Study (BES) are not the most insightful when it comes to integrate macro-level features. The dataset released by Jennings and Wlezien (2016, 2018) directly addressed this issue and allowed me to test the impact of voter turnout on polls’ predictions. This relationship has been surprisingly neglected by scholars, despite the fact that polling firms have often used voter turnout to explain their poor forecasts. Their argument is clear: when more people turn out, polls’ predictions are better. This has not been challenged by researchers and, in fact, the insightful but limited amount of research suggested that polling firms were right (Coletto and Breguet, 2015; Lauderdale et al., 2020).
In this research, I provide the first systematic test of this claim with a comparative perspective. 11 Despite the use of several empirical approaches, I fail to find an independent effect of voter turnout on polls’ errors and made sure that this surprising result was not driven by different arbitrary choices (see the ‘Robustness checks’ section). This investigation is part of a growing strand of research scrutinising the potential gaps between the pre-election polls and the electoral outcomes – see the two major reports in the United Kingdom (Sturgis et al., 2016) and the United States (Kennedy et al., 2018) – and investigating which macro-level conditions are associated with better forecasting in polls (Jennings and Wlezien, 2016, 2018). For example, Jennings and Wlezien (2018) and Prosser and Mellon (2018) have debunked the myth that polls are becoming less and less accurate over time. My contribution to this research is in the same vein. I tested whether an important macro-level factor influences the quality of the information provided by polling firms. Contrary to some important institutional factors like the type of election (Jennings and Wlezien 2016), I find that turnout is not related to polls’ accuracy.
Polling firms and political pundits should not blame poor forecasting on variation in voter turnout. This holds in many contexts regardless of the type of election, the number of effective parties, the electoral system and in new democracies. Turnout cannot explain the failure of polls to provide the public with accurate information. We should not accept this argument from polling firms. They (and scholars) must focus on other factors to make sense of their errors and improve the information that they provide to citizens.
Supplemental Material
sj-pdf-1-bpi-10.1177_1369148120986092 – Supplemental material for Blame it on turnout? Citizens’ participation and polls’ accuracy
Supplemental material, sj-pdf-1-bpi-10.1177_1369148120986092 for Blame it on turnout? Citizens’ participation and polls’ accuracy by Jean-François Daoust in The British Journal of Politics and International Relations
Footnotes
Acknowledgements
The author is thankful to Will Jennings and Christopher Wlezien who generated the dataset and made it publicly accessible, and people who participated to the Tuesday seminar of the Research Chair in Electoral Studies and the Canada Research Chair in Electoral Democracy (Université de Montréal) where a previous version of this article was presented. André Blais, Vincent Arel-Bundock, Ruth Dassonneville, Claire Durand, Fernando Feitosa, Jean-François Godbout, Alexandra Jabbour, Florence Vallée-Dubois, among others, provided valuable feedback. He also benefitted from comments by Jon Mellon. Any errors are the author’s own.
Funding
The author(s) received no financial support for the research, authorship and/or publication of this article.
Supplementary information
Additional supplementary information may be found with the online version of this article.
Contents
Table SM.1. Countries and elections included in the dataset (alphabetical order).
Figure SM.1. Coefficients of voter turnout in 12 countries.
Table SM.2. Descriptive statistics.
Figure SM.2. Coefficients of change in voter turnout (t-1 minus t) in 12 countries.Table SM.3. Regression results, OLS regression predicting polls’ errors.
Table SM.4. Results using mixed-effects linear models.
Table SM.5. Results using alternative indicators of polls’ errors.
Table SM.6. Controlling for the closeness of the election
Table SM.7. Testing contextual effects.
Notes
References
Supplementary Material
Please find the following supplemental material available below.
For Open Access articles published under a Creative Commons License, all supplemental material carries the same license as the article it is associated with.
For non-Open Access articles published, all supplemental material carries a non-exclusive license, and permission requests for re-use of supplemental material or any part of supplemental material shall be sent directly to the copyright owner as specified in the copyright notice associated with the article.