
Abstract
While international election observations missions often aim to present generalizable claims about the quality and integrity of an election, their findings are rarely based on a representative sample of observations, undermining the credibility of the missions. Bias in the selection of polling stations, among other things, can inflate or deflate the percentage of polling stations where observers find significant flaws. This article uses original data from Organization for Security and Co-operation in Europe (OSCE) election observation missions to illustrate the nature of the problem of selection bias in international election observation, and show how the percentage of ‘bad’ polling stations (in the absence of selection bias) can be estimated through a weighting procedure. The article finds that, while there is a strong degree of selection bias, this does not significantly impact the overall percentage of ‘bad’ polling stations that is reported by OSCE observation missions.
Introduction
The monitoring of elections by foreign observers in countries that are not established democracies has become a global norm. Up to 80% of elections in such countries are now monitored by foreign observers (Hyde, 2011; Kelley, 2012). Election observation missions (EOMs) often carry great political weight. Most importantly, the findings from an EOM can legitimize or delegitimize an electoral outcome in the eyes of both domestic and international audiences. A critical statement from an EOM, for instance, can persuade people to join protests against the government, which subsequently can help lead to regime change (Bunce and Wolchik, 2011; Donno, 2013).
In its public statements and reports, an EOM draws conclusions on the quality and integrity of the electoral process based on the observation of voting and counting procedures during election day. Ideally, therefore, the sample of polling stations that are visited by observers is as representative of all polling stations in the country as possible. An EOM in this sense resembles a social survey, with observations of voting and counting procedures instead of respondents. A problem of international EOMs, correspondingly, is that the polling stations that are visited by observers do not form a representative sample, that is, they contain selection bias. As a consequence, the image that emerges from the observation of selected polling stations risks being distorted, undermining the credibility of the observation mission and its findings. In particular, selection bias in election observation can provide interested parties, including undemocratic governments, with ammunition to challenge the findings of observation missions.
Of all organizations involved in election observation, the Organization for Security and Co-operation in Europe (OSCE) arguably carries out the most prominent effort – with a consistent and elaborate methodology and large numbers of observers. Through its Office for Democratic Institutions and Human Rights (ODIHR), the OSCE has dispatched over 100 EOMs, in addition to many more small-scale election assessment missions, involving over 30,000 observers since 1996 (Schmeets, 2011). The most important data coming out of the OSCE EOMs is the percentage of visited polling stations that have received an overall negative assessment from observers. These percentages of ‘bad’ polling stations inform the general conclusion from the EOM about the quality and integrity of the election process, and are widely reported in local and international media. The selection bias that is inherent in OSCE EOMs, however, raises concerns about the validity of the reported percentages of polling stations in which procedures are flawed. In particular, unrepresentative sampling may lead to deflation or inflation of these percentages.
The issue of selection bias in international election observation, and its consequences, has not received significant attention. One seminal publication assumes that the distribution of election observers in one particular OSCE observation mission ‘approximates random assignment’ (Hyde, 2007: 47–48). Others, however, have rightly noted that the OSCE does not use random assignment (Herron, 2013; Sjoberg, 2012: 4). This article for the first time assesses the impact of non-random assignment in OSCE election observation. The findings suggest that, while there is a strong degree of selection bias, this does not significantly impact the overall percentage of ‘bad’ polling stations that is reported by OSCE observation missions. The article starts by illustrating the problem of selection bias and then shows how a weighting procedure, commonly used in sample surveys, can be applied to estimate the percentage of ‘bad’ polling stations in the absence of selection bias. The article draws on original data from five diverse EOMs conducted in recent years in the OSCE region – Ukraine (2006), Kazakhstan (2007), Azerbaijan (2010), Armenia (2012) and Georgia (2012).
Types of selection bias
Operating in teams of two, the short-term observers (STOs) are assigned an Area of Observation (AoO) that comprises anything between a few dozen and a few hundred polling stations. From among these polling stations, the STOs on election day independently select on average around 10 polling stations where they observe voting procedures, and one polling station where they observe counting procedures directly after the polling stations close. In each polling station, observers fill out a form that contains around 50 questions covering the main elements of voting and counting procedures. The information retrieved from the forms contains the substantive basis for the preliminary statement and final report of the EOM that are published after the election. The most crucial question on the forms asks the observers to give an overall assessment of the conduct of the voting/counting process in the given polling station with four response options: ‘very bad’, ‘bad’, ‘good’ and ‘very good’. The share of observers that have assessed the voting and counting process positively (‘good’ and ‘very good’) and negatively (‘bad’ and ‘very bad’) is reported in the preliminary statement and final report of the EOM, and represents one of the most important and visible pieces of information coming out of the mission. Moreover, percentages from different EOMs can reveal trends and patterns over time and across countries.
On average some 330 STOs are on the ground to observe the voting and counting procedures on election day. Because observer numbers are limited, choices must be made regarding the number of observers that are deployed per region and per district, and regarding which of the available polling stations in a district are visited. These choices are made at three different moments by as many different groups of people who are involved in the EOM – the core team of the EOM, long-term observers (LTOs) and STOs. The choices are summarized in Table 1.
The selection of polling stations in Organization for Security and Co-operation in Europe election observation missions.

EOM: election observation mission.
The first choice is made by the core team of experts, including the Head of Mission, who, over the course of the EOM, are located in the capital of the country that organizes the election. Members of the core team draw up a deployment plan that specifies what numbers of LTOs and STOs will be deployed to the different regions of the country. Considerations that may play a part in the selection of regions and the number of observers to be deployed to those regions include logistics, security and past experience with observation, as well as the desirability of selecting diverse regions. While, in theory, the number of STOs per region should be roughly proportional to the number of polling stations in a region, in practice many regions receive too many or too few observers. We refer to this as type 1 selection bias. Consider the example of the Mtskheta-Tianeti region, one of 11 regions in Georgia, in the 2012 legislative election. In that election, Georgians voted in 3568 polling stations, 122 of which were located in Mtskheta-Tianeti. Of the 3568 polling stations, 1266 were visited by OSCE observers, including 65 in Mtskheta-Tianeti. Hence, the region was home to 3.4% of all polling stations, while its share of observations in the OSCE EOM was 5.1%. Polling stations in the Mtskheta-Tianeti region, consequently, were disproportionally often visited by OSCE observers by a factor of 5.1 / 3.4 = 1.5 times. National capitals, which are typically an administrative region in their own right, tend to be especially overrepresented in numbers of observations. In the EOM to the 2006 legislative election in Ukraine, for instance, polling stations in Kyiv were visited roughly five times more often than would have been proportional. A major reason for the overrepresentation of national capitals is that observers from parliamentary delegations (from the OSCE, the European Union (EU) and the Council of Europe) who are part of the OSCE EOMs often opt to only carry out the observation in the national capital.
The second choice is made by the LTOs who, in teams of two, are assigned to a particular region. One of the main responsibilities of the LTOs is to lay the groundwork for the STOs, who arrive only several days before election day and leave the day after. Following a brief period in which they explore the region, the LTOs select the districts in the region to which STO teams will be dispatched. As with the regional level, the number of STOs per district should be proportional to the number of polling stations in a district, but it often is not. We refer to this as type 2 selection bias. Consider the example of the District Election Commission (DEC) area Shchuchinsky in the Akmolinsk region in Kazakhstan in the 2007 election. The Akmolinsk region in the 2007 election had 831 polling stations, of which 127 were visited by OSCE observers, equalling a coverage of 15%. Of the 831 polling stations, 77 were located in the Shchuchinsky DEC area, and eight out of these 77 polling stations (10%) were visited by OSCE observers. Within the Akmolinsk region, then, the Shchuchinskiy DEC area was underrepresented by a factor of 1.5 (15/10). By contrast, regional capitals and districts close to the regional capital are often especially overrepresented. There are a number of reasons why LTOs disproportionately select AoOs in or close to the regional capital. One is that more remote areas generally offer fewer and lower-quality options for accommodation, and often have poor infrastructure, in particular poor road conditions. Another reason is that centrally located districts feature larger numbers of polling stations, and are home to the regional election commission, which is often visited by observers.
The third choice that causes selection bias in the sampling of polling stations, finally, is made by the STOs. The administration of the election in administrative districts is supervised by what is most often referred to as a DEC. AoOs in most cases coincide with a DEC area. Among DEC areas, a distinction can be made between those that are exclusively urban, exclusively rural and mixed urban/rural. In the latter case, the DEC area is comprised of a town or city where the DEC is located, and a number of smaller settlements. In mixed DEC areas, STO teams disproportionately observe voting and counting procedures in centrally located (mostly urban) polling stations at the expense of polling stations that are often rural and located further away from the district centre. We refer to this as type 3 selection bias. The main reason for this type of selection bias is expediency: in the urban centre distances are shorter and road conditions better. Moreover, the centrally located polling stations are generally closer to the hotel where the STOs stay, as well as to the building of the DEC, which is especially relevant in the selection of the polling station where counting procedures are observed as STO teams go the DEC building after the completion of the count to observe the tabulation of the vote. Consider the example of Martuni DEC area in the Gegharkunik region of Armenia in the EOM to the 2012 election. In that election, the Martuni DEC area was home to 46 polling stations, out of which five were located in the centre of the DEC area – the town of Martuni. Of the 19 polling stations visited by OSCE observers during voting, four were in the centre of the DEC area. While the centre of Martuni DEC area accounted for some 11% of polling stations, 21% of observations were conducted there. The centre of the Martuni DEC area, then, was overrepresented in terms of number of observations by a factor of almost 2.
The choices that affect which polling stations are eventually visited by observers are, in sum, made at three successive points in time, at three different geographic levels, and by three different types of actors who are involved in the EOM. Each choice entails a certain degree of distortion from a situation in which the observed polling stations are representative of the polling stations in the country. The degree of selection bias can vary greatly between EOMs, and between the different geographic levels within an EOM.
Correcting for selection bias
The rate of negative assessments in an EOM can be an indication of the quality and integrity of the election process. Existing research suggests that electoral malpractice is more common in rural areas than in urban areas (Bratton, 2008; Hicken, 2007). In elections with a significant degree of irregularities, moreover, it is common that there is regional variation in the extent of electoral malpractice (Birch, 2012; Myagkov and Ordeshook, 2009). To get an accurate picture of the electoral proceedings, therefore, it is important that centrally located and peripheral polling stations, and polling stations in different regions, are visited to a degree that is proportional to their numbers.
When we know the location of polling stations, which polling stations have been visited by observers and which of these have received a negative assessment, we can provide precise estimates of how many polling stations would have been assessed negatively in the absence of selection bias. We do this through an additive weighting procedure. Weighting data is a common procedure in social surveys, and is used among other things to correct for variation in response rates between subpopulations. Election observation does not face the issue of non-response (every visited polling station yields observer assessments), but does suffer from selection bias, in particular underrepresentation and overrepresentation of specific categories of polling stations. A weighting procedure is advised only when the categories are not excessively underrepresented or overrepresented in order to avoid a large variation of the weights, that is, very low and very high weights. If, for instance, rural polling stations are almost entirely left outside the observation in a country with an equal divide between rural and urban polling stations, the small number of rural polling stations that are visited would receive an extremely large weight in the weighting procedure. Unless the few visited rural polling stations would be representative of all rural polling stations, the weighting procedure would introduce error and distort results.
A typical OSCE EOM visits all regions in the country to obtain a balanced picture of the election process, and covers a substantial share of both rural and urban polling stations. The distortions that emerge in the sampling process are in principle unintentional and as such do not result from a deliberate non-coverage sampling strategy. The selection bias is caused by other factors, including principally the factors that are outlined above. The selection bias cannot be treated as a missing data problem, which can be addressed by imputation, for example on the basis of the mean value or estimates based on regression. A weighting procedure as proposed here, instead, is appropriate for a vast majority of EOMs. OSCE EOMs to Russia are a clear exception because, due to the country’s size relative to the number of observers, many regions are not covered by the OSCE EOMs. In these EOMs, therefore, the findings from the mission cannot be extrapolated to the whole country.
Consider the example of polling station X in DEC area 99 in the Kirovohradska region that received a negative assessment in the EOM to the Ukrainian legislative election in 2006. At the time of the election, DEC area 99 had 131 polling stations, of which 41 were in the centre of the DEC area (the town of Oleksandriya), and 90 were outside the centre of the DEC area. Twelve polling stations were visited by OSCE observers both inside and outside the centre of the DEC area. In three out of 24 observations, a negative assessment was given by observers: two of these were in the centre of the DEC area, and one, polling station X, outside. The Kirovohradska region is home to 2.9% of the polling stations in the country, but its polling stations account for only 2.7% of the observations of the EOM: hence, in terms of number of observations, the region has been underrepresented by a factor of 0.94. After correcting for type 1 selection bias, the relative value of the negative assessment for polling station X, then, is 1 / 0.94 = 1.06. Within the Kirovohradska region, DEC area 99 has 13.6% of the polling stations, but 25.0% of the observations: the number of observations in the DEC area, consequently, is disproportionately large by a factor of 1.84. After correcting for type 2 selection bias in addition to the type 1 selection bias, the relative value of the negative assessment for polling station X, then, is adjusted to 1.06 / 1.84 = 0.58. The final part of the weighting procedure is only applied to polling stations in mixed DEC areas. In the mixed DEC areas that were visited by observers during the 2006 election in Ukraine, 3580 polling stations (15%) were located inside the centre of these DEC areas, and 20,050 polling stations (85%) were located outside the centre of the DEC areas. Of the 1986 observations in these DEC areas, 643 (32%) were inside the centre of the DECs, against 1363 (68%) that were outside the centre of the DECs. Polling stations inside the centre of mixed DEC areas, consequently, were overrepresented by a factor of 2.1, while polling stations outside the centre of mixed DEC areas were underrepresented by a factor of 0.80. After correcting for type 3 selection bias in addition to types 1 and 2 selection bias, the value of the negative assessment for polling station X, then, is 0.58 / 0.80 = 0.73.
In the EOM to the Ukrainian election in 2006, 307 observations of voting procedures contained a negative overall assessment. Correction for type 1 selection bias changes this number to 327. The subsequent correction for type 2 selection bias further changes this number to 327. Finally, the number of polling stations with a negative assessment that is obtained after also correcting for type 3 selection bias, is 337. Given that the EOM yielded 4034 observations of voting procedures, there were 8% ‘negative’ observations both before and after the weighting procedure. Table 2 shows the change in the percentages of polling stations with negative assessments in the five EOMs after the weighting procedure. The weighting procedure was performed using the Bascula software package that was developed by Statistics Netherlands for corrections of selection bias in social surveys (Nieuwenbroek and Boonstra, 2002).
Percentage of ‘bad’ polling stations before (A) and after (B) weighting (standard errors are in parentheses).
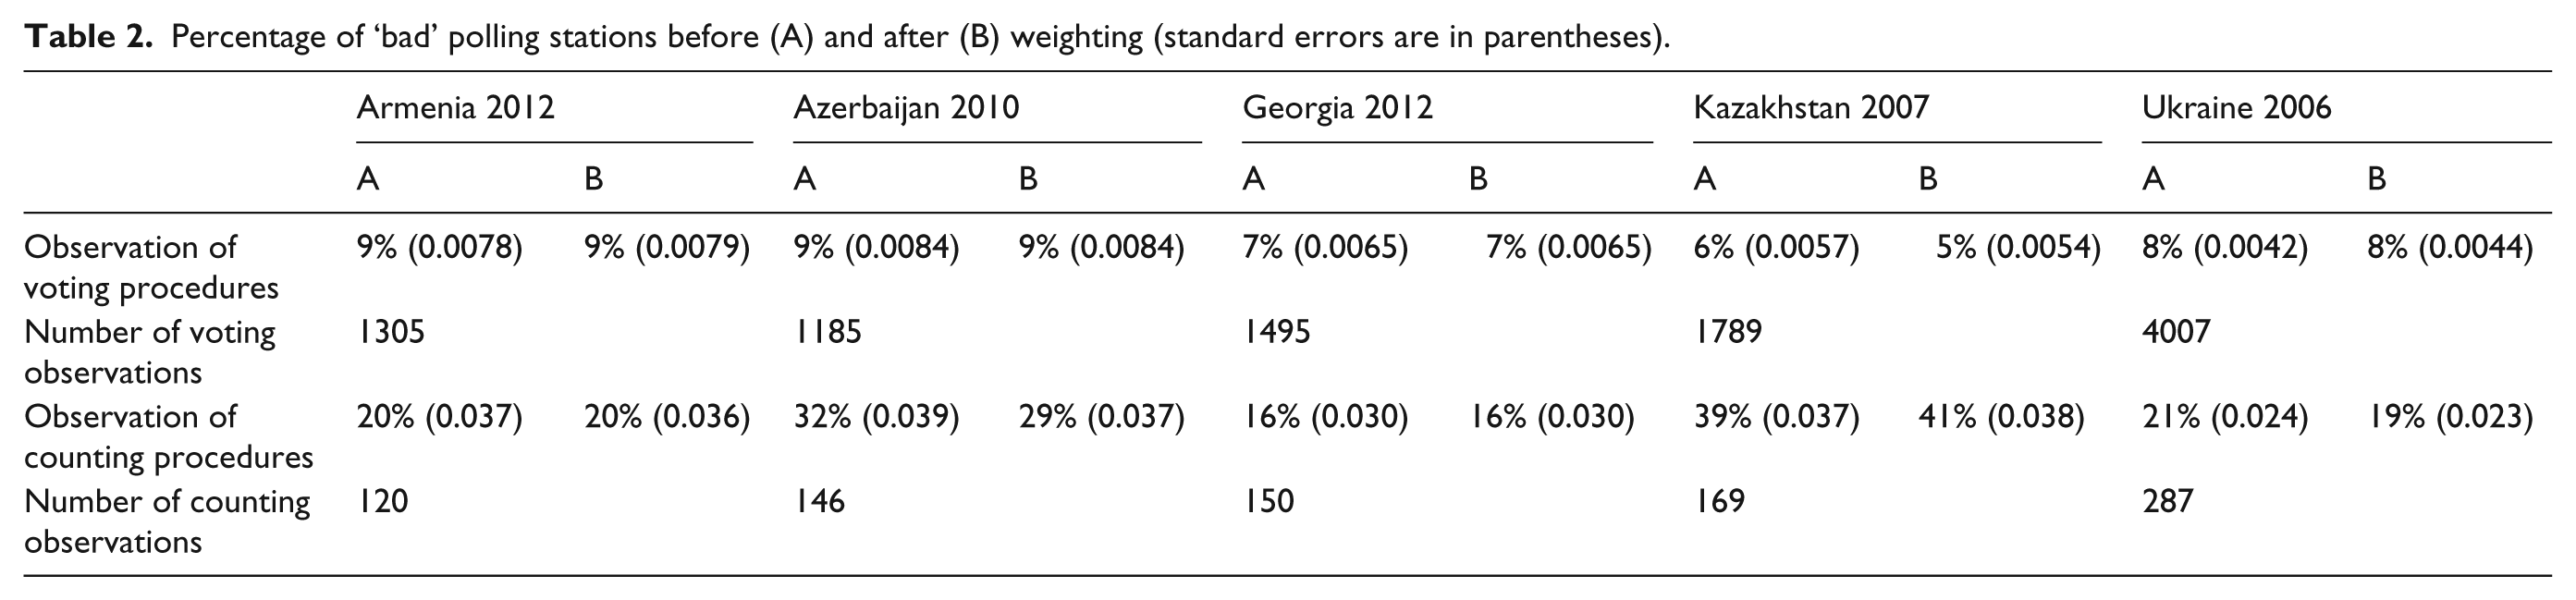
The share of ‘bad’ polling stations changes by one percentage point at most with regard to the observations of voting procedures. The changes in percentages of ‘bad’ polling stations tend to be greater in the case of the observation of counting procedures, but, due to the relatively small number of observations of counting procedures, these changes are not significant at 95% confidence intervals.
Conclusion
An OSCE EOM has the characteristics of a social survey that seeks to establish generalizable findings from a sample. It is problematic, then, that the samples of polling stations that are visited as part of EOMs suffer from significant selection bias. Three different choices made by different groups of people involved in OSCE EOMs contribute to selection bias. We have demonstrated that, when information about the location of individual polling stations is available, it is possible to provide estimates of the percentage of polling stations with a negative overall assessment in the absence of selection bias through a weighting procedure. These estimates give us an idea about whether, in the case of a perfect sample, the number of ‘bad’ polling stations would have been lower or higher than the number of ‘bad’ polling stations that were actually reported by observers. The results, based on data from diverse EOMs conducted in the OSCE region, suggest that, while there is a strong degree of selection bias, the selection bias does not significantly impact the overall percentage of ‘bad’ polling stations that is reported by the EOM. Data from the EOMs on the percentage of ‘bad’ polling stations, therefore, likely give a credible picture of the quality of the electoral process.
Weighting the data, however, does not remove the problem of selection bias, as there is still a risk that some of the findings in the EOM are distorted. Next to the percentage of polling stations with an overall negative or positive assessment from observers, the EOMs also collect data on the prevalence of specific irregularities in the voting and counting process. It may be that some irregularities are especially prevalent in particular regions. Moreover, EOM findings are likely to be less reliable in cases with an even greater extent of selection bias, and in countries with greater differences across regions and districts, and between urban and rural polling stations, than in the cases presented here. The simplest way to eliminate selection bias in election observation would be through random assignment of the polling stations that are visited by observers. There are, however, strong arguments, related to logistical difficulties, against random assignment in international election observation. Alternatively, constructing more balanced deployment plans, based on proportionality of the number of observers to the number of polling stations in regions and districts, can be done where information about the geographical dispersion of polling stations is available. By constructing more balanced deployment plans, selection bias in international election observation can be greatly reduced at little cost. For the OSCE and other organizations involved in international election observation, limiting selection bias will increase the credibility of their efforts and produce more valuable data.
Footnotes
Declaration of conflicting interest
The authors declare that there is no conflict of interest.
Funding
This research received no specific grant from any funding agency in the public, commercial or not-for-profit sectors.