
Abstract
International election observation has been scrutinized over the past two decades by scholars trying to explain its aim, scope, and consequences. As it is now a standard practice in democratizing countries, scholarly literature has almost reached a consensus on the ability of observers to deter election-day fraud, one of the most positive unintended consequences of election observation. Using data from the 2004 Ukraine presidential election, this article extends our knowledge through a natural experiment on polling station-level election results. I will show that observation during counting does not have a stronger effect than observation during opening and/or polling. Results support previous studies showing the usefulness of election observation in reducing election-day fraud but add an important finding that deserves further scholarly attention.
Introduction
The study of election observation is part of the very large field of study on international democracy promotion and assistance. Election observation is only one of the many forms of international actors’ involvement in domestic politics, which has been found to be one of the driving factors of (attempted or successful) political transitions. Its importance is underlined by the literature on electoral integrity. Currently, countries seeking international aid are often asked to meet international minimum standards of free and fair elections to access funds. 1 Given the rising importance of international engagement in democratization processes and the relevance of elections for democracy, research on election observation has flourished over the past fifteen years. Among its other aims, this research has sought to understand the ability of electoral observers (EOs) to detect and deter fraud and thus contribute to democracy promotion. This article bears out previous findings regarding the usefulness of election observation in reducing election-day fraud but increases our knowledge by showing that observation during counting does not have a stronger effect than observation during opening and/or polling.
Today, international observers monitor most elections in developing democracies. 2 Researchers have explained why election observation has become a standard practice in emerging democracies, though doubts have been cast on EOs’ ability to accurately judge the freedom and fairness of an electoral process. 3 Empirical research examining the effects of election observation has been accumulating for more than a decade. 4 Over and above assessing whether an electoral process has been free and fair and which dimensions of the process need improvement, scholars often claim observers can enhance the legitimacy of the election they monitor 5 by (1) boosting confidence in the electoral process 6 and thus (2) increasing voter turnout, 7 (3) increasing opposition parties’ participation 8 and (4) reducing the probability of opposition party boycott, 9 (5) decreasing the level of post-election violence, 10 and, finally, (6) raising the quality of elections by reducing fraud. 11
The capacity of EOs to have an impact on fraud is still debated. Some scholars have claimed that Election Observation Missions (EOMs) may have the unintended consequence of inadvertently encouraging innovations in cheating strategies 12 or, more simply, of helping consolidate authoritarianism by enabling autocrats’ propaganda that they are interested in and are making progress toward democratization. 13 However, the literature showing that EOs can both detect and deter fraud seems to prevail. Hyde 14 was the first scholar to try, with a natural experiment, to test EOs’ fraud-reduction effect. She analyzed the 2003 presidential elections in Armenia and found that election observation significantly reduced election-day fraud. She observed similar results in a randomized experiment in Indonesia. 15 Parallel to these findings, Ichino and Schündeln 16 report that voter registration fraud in Ghana was displaced from districts where EOs were present to districts where they were not. Enikolopov et al., 17 using an experimental design on Moscow polling station (PS) election results in the 2011 parliamentary elections, found that the presence of domestic EOs had a significant effect on turnout and the ruling party’s vote share. By contrast, Buzin et al. 18 analyzed the same elections in twenty-one Russian cities but found little effect. Those conflicting results could be the effect of the different samples used in the experiments. This article overcomes the sampling problem by analyzing the entire population of PSs in the 2004 Ukrainian presidential election.
Building on this stream of research, and using data from the 2004 Ukrainian presidential election, this study extends our knowledge through a natural experiment on PS-level election results to determine whether the fraud-reduction effect of observation is most effective during the day (opening and/or polling phase) or at night, during the counting phase. I will focus on a sub-set of fraud, election-day fraud, the kind of fraudulent behavior EOs work most zealously to detect and deter. By election-day fraud, we usually mean those behaviors taking place in and around PSs that can unduly influence election results through various types of misconduct: preventing voters or groups from voting, ballot box stuffing, voter intimidation, voter impersonation, manipulating the count of votes, and so on. 19 Findings improve existing knowledge not only by adding new evidence on the deterrent effect of election observation but also by estimating when observers are most effective in reducing election-day fraud.
Research Design
Election-day frauds come in a variety of forms: from voter intimidation to ballot box stuffing, from voter impersonation to misrecording of votes. 20 However, all these types of misconduct share the goal of increasing the vote share of the cheating candidate(s)/ party(ies). 21 Hypothesizing that the physical presence of EOs inside and around PSs may influence the behavior of internal political actors, some scholars have verified that EOs are able to discover and deter election-day fraud. 22
EOs can visit a PS during the opening phase, when the polling staff is setting up the PS and preparing ballots; during the polling phase, when the PS is open and citizens can cast their votes; and/or during counting, when votes are counted and tabulated. While the cited literature has shown that EOs have a fraud-deterrence effect on the PSs they visit, 23 no one has ever determined whether the effect differs according to when the PS is observed. Is observation during counting, the most sensitive phase, more effective than observation during opening and/or polling? Answering this question can have important policy implications in enabling international organizations to decide how to best allocate their resources, for example, by decreasing observers’ presence in the first phase to have more resources in the counting phase.
The model involves a dependent variable, the percentage vote share for the fraud-sponsoring candidate(s) or party(ies), 24 and an independent variable, the treatment, with three values: not observed, observed during opening and/or polling, observed during counting. 25 By comparing election results of PSs observed during the day (opening and/or polling), of PSs observed during the night (counting), and unobserved PSs, we can evaluate when the effect of EOs is stronger:
Actually, we can hypothesize that PS officials stop rigging the election in front of EOs, but then go on with their fraudulent conduct immediately after observers leave the PS. This is why the effect of observation during counting, when observers must follow the entire process only in one PS, can be stronger than the effect of observation during opening and polling. Moreover, a stronger effect of observation during counting may be due to the fact that the failure to make transparent and detailed tabulations of election results available, as often occurs in electoral autocracies and in democratizing countries, and as actually happened in the case under study, enables the insiders to change the election outcome by simpler acts, such as rigging the registers and altering the results, without having to resort to, for example, large-scale intimidation or ballot stuffing. In our case, the OSCE/ODIHR reported that the selection of PS officials strongly favored Yanukovych, to the point that hundreds of PS members appointed by the opposition were dismissed on the eve of the first and second election rounds. 26 Moreover, the law did not ensure the transparent tabulation of election results: the Central Election Commission was not required to publish all PSs’ results either on its website or in the official gazette. This control over the election administration and the lack of transparency regarding results could make it easier to cheat in the counting phase without the risks entailed by large-scale operations involving the voters.
Using a quasi-experimental research design can give us an initial estimate of whether the presence of EOs causes a reduction in election-day fraud by solving the problem of causal inference. The research design can be considered a natural experiment because it involves a three-level independent variable (whether and when the PS was observed), which is the “treatment” variable and is assigned “as if” it were random (see section “Randomization” for details). For the case study analyzed in this article, the 2004 Ukrainian presidential elections, the OSCE/ODIHR Final Report 27 demonstrates that observers were able to witness and report on many kinds of electoral irregularities and election-day fraud. Concentrating this micro-level analysis (i.e., this strategy of PS-level comparison) within a single country strengthens the ceteris paribus clause; this research design, in fact, allows the researcher to automatically control for country-specific variables. This would not be possible in cross-sectional studies because of endogeneity problems. 28
Since the three groups of treatment (PSs not visited, PSs visited during opening and/or polling, and PSs visited during counting) have unequal numerosity and unequal variance, I cannot perform a simple analysis of variance (ANOVA) model but must resort to an ordinary least squares (OLS) regression with robust standard errors (SEs), and then perform Bonferroni multiple comparison tests comparing the three groups of observations (PSs not visited by OSCE/ODIHR observers vs PSs visited by OSCE/ODIHR observers during opening and/or polling vs PSs visited by OSCE/ODIHR observers during counting) and testing the hypothesis that the means of the three groups (two by two) are the same. 29 If our hypothesis is correct—that is, if observers have a stronger deterrent effect on fraud during counting than during opening and/or polling—then, holding all else constant, their presence during counting should decrease the vote share for the fraud-sponsoring candidate more than during opening and/or polling.
In this specific case, the OLS model is not meant to predict the vote share for the fraud-sponsoring candidate (the article is not trying to find the determinant of Yanukovych’s electoral results, which are numerous and rooted in the political, geo-political, economic, and cultural history of Ukraine), but more simply to verify whether Yanukovych’s vote share was systematically lower in PSs observed by OSCE/ODIHR (and even lower in PSs observed during counting). Since the nature of the data (the groups have unequal numerosity and unequal variance) does not make it possible to perform an ANOVA model, I must use OLS with post-estimation tests (OLS with categorical regressors is in fact equivalent to the factors in ANOVA). The results are identical, but the ANOVA is not robust to heteroscedasticity in the case of groups with different numerosity. In this design, the results to look at are the post-estimation pairwise comparisons, 30 which indicate whether the difference among the means of the three groups can be considered significant.
The model involves a dependent variable (Yanukovych’s vote share) and an independent variable (whether and when the PS was observed). The treatment—that is, the assignment of international observers to (“as if”) randomly selected PSs—ensures the ceteris paribus clause. However, a serious problem for the quasi-experimental design may arise if a third variable is related to both the outcome (Yanukovych’s vote share) and the treatment (observation). More concretely, if, for example, I find a statistically significant difference in Yanukovych’s average vote share between observed and unobserved PSs, and all observed PSs are located in the west of the country, where Yanukovych garnered a lower vote share independently from observation (for political reasons), the mean difference that I find can be the result of an unbalanced (nonrandom) treatment distribution, with all observers observing only PSs in the west of the country. Randomization is therefore crucial. I will show that the treatment could be considered near random (section “Randomization”) but, to strengthen my results, I will also replicate the analysis in eight sub-groups of PSs formed by considering four possible variables that could be related to both the outcome variable and the treatment. If the mean difference I find in general (i.e., considering the entire country) is also present in those sub-populations, I can be more confident that my results are not driven by a bad random distribution of the treatment (see section “Randomization” for details).
Finally, data were collected from three main sources: the dependent variable (vote share) was downloaded from the Central Election Commission website (http://www.cvk.gov.ua/); the independent variable (whether and when the PS was observed), was provided to me by the OSCE/ODIHR under a confidentiality agreement; and the control variables are drawn from the 2001 Ukrainian census (http://www.ukrcensus.gov.ua/) or from the Central Election Commission website.
The Ukrainian Case
In 2004, the incumbent President of the Republic, Leonid Kuchma, had already served two terms and could not run again due to constitutional term limits. He thus endorsed Viktor Yanukovych, the incumbent Prime Minister. Yanukovych, the leader of the Party of Regions, who was also well liked by the Russian Federation, ran against twenty-four candidates, among whom the clear favorite in the pre-election polls was Viktor Yushchenko, former Prime Minister and leader of the “Our Ukraine” parliamentary group. One of the Yushchenko campaign platform talking points was the idea of turning Ukraine’s attention westward with the aim of joining the European Union. Before the election, Yushchenko and Yulia Tymoshenko signed an electoral agreement that envisaged Tymoshenko’s support for Yushchenko in the second round in exchange for her being nominated Prime Minister if Yushchenko won the presidential election.
As EOs could note, the election was held in a largely unfree atmosphere, with the incumbent authorities using their control of the government and state apparatus to intimidate Yushchenko (who was also poisoned) and his supporters. 31
During the first round, on 31 October, neither Yanukovych nor Yushchenko reached 50 percent of the votes, both taking about 39 percent. A second round was thus to be held on 21 November. Even though the first round was marred by fraud and irregularities in favor of Yanukovych, complaints were not actively pursued because it was clear that challenging the first-round results would not have prevented the runoff. The results of the second round gave Yanukovych the Presidency by a slim margin (about 3 percentage points). Yushchenko presented evidence of electoral fraud and, thanks in part to the preliminary findings of domestic and foreign observers who backed him, massive peaceful protests started in several cities across Ukraine the day after the election. After ten days of protests, which were later dubbed “the Orange Revolution,” the Supreme Court of Ukraine invalidated the official results on 3 December, stating that the scale of electoral fraud was such as to make it impossible to establish the results of the election with certainty. The Court ordered a revote of the second round on 26 December, which gave Yushchenko the presidency by about 8 percentage points.
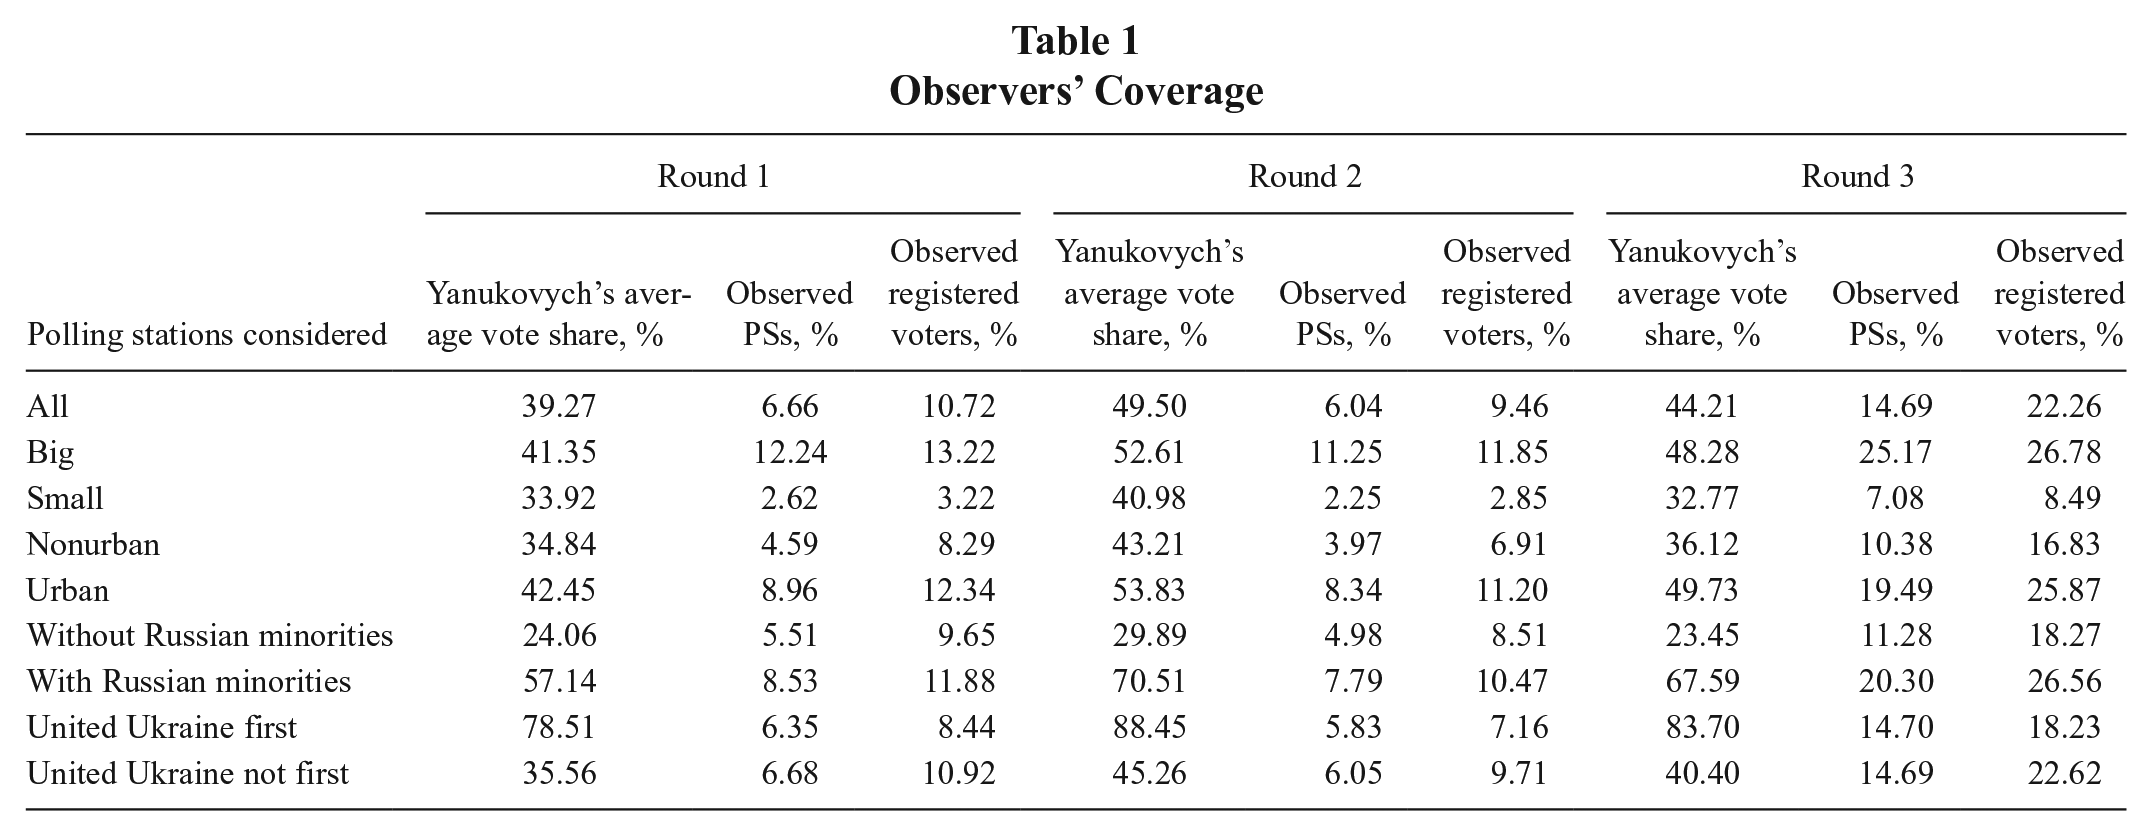
The 2004 Ukrainian presidential election is an excellent case study for testing our hypothesis. First, there was a widespread presence of observers: OSCE/ODIHR sent its largest mission in its history. 32 OSCE/ODIHR EOs submitted 2,578 reports during the first round (including 187 during counting), 2,489 during the second round (145 during counting), and 5,920 during the repeated second round (425 during counting). They visited more than 6 percent of the PSs in the country during the first and second rounds, reaching 14.7 percent during the repeated second round (see Table 1). This high number of “treated” cases increases the power of the analysis. Second, EOs were assigned to PSs in a way that approximates randomization, thus permitting the use of a natural experimental design. Third, the Ukrainian Central Election Commission made disaggregated, PS-level election results available on its website for all three rounds. Finally, and more importantly, one candidate, Yanukovych, orchestrated widespread fraud on election day, which EOs were able to witness and report on.
Observers’ Coverage
Randomization
An experimental design requires randomization. When, as is more frequent in the social sciences, we deal with a natural experiment, the researcher should show that the treatment can be considered near random. The deployment methodology used by international organizations such as the OSCE/ODIHR guarantees that the assignment of EOs to PSs around the host country is highly unlikely to be systematically different from a pure randomization. As shown by Bader and Schmeets, 33 EOs do not have information about PS attributes related to voting patterns that can drive the choice of PSs to visit. 34 Moreover, the Organization tries its best to guarantee that there are no geographic or other kinds of bias in the distribution of observers to PSs. Each short-term team is given a deployment area inside which it can decide how to carry out its work: EOs can visit as many PSs as they deem appropriate, they can stay in a single PS as long as they gauge necessary for a thoughtful judgment, and they can return to a PS that has already been visited if they believe it necessary. This freedom helps in keeping deployment plans confidential. Moreover, international organizations discourage short-term observers from choosing PSs that are either “convenient” (visiting areas near the observers’ hotels or near tourist destinations) or “interesting” (visiting areas in which fraud or other problems are expected). 35 In fact, choosing PSs that are problematic or convenient can cripple randomization because the fraudulent candidate/party may predict these choices and concentrate its efforts to cheat in other places, where it expects observers would be less likely to go. 36
That said, it is still up to the researcher to demonstrate that the treatment does not show evidence of bias. In this case, the ideal covariate to test for balance between the treatment and control groups would be a measure of the candidates’ likely vote share, such as public opinion polling. However, no such data exist at the PS level. Therefore, I adopt two strategies: First, I analyze some aspects that are usually thought to be related to observers’ behaviors (such as observing PSs near the biggest cities or that are easy to reach) or to voting patterns (such as the geographical concentration of support for a candidate). Then, to parametrize the possible impact (bias) of those factors on the results of the natural experiment, I repeat the baseline analysis in each sub-group formed by those factors to strengthen my results.
As shown in Table 1, observers visited 6.7 percent of PSs in the first round (R1), 6 percent in the second (R2) and 14.7 percent in the repeated second (R3). Those percentages corresponded to 10.7 percent of eligible voters in R1, 9.5 percent in R2, and 22.3 percent in R3. The assignment of EOs to PSs could be said to approximate randomization if there were no geographical or other biases related to Yanukovych’s and/or Yushchenko’s vote distribution. Conversely, the assignment of the treatment could not be considered near random. I took two factors that can be related to observers’ behaviors and two factors related to voting patterns into consideration (see Table 1 for figures):
Big vs. small PSs: If observers prefer to visit big PSs (with more registered voters than the mean), perhaps because they are easier to reach, and if big PSs systematically support a particular candidate, the mean difference can be the result of systematic differences between PSs of different size. In the case under analysis, Yanukovych’s vote share was higher in big PSs, where EOs monitored higher percentages of PSs (and of registered voters, see Table 1). So the bias, if any, would lead us to conclude for the absence of an observers’ effect. If we still find a significant difference, it means that difference would have been even stronger if EOs were evenly distributed among big and small PSs.
Urban vs. nonurban PSs: The ratio is the same. If, for example, the cheating candidate performs very well in rural areas and the sample of visited PSs overrepresents urban PSs, then the candidate’s disproportionate support in rural areas can bias our results, showing a significant mean difference that is due to the urban/rural divide and not to the presence of observers. I therefore divided the population of PSs into two groups: one consisted of PSs located in urban areas with more than fifty thousand inhabitants; all the other PSs were considered nonurban. Yanukovych performed better in urban PSs, which were overrepresented among the monitored PSs. So, as before, the bias, if any, would lead us to conclude for the absence of an observers’ effect. If we still find a significant difference, it means that difference would have been stronger if EOs were evenly distributed among urban and nonurban PSs.
The presence of sizable Russian minorities: The population of PSs was divided into two groups: those located in regions with more Russian native speakers than the national mean (17.3% at that time) and those located in regions with up to 17.3 percent of Russian minorities. In Ukraine, Russian minorities were found mainly in eastern and southern regions. Since Yanukovych’s campaign platform included making Russian Ukraine’s second state language, it is highly probable that he “naturally” (i.e., without fraud) received particularly strong electoral support in regions with sizeable Russian minorities. If a high proportion of observed PSs (or of PSs observed during counting) were situated in the west of Ukraine, the results of the mean difference could reflect this biased distribution more than an “observers’ effect.” Actually, this was not the case, with the higher percentages of observed PSs (and registered voters) in regions with more Russian native speakers than the national mean. As before, this will reinforce our results in case we find a significant difference.
Yanukovych’s strongholds: PSs were divided into two groups, those located in electoral districts where the Party of Regions, part of the “For United Ukraine” electoral coalition, was the party with the relative majority in the 2002 parliamentary elections and those where it was not. 37 The logic is the same: If a high proportion of observed PSs were located outside Yanukovych’s strongholds, our results could be biased, showing a significant mean difference due to Yanukovych’s “natural” voter distribution more than to the presence of observers. In this case, we can see that EOs monitored about 6.4 percent of PSs inside and 6.7 percent outside Yanukovych’s strongholds in R1, 5.8 percent inside and 6.1 percent outside in R2, and 14.7 percent inside and outside in R3. The differences are minimal. As these two groups are the most similar in the treatment, it is unlikely that this variable can bias our results.
Data show that there is reason to believe that the distribution of EOs was related to Yanukovych’s vote share in a way that would bias our results and cause us to commit a type I error (finding a significant relationship when in fact there is none). By contrast, we would more easily fail to see an “observers’ effect” when there is one (type II error). This is an important indicator of the validity and reliability of this research design’s results.
However, as a second strategy to ensure against biased results, I will run the analysis in the eight sub-groups formed by the four variables mentioned above. This will make it possible to control for the four variables that may influence our results if they are related to voting patterns.
Tests and Results
Ukraine was divided into 33,101 PSs in the first round; 33,077 in the second; and 33,059 in the repeated second. OSCE/ODIHR observers visited 2,203 of these PSs during the first round; 1,998 during the second round; and 4,856 during the repeated second round. 38 We must therefore consider three rounds of treatment (the independent variable, i.e., whether and when the PS was observed) and a separate voting distribution (the dependent variable) for each round. Consequently, the statistical population of the PS-level results can be divided into three experimental groups in each round, according to the treatment:
Considering round-one (R1) vote share, PSs not observed, PSs observed during opening and/or polling, and PSs observed during counting.
Considering round-two (R2) vote share, PSs not observed, PSs observed during opening and/or polling, and PSs observed during counting.
Considering the repeated second-round (R3) vote share, PSs not observed, PSs observed during opening and/or polling, and PSs observed during counting.
The analysis involves three different tests, each in nine subgroups, for a total of twenty-seven tests. 39
Tests Using First-Round Vote Share
The statistical analysis involves an OLS regression with robust SE and Bonferroni multiple comparison tests. If visiting a PS during counting has a stronger effect in reducing election-day fraud than the presence of observers during opening and/or polling, we should find a significantly lower percentage of votes in favor of the cheating candidate in PSs observed during counting, followed by PSs observed during opening and/or polling, followed by PSs that were not observed, our control group.
Model results and multiple comparison tests comparing treatment and control groups performed using round-one vote share are shown in Table 2. Column one (“Polling stations considered”) specifies the groups of PSs to which the tests are applied: all PSs (“All”), PSs where registered voters are above or below the mean (“Big” or “Small”), PSs located in urban or nonurban areas (“Nonurban” or “Urban”), PSs in regions with or without significant Russian minorities (“Without Russian minorities” or “With Russian minorities”), and PSs located in electoral districts where the “For United Ukraine” electoral coalition was the first party in the 2002 parliamentary elections. Columns 2–4 indicate Yanukovych’s average vote share in the three experimental groups (not observed, observed during opening and/or polling, and observed during counting). Columns 5–7 report information about the model (F value with its significance level, degrees of freedom, and number of observations). Finally, columns 8–10 report the results of the Bonferroni multiple comparison tests, that is, the mean difference between the percentages of the two subgroups considered in each test with its p value.
Ordinary Least Squares (OLS) Regression with Robust Standard Error (SE) and Bonferroni Multiple Comparison Test Using Yanukovych’s First-Round Vote Share
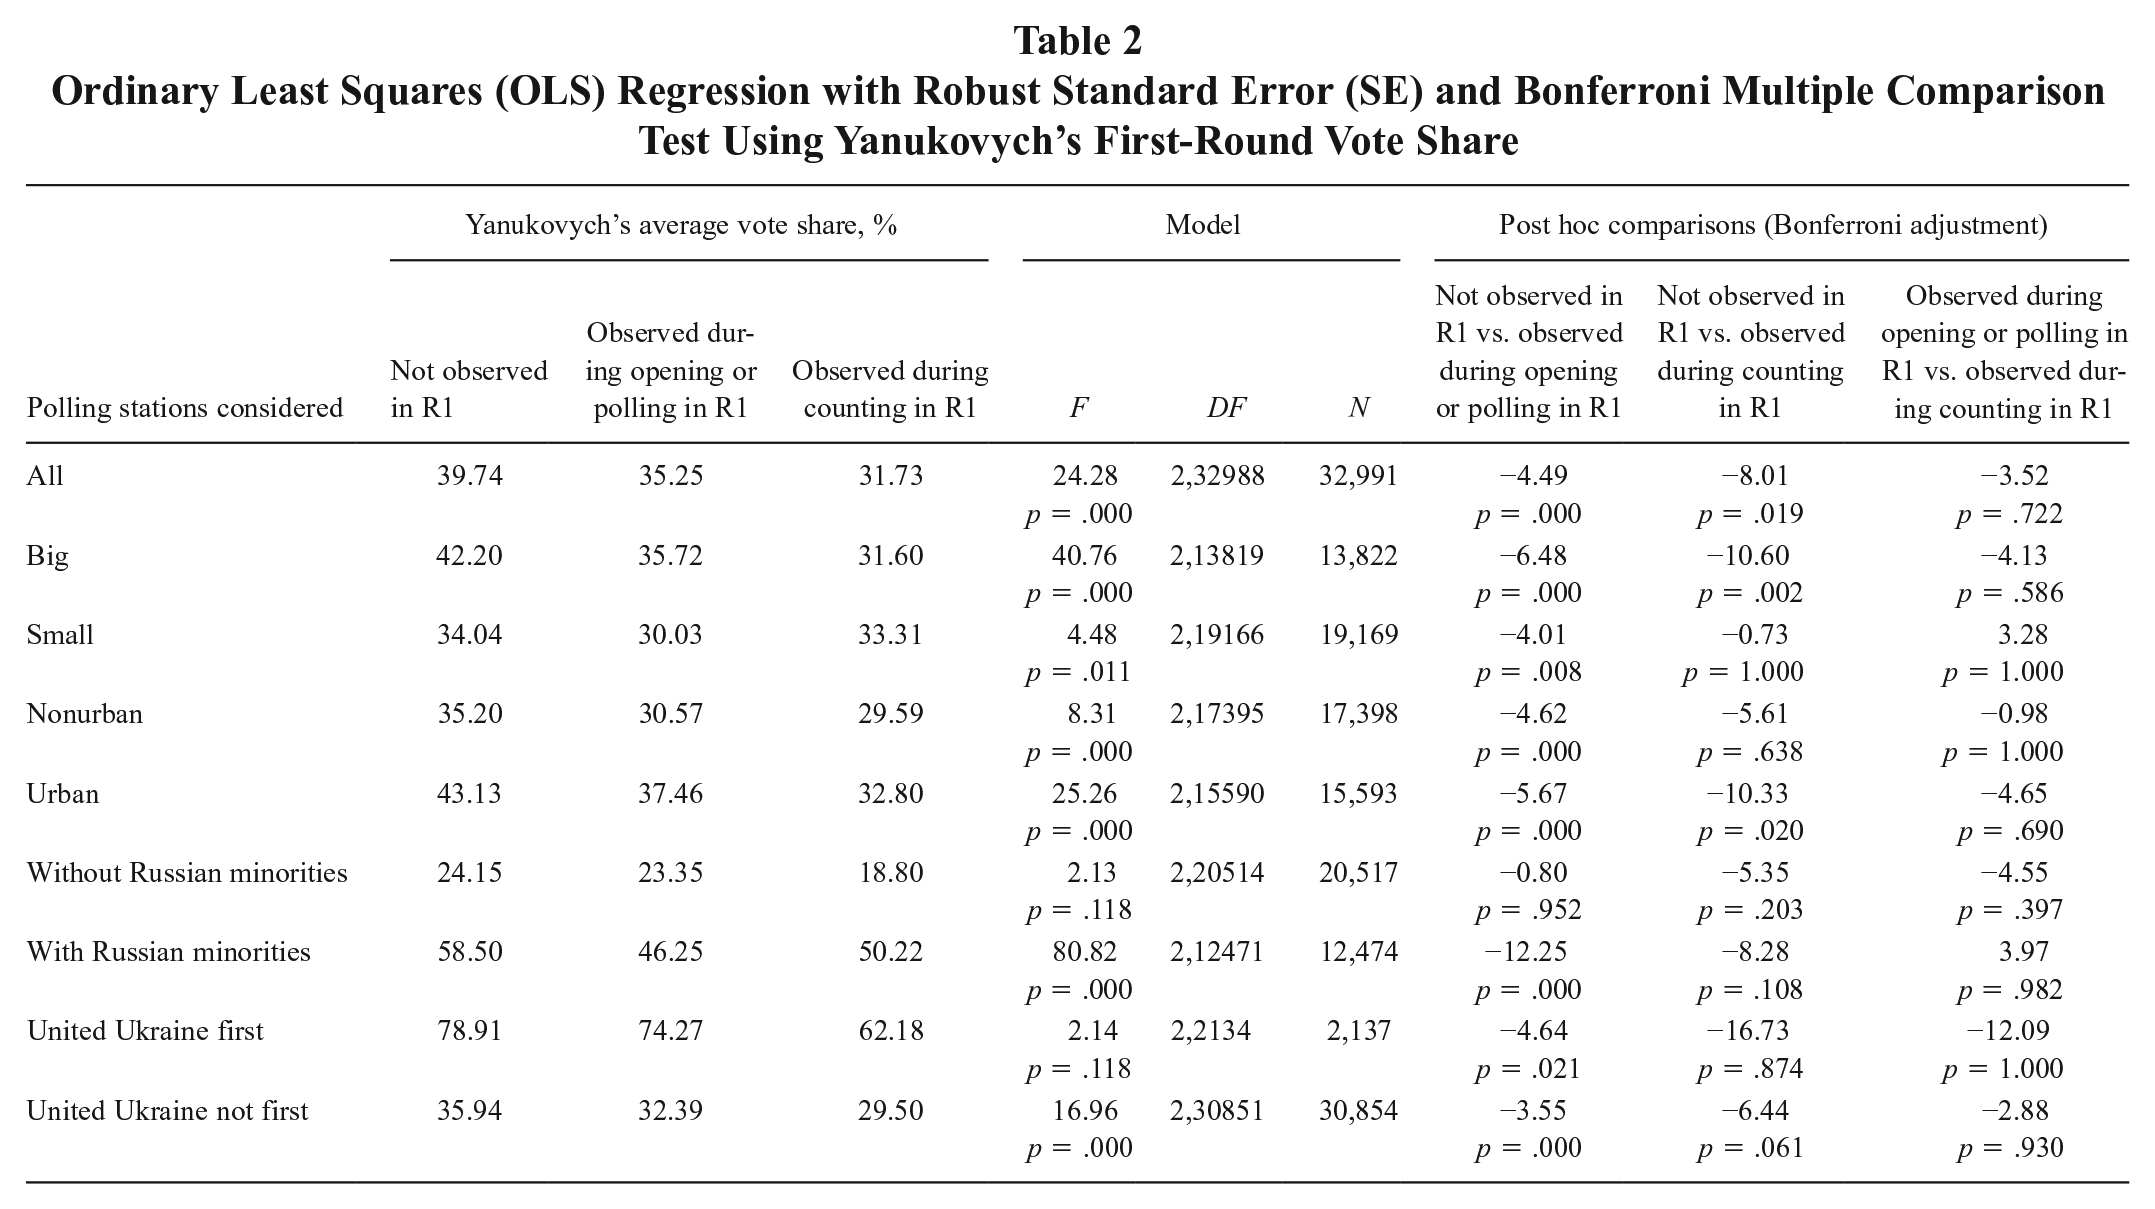
We can see from the evidence presented in Table 2 that the presence of EOs during opening and/or polling reduced the vote share for the fraud-sponsoring candidate in the first round by an average of about 4.5 percentage points. This result is statistically significant at the 1 percent confidence level, allowing us to reject the null hypothesis that there is no difference between unobserved PSs and PSs observed during opening and/or polling. The fraud-reduction effect is even stronger during counting (−8.0 pp compared to unobserved PSs, significant at the 5% level), but the difference between PSs observed during opening/polling and PSs observed during counting is not significant.
Controlling for PSs’ size, for the urban–rural divide, for the presence of Russian minorities, and for the results of the 2002 parliamentary election, we find support for our hypothesis, with Yanukovych’s vote share in observed PSs always lower than in unobserved ones. The difference is, however, never significant in PSs situated in regions without sizable Russian minorities. The explanation is straightforward: those regions were the ones where the opposition candidate, Yushchenko, was stronger. In those regions, mainly located in the north and west of the country, citizens (and therefore also PS officials) did not widely support Yanukovych, thus reducing his opportunities for rigging the election. This was also confirmed by the findings of OSCE/ODIHR observers, who reported more irregularities in eastern and southern regions. 40 Table 2 also shows that the difference between observation during opening and/or polling and observation during counting is never significant, and the difference between PSs observed during counting and unobserved PSs is significant only for big and urban PSs. To further support our findings, we can note that the mean difference is larger in big and urban PSs, where Yanukovych performed better, than in small and nonurban ones. Results can be biased if the fraud-sponsoring candidate enjoyed stronger electoral support in unobserved PSs. In our case, on the contrary, Yanukovych’s performance in unobserved small (34.04%) and big (42.20%) PSs and in nonurban (35.20%) and urban (43.13%) PSs shows that he performed better in big and urban PSs than in small and nonurban ones, exactly where the number of observed PSs was higher. This strengthens our findings and makes biased results less likely.
Tests Using Second-Round Vote Share
In Table 3, we compare the second-round vote share between PSs that were not observed, observed during opening and/or polling, and observed during counting. As before, we expect that the fraud-sponsoring candidate performed worse in observed PSs, and even worse in PSs observed during counting.
Ordinary Least Squares (OLS) Regression with Robust Standard Error (SE) and Bonferroni Multiple Comparison Test Using Yanukovych’s Second-Round Vote Share
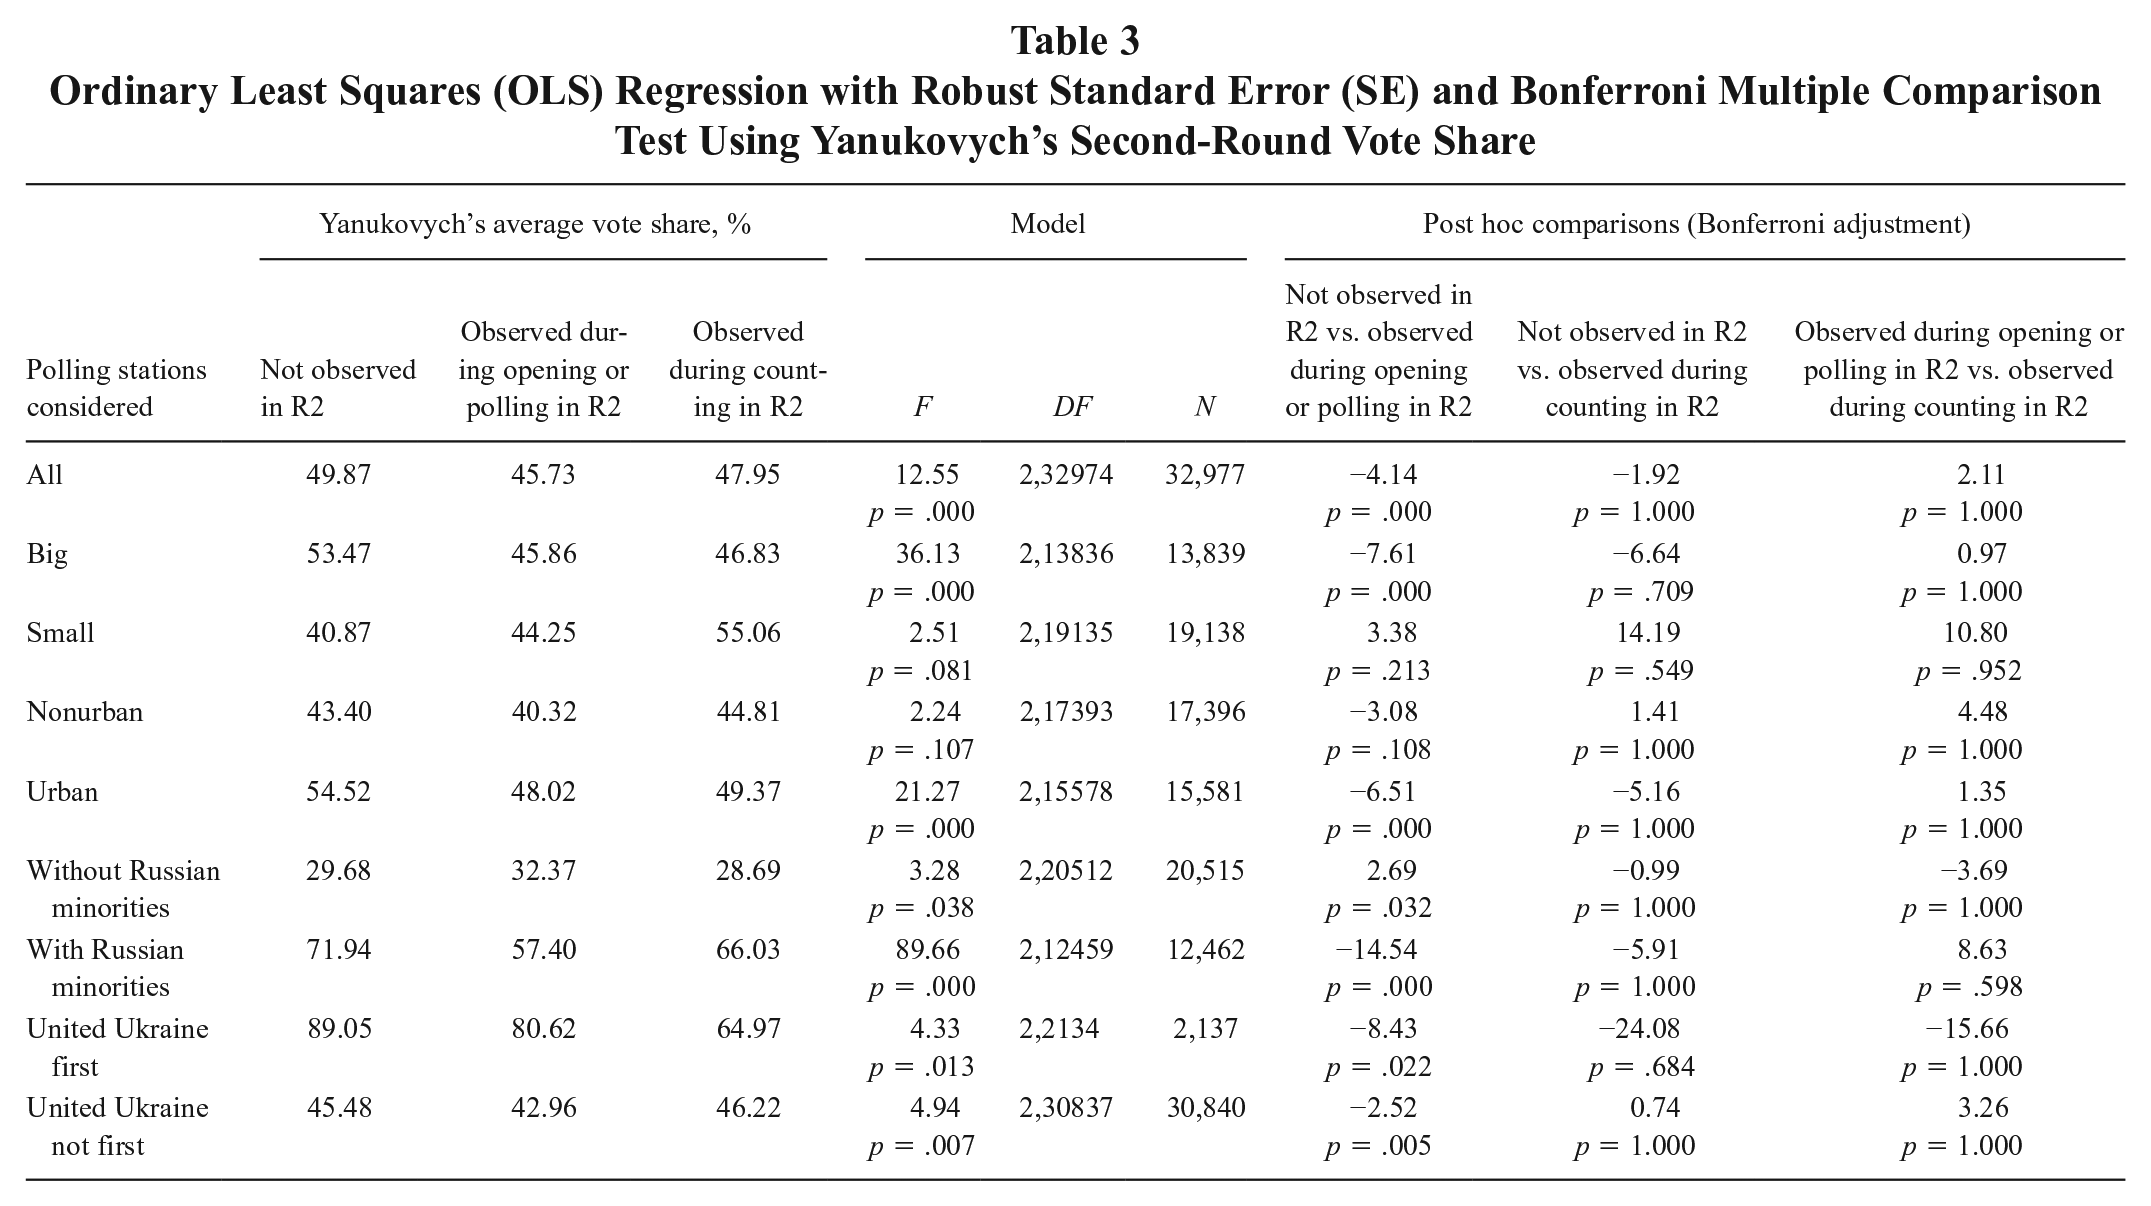
Table 3 confirms that the presence of observers reduced Yanukovych’s vote share during opening and/or polling. The fraud-reduction effect was not significant in small and nonurban PSs. As mentioned above, these results do not disconfirm the overall fraud-reduction effect of election observation since those were the groups of PSs where the opposition candidate was stronger (we can see from Table 3 that Yanukovych’s vote share was larger in big and urban PSs). However, the difference is not statistically significant (and in some cases, it goes in the opposite direction) in PSs observed during counting. Finally, in no case was the difference among the two observation phases (opening/polling vs counting) statistically significant.
Tests Using Repeated Second-Round Vote Share
The repeated second round was held under the authority of a newly appointed Central Election Commission, and OSCE/ODHIR observers reported a more efficient and transparent administration of the electoral process. However, while observers assessed the process much more favorably than during the two previous rounds, they found a clear regional variation, with northern and western regions standing out for a cleaner process and southern, eastern, and central regions still marred by fraud. 41 Therefore, our analysis of the repeated second round may show that EOs had no fraud-deterrence effect simply because fraud was not present or was present at a very low level. Nevertheless, we expect the fraud-deterrence role of EOs to be still detectable in southern and eastern regions (i.e., in regions with sizable Russian minorities), where fraud persisted.
As before, we compare Yanukovych’s repeated second-round vote share between PSs that were not observed, observed during opening and/or polling, and observed during counting. If, despite the dramatic drop in election-day fraud, observers still had a deterrent effect, then we should find a lower percentage of votes for Yanukovych in observed PSs. Results presented in Table 4 show that this was not the case: EOs did not, in general, have a strong deterrent effect. Yanukovych, in fact, generally gained very similar results in observed and unobserved PSs, and the small differences are not statistically significant (significant only if we compare unobserved PSs with PSs observed during opening and/or polling). However, the difference remains quite relevant, and it is statistically significant at the 1 percent confidence level in Yanukovych strongholds (where fraud was still present): in big, urban, Russian PSs. The fraud-reduction effect of observation was still high in PSs located in the south and east of Ukraine, that is, in areas with high concentrations of Russian minorities, where fraud was still present. Impressively, Yanukovych gained 14.85 fewer percentage points in PSs observed during opening and/or polling and 9.21 in PSs observed during counting. In the other cases, the difference goes in the opposite direction and/or does not reach statistical significance. This means that, as hypothesized, EOs maintained their fraud-reduction effect only where the level of election irregularities remained high. Interestingly, the difference was positive and significant where United Ukraine was the first party in the 2002 parliamentary elections and was negative and significant where it was not. This could mean that Yanukovych’s supporters did not make concerted efforts to cheat where they expected to win.
Ordinary Least Squares (OLS) Regression with Robust Standard Error (SE) and Bonferroni Multiple Comparison Test Using Yanukovych’s Repeated Second-Round Vote Share
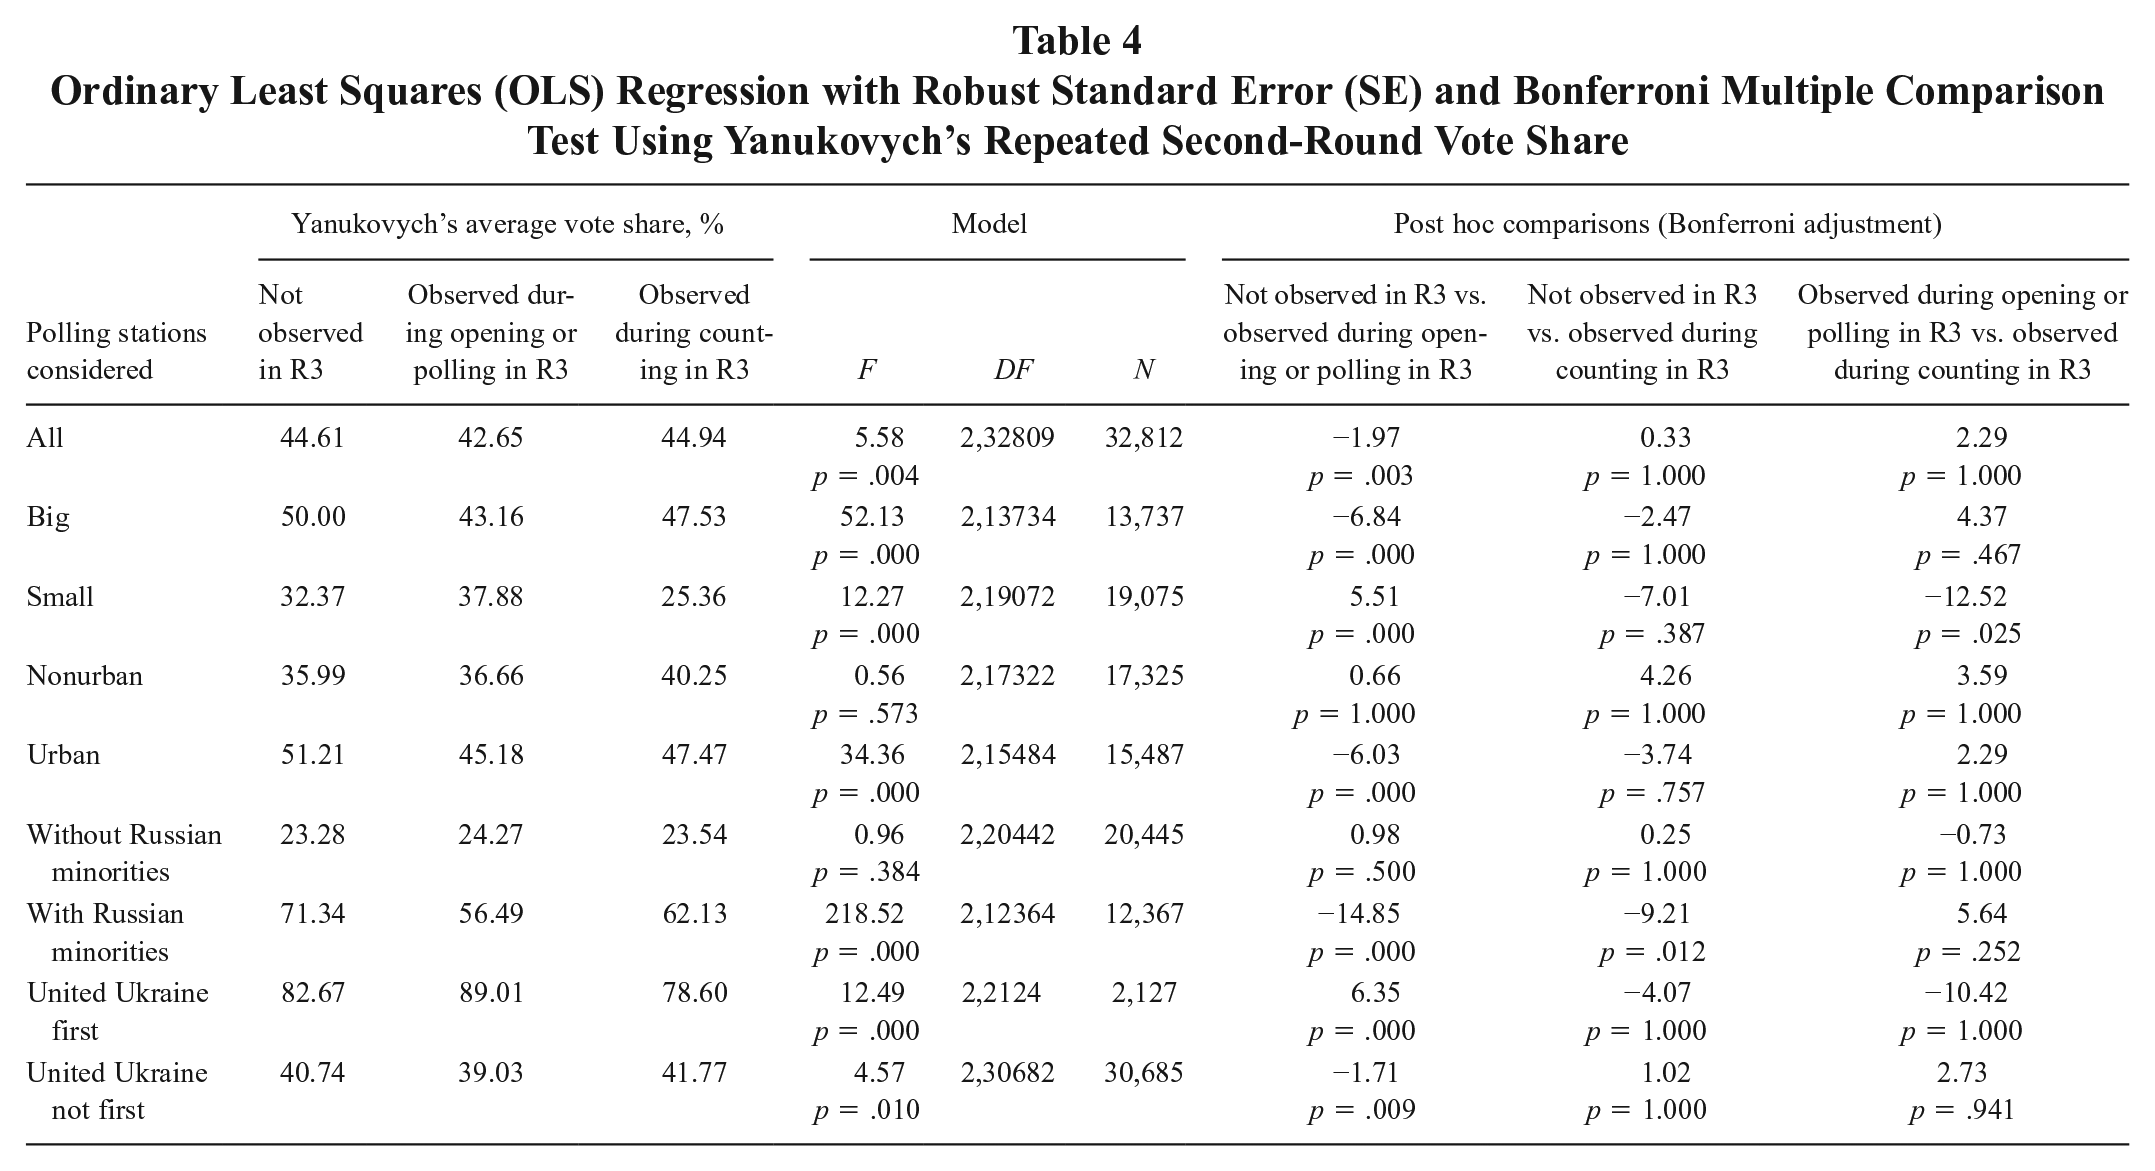
In all the cases considered, however, the difference among unobserved PSs and PSs observed during counting does not reach the significance level (apart from PSs located in the east and south of the country, where observation had a strong fraud-reduction effect). The same is true (apart from small PSs) for the difference among PSs observed during opening/polling and PSs observed during counting.
Discussion and Conclusion
This natural experiment design offered a good setting for testing whether and when EOs have a (stronger) deterrent effect on election-day fraud, providing evidence of the impact of international actors in domestic politics. Holding all else constant, Yanukovych performed significantly worse (and Yushchenko significantly better) in observed PSs, meaning that OSCE/ODIHR observers did reduce fraud at the PSs they visited. Despite the much lower level of fraud, the deterrent effect of observation was also apparent in the repeated second round. Our results thus confirmed international observation missions’ role in deterring election-day fraud (and not only in detecting it) and, consequently, the value of their presence for a better election process. However, our initial hypothesis—that observation during counting should have a stronger effect than observation during opening and/or polling—was generally disconfirmed. More specifically, test results show the following:
Generally, election observation during opening and/or polling had an immediate effect in all three rounds (significant at the 5% confidence level or less). The fraud-reduction effect was lower in the repeated second round because the level of election malpractice dramatically decreased; however, the effect of observation was present and quite strong in the south and the east of the country, where fraud was still present.
Observation during counting does not have a stronger effect than observation during opening and/or polling. The difference among Yanukovych’s vote share in PSs observed during opening and/or polling and PSs observed during counting was never significant at the 1 percent confidence level. Moreover, the difference between PSs that were never observed and PSs observed during counting was significant only in tests conducted using Yanukovych’s first-round vote share in all big and urban PSs.
Observation always showed its fraud-reduction effect where fraud was widespread, that is, in regions with sizable Russian minorities in the south and east.
By contrast with what I first hypothesized, we can postulate that observation during opening and/or polling is more efficient for two interrelated reasons. First, many types of fraud, such as ballot box stuffing, voter impersonation, voter intimidation, and so on, are perpetrated during the polling phase, 42 thus making observation during counting less effective because at least part of the fraudulent conduct has already taken place when the counting phase begins. Second, polling officials observed during the day may stop their fraudulent conduct, if any, because they fear observers can come back and report on them. The topic of “lasting effects” of observation has been treated by Hyde and by Regalia. 43 However, further research can explore this last point, for example, by looking at PSs that were visited more than once. One reason observing elections during polling is as efficient as during counting may be that people working in PSs are afraid that one visit from EOs during opening or polling can lead to a second visit during counting. More data than those available here are needed to verify this hypothesis, but, as an anonymous reviewer suggested, this can be a useful research path that can provide EOMs with further knowledge to do their job.
This article’s findings, in addition to supporting the strand of literature claiming that international actors may play a role in democratization processes, open a small but important venue for future policy-oriented research. However, the (dramatic) aftermath of Ukraine’s elections shows that reducing electoral fraud is not a sufficient condition for a deterministic process through democratic transition. It could be a necessary condition, but here again, further investigation is needed.
Obviously, it is not methodologically possible to extend our findings beyond the case considered. External validity can be proved only by adding new cases and accumulating knowledge by confirming (or disconfirming) our findings. More research is also needed on the specific question of when observation is most needed and why. One strand of research can explore whether, as Bader 44 suggests, election observation may have the unintended consequence of encouraging innovations in cheating strategies or, as Ichino and Schündeln 45 claim, of displacing fraud from districts where observers are present to districts were they are not. Finally, determining whether observation during opening and/or polling is more or less effective than observation during counting can help in understanding when the bulk of fraud occurs, and thus provide international organizations with insights into how they can make better use of their efforts in election observation.