
Abstract
The UN Sustainable Development Goals (SDGs) are the keystone policy framework for countries to achieve sustainable development. However, in fulfilling the SDGs, there is no definitive evaluation of the potential long-term outcomes upon the level, nature, and dynamics of global sustainability. This is crucial to understand, as otherwise, governments and societies may implement policies which achieve the SDGs, but are detrimental to the long-term global co-evolutionary environment-human relationship and system. Therefore, this paper determines and evaluates the potential global sustainability outcomes of the implementation of the SDGs for the specified period of 1990–2050. This is achieved by the application of the Sustainability Dynamics Framework to the results of the Earth3 model. The Earth3 model evaluated the degree of success of implementing the SDGs in respect to four development scenarios: (1) Same (business-as-usual); (2) Faster; (3) Harder and (4) Smarter. The results from the SDF application indicate that Scenario 4 (Smarter) had the best potential outcomes of the scenarios evaluated, approaching a borderline weak-strong sustainability state by the end of the specified period. The other scenarios had relatively stagnant levels of very weak sustainability. Based upon the results obtained, the broader context and implications are discussed, primarily in respect to the role and impact of the SDGs. The paper concludes by stating that humanity as a species needs to fundamentally transform its relationship with the environment, or risk being lost not only as a species, but also to the planet as well.
Keywords
Introduction
Scene-setting
The Sustainable Development Goals (SDGs) (United Nations, 2015) are the keystone policy and strategic approach for implementing sustainable development at all spatial-temporal scales. Stevens and Kanie (2016) contends that this is because they offer the opportunity to change the approaches adopted to address environmental, social, and economic challenges. As a result, the SDGs has become a dominant theme within the current sustainability literature, as highlighted in Table 1.
Examples of the current literature on the concept and implementation of the Sustainable Development Goals.
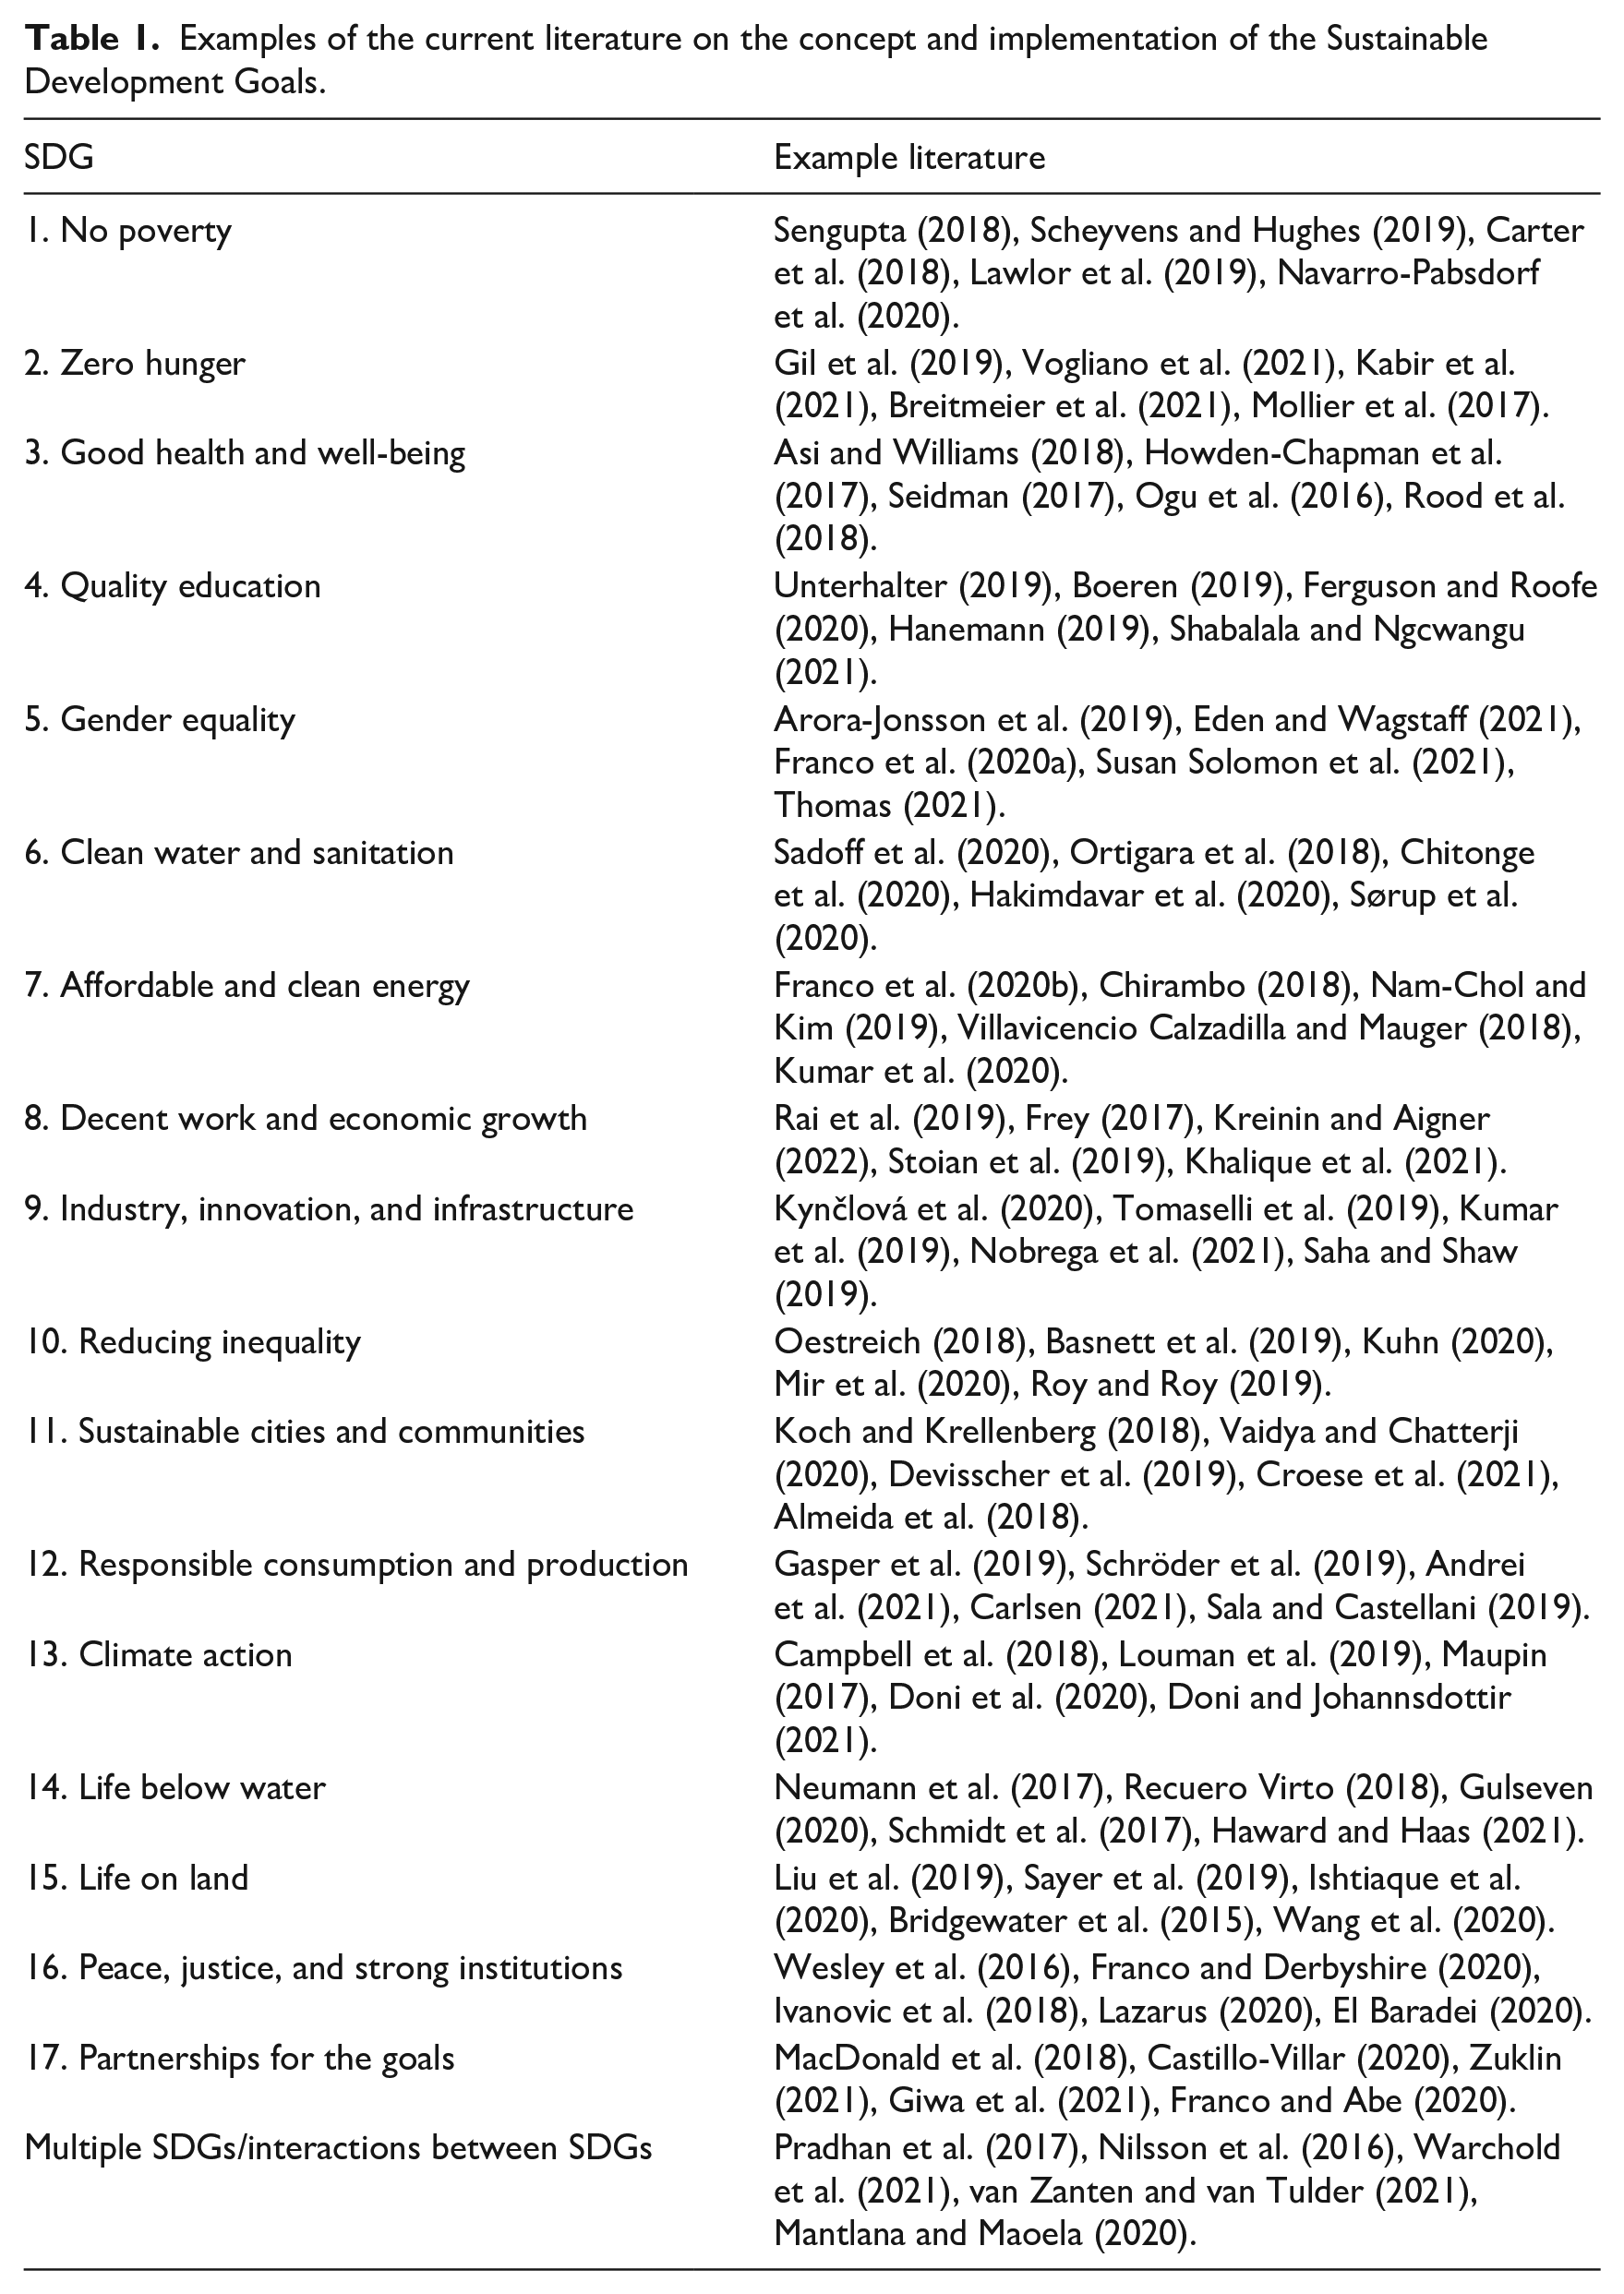
The literature has primarily focussed upon the value, effectiveness, and implementation challenges of the SDGs. However, the potential drawbacks of the SDGs framework and implementation has been raised within the literature.
Firstly, the SDGs do not monitor or measure the rate of resource use, and consequently favours economic growth over environmental integrity (Eisenmenger et al., 2020). Specifically, Eisenmenger et al. (2020) determined that there were trade-offs amongst the SDGs targets due to an in-built conflict between economic growth and sustainable resource use. This supports a fundamental criticism of the SDGs and its conceptual origins in the Brundtland report ‘Our Common Future’, (World Commission on Environment and Development (WCED), 1987) of their anthropocentrism (e.g. Bonnedahl et al., 2022; Fath, 2015; Phillips, 2021; Reid, 1995; Svirezhev and Svirejeva-Hopkins, 1998). This has led Pearce and Atkinson (1998), Randall (2020), and Wilson and Wu (2017) amongst many to argue that the potential outcome would be weak sustainability 1 occurring.
Secondly, the dynamic interactions between and within the goals and their implementation needs to be evaluated (Costanza et al., 2016; Pradhan et al., 2017; Stafford-Smith et al., 2017). This is an important issue for any strategic and/or policy framework intended to foster sustainability. Specifically, any strategy or policy that is ill-conceived or poorly implemented and/or managed may result in unintended or dire consequences for the coupled environment-human system. Recent findings by Hole et al. (2022) have highlighted some potential reasons why this may occur in respect to the SDGs – (1) The language of the SDGs targets and indicators does not adequately account for the multitude of interactions between the environment and human wellbeing and (2) Half of the 169 SDG targets are nature-dependant, two-thirds of which have nature’s role either understated, risks downsized, or ignored.
Thirdly and finally, the SDGs are dependent upon institutions which foster unsustainable resource use (Eisenmenger et al., 2020). Both Costanza et al. (2016) and Biermann et al. (2017) highlighted the need for clear commitments and approaches by governments at all spatial scales to implement the SDGs effectively. Specifically, this would require: (i) A means-end continuum towards achieving a desired goal; (ii) Integrating sectoral policies; (iii) A change in describing societal and policy transformations and (iv) Changes in governance policies and practices (Biermann et al., 2017; Costanza et al., 2016). However, Stevens and Kanie (2016) state that there continues to be obstacles to global sustainability governance, resulting in increasing scepticism. Furthermore, SDG17 (Partnership for the Goals) which is specifically concerned with the SDGs implementation, the stated targets do not show or give guidance concerning the interrelationships and interdependencies between and within the goals (Costanza et al., 2016; Stafford-Smith et al., 2017).
Objective of the paper
Given the potential issues outlined, these all raise a fundamental question concerning the outcomes of implementing the SDGs. Specifically, what are the levels, nature, and dynamics of sustainability from implementing the SDGs in respect to a specific co-evolutionary development option(s) over time? This is potentially the most critical question to answer because the nature, design and implementation of a co-evolutionary strategy may result in unintended or unforeseen outcomes occurring. Thus far, there has been no direct quantitative determination of the sustainability outcomes of implementing the SDGs. Specifically, in respect to the indicated level(s), nature and dynamics at a specified spatial-temporal scale. This issue has begun to be addressed by Randers et al. (2018, 2019).
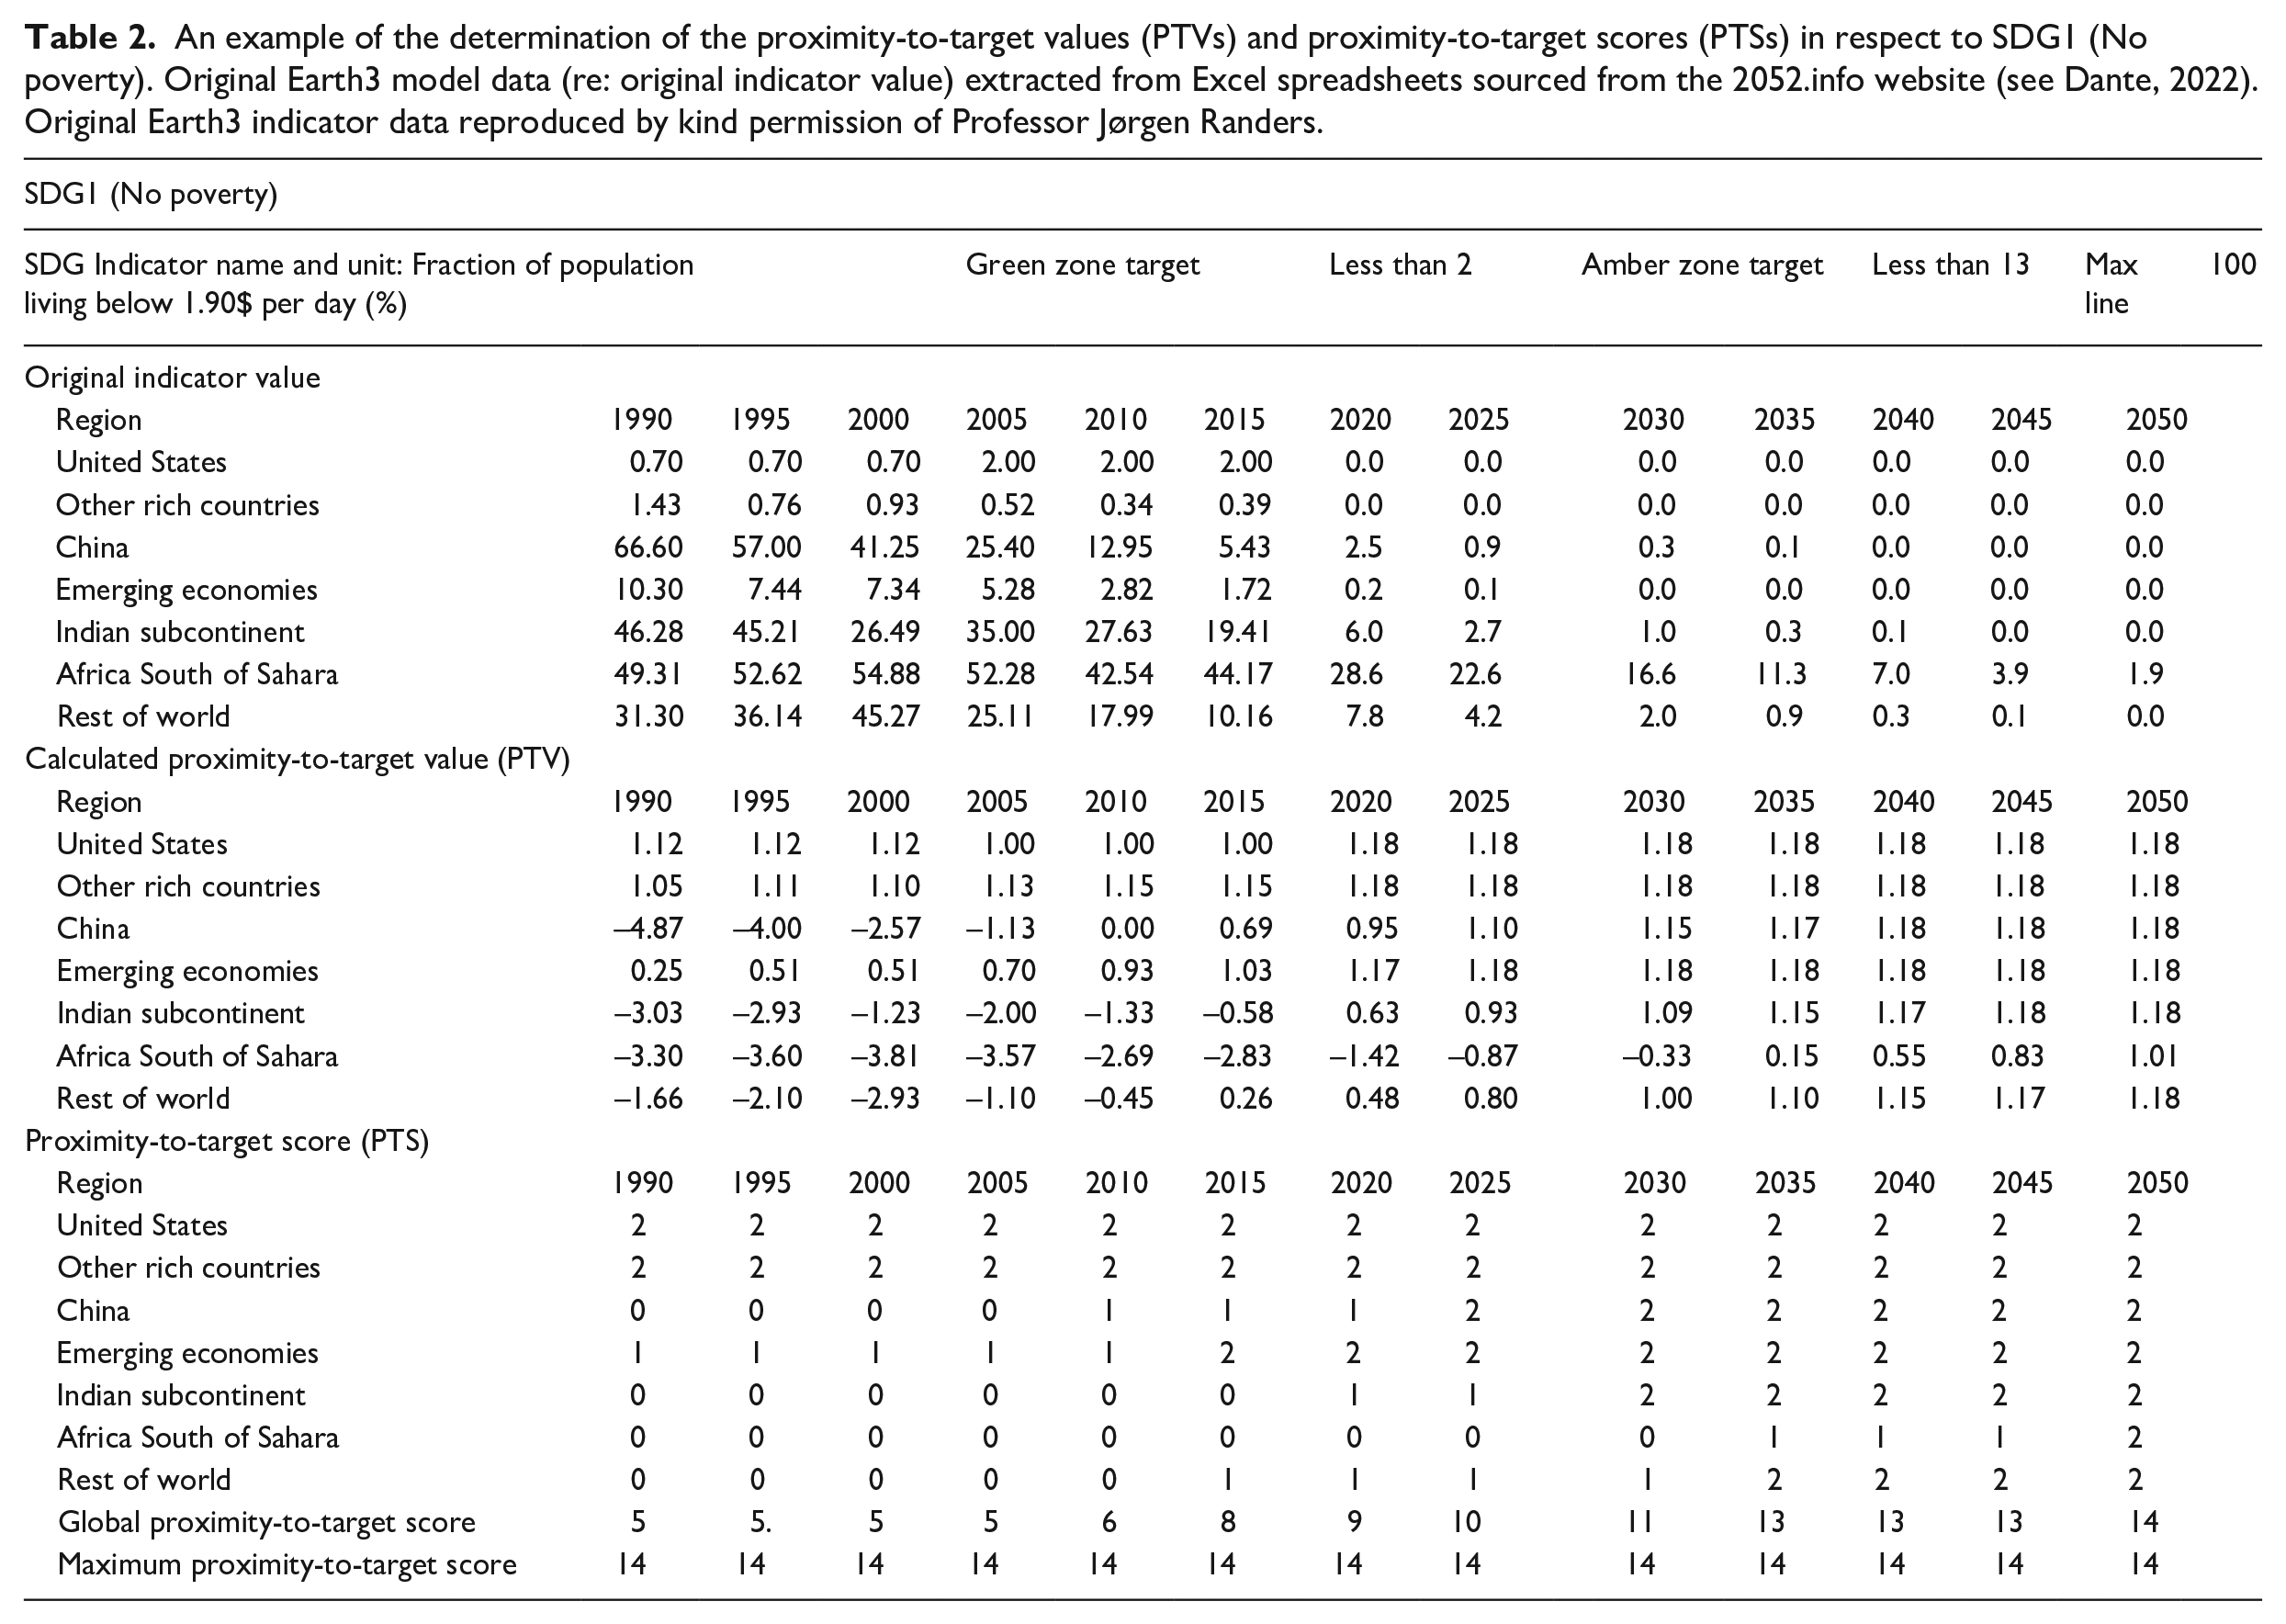
Through the development of the Earth3 model, Randers et al. (2018, 2019) indicatively determined the degree of success in implementing the SDGs and planetary boundaries (re: Rockström et al., 2009). This was evaluated for four development scenarios (see Table 2) in respect to seven world regions 2 for the period 1980–2050. The detailed Earth3 scenarios are shown in Supplemental Table 1. However, the four pathway scenarios in summary are as follows, based on Randers et al. (2018: 15–35).
An example of the determination of the proximity-to-target values (PTVs) and proximity-to-target scores (PTSs) in respect to SDG1 (No poverty). Original Earth3 model data (re: original indicator value) extracted from Excel spreadsheets sourced from the 2052.info website (see Dante, 2022). Original Earth3 indicator data reproduced by kind permission of Professor Jørgen Randers.
The Same pathway (Scenario 1) is a scenario whereby all countries commit to delivering all 17 SDGs and preventing planetary degradation. This is achieved through existing policy tools to grow their economies, in order to finance the attainment of the SDGs. The Faster pathway (Scenario 2) adopts the same objective as Scenario 1, but with a quicker rate of economic growth. The Harder pathway (Scenario 3) is where the world’s countries adopt revised and ambitious policies, which encourages economic growth, social development and environmental protection and management. This is achieved through engagement within and between governments, business and civil society. Finally, the Smarter pathway (Scenario 4) is a scenario where the world’s countries adopt transformational and bold policies in respect to: accelerated growth in renewable energy and sustainable food chain productivity; implementing new development models in economically developing countries; unparallelled action in reducing inequality; and changes and investment in education, gender equality, and family planning. The Smarter pathway also has a direct objective to stabilise the world’s population levels.
Whilst Randers et al. (2018, 2019) determined the indicated outcomes of the four scenario pathways in respect to SDGs and planetary boundaries through the Earth3, the potential sustainability outcomes of the four scenarios in respect to a direct determination of the indicated levels, nature, and dynamics at the global spatial scale remains unclear. In respect to the Earth3, and well as the broader question of the SDGs, there needs to be a direct quantitative evaluation of the potential sustainability outcomes of the four scenarios. This needs to goes beyond quantifying the degree of success in implementing the SDGs. Without this, then there may be unintended consequences and/or significant risks for the environment-human system and co-evolutionary relationship.
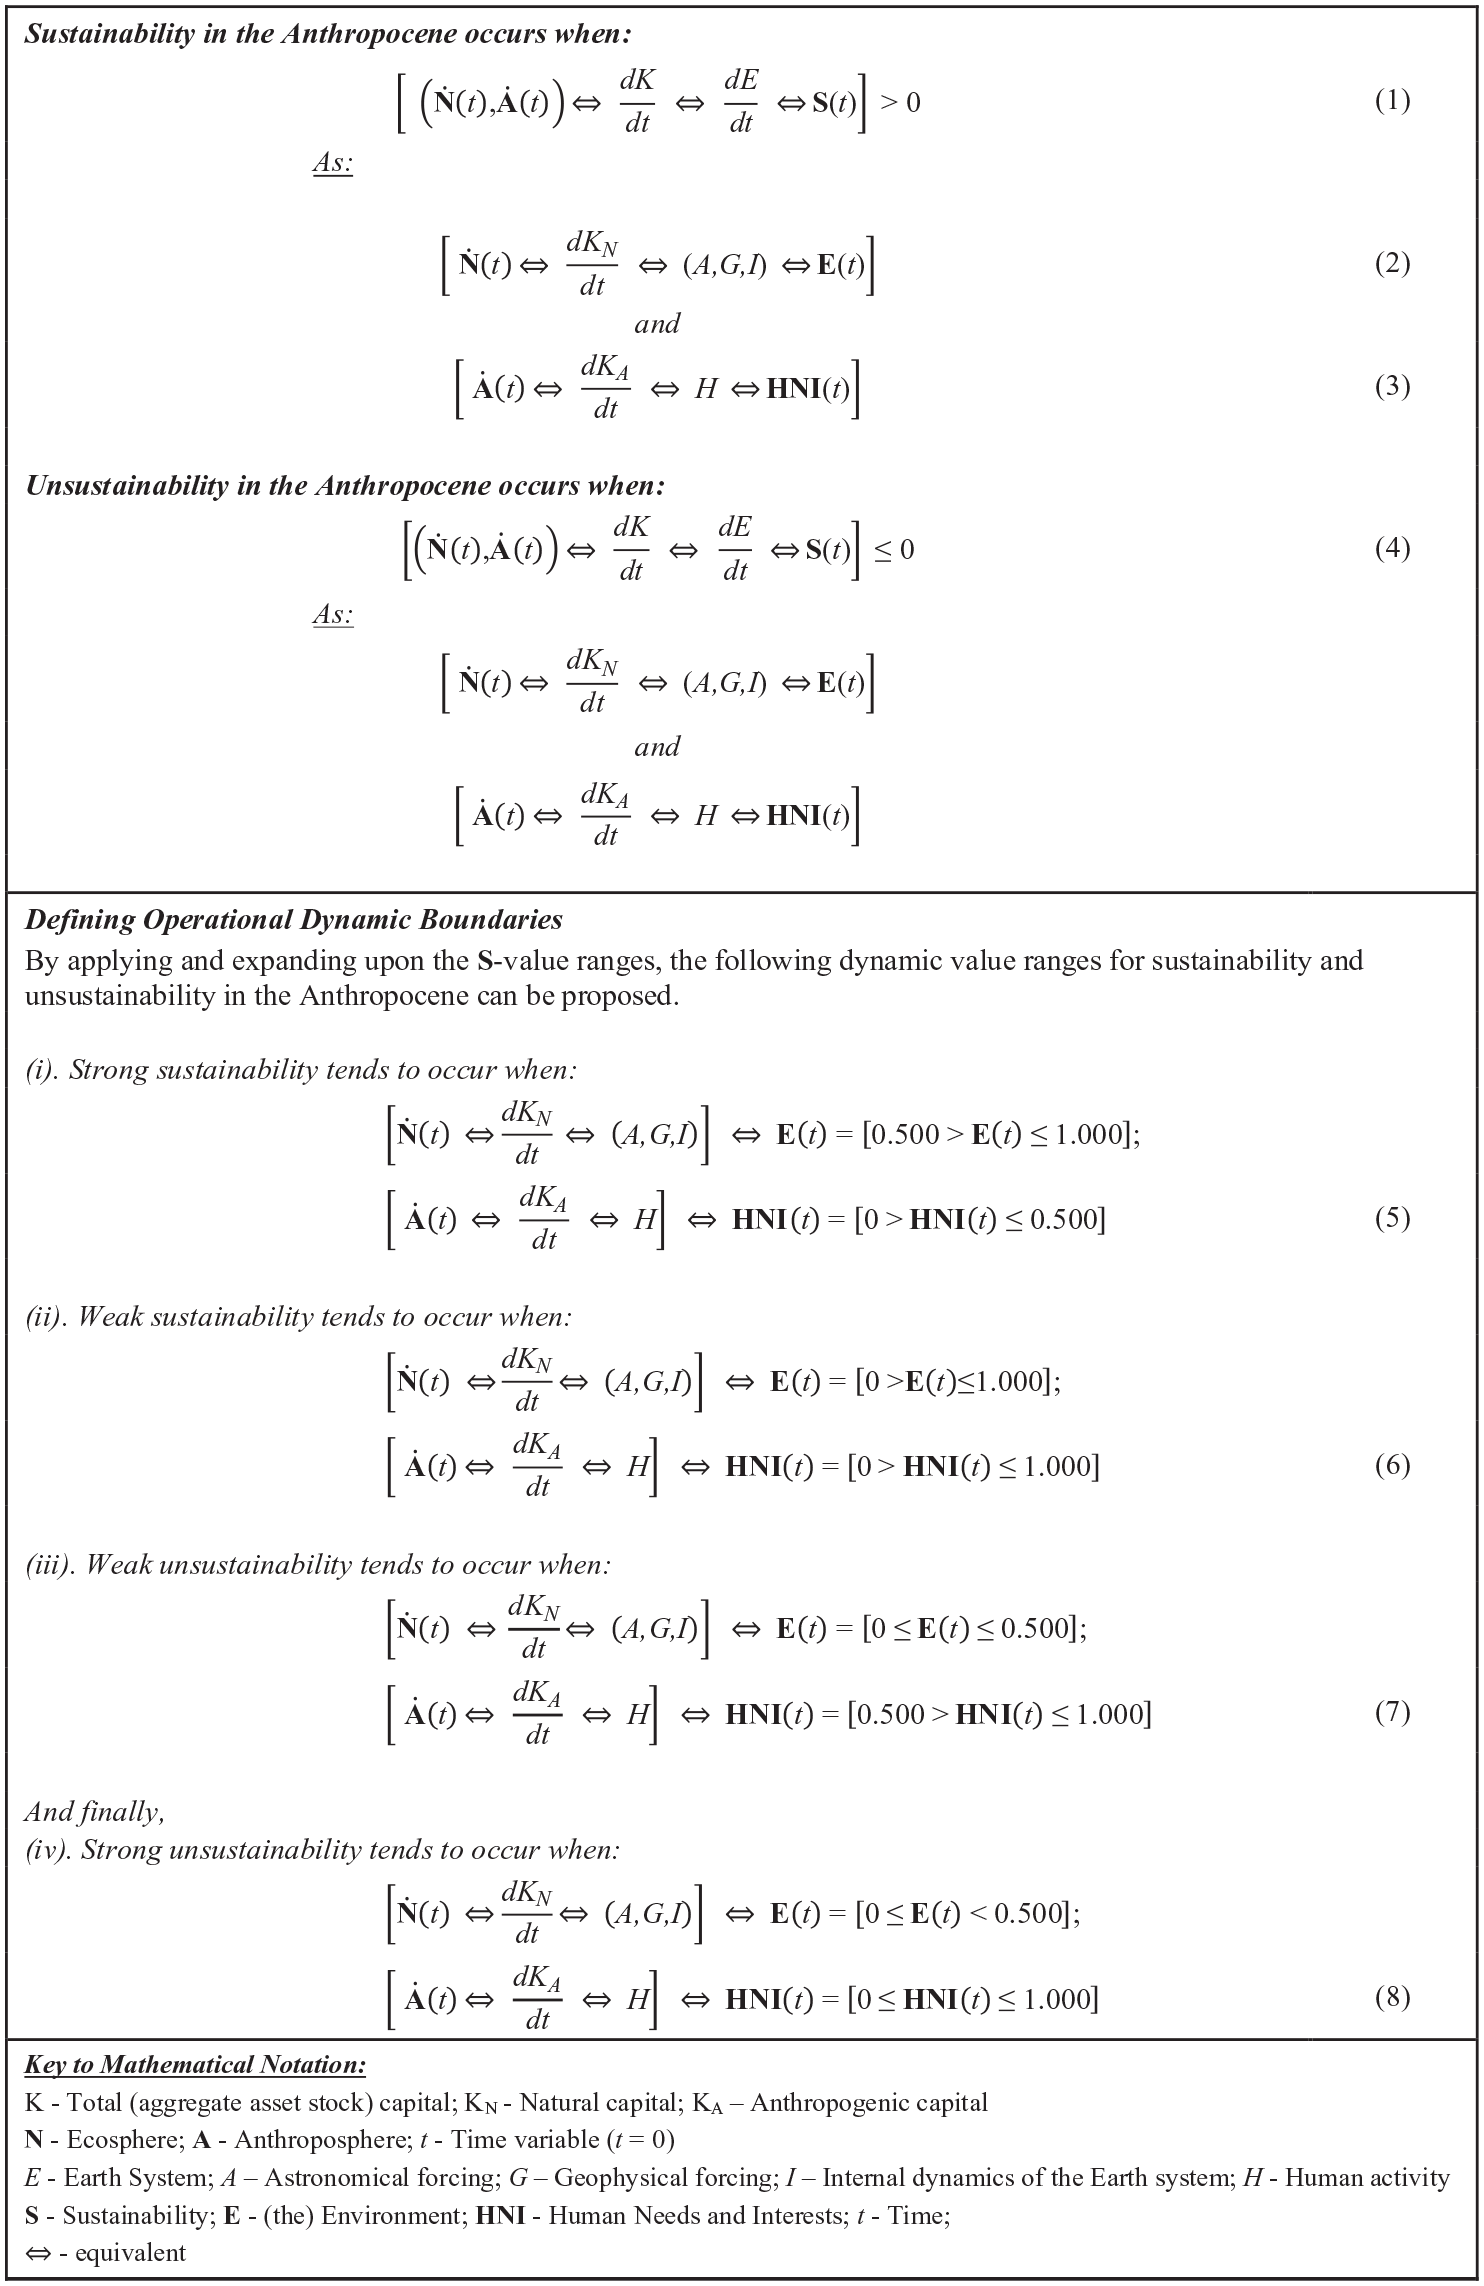
Therefore, with the intention of advancing knowledge concerning the SDGs and their implementation, as well as the potential global sustainability outcomes of different development scenarios, this paper applies the Sustainability Dynamics Framework (SDF) (Phillips, 2020; see Figure 1 and Supplemental Figures 1 and 2) to the SDG data of the Earth3 model (Randers et al., 2018, 2019). The specific objective of this paper was: To determine and evaluate the indicated levels, nature and fundamental dynamics of sustainability occurring for each Earth3 development scenario at the global spatial scale over the period 1990–2050.
The finalised Sustainability Dynamics Framework, after and adapting Phillips (2020).
Based upon the obtained results and analysis conducted, as well as contextualised within the current literature and previous research, the paper shall discuss the fundamental dynamic influences and implications in respect to the sustainability of the global environment-human system and relationship.
Potential significance and justification
The potential significance of the paper within the current literature are considered to be the following.
Firstly, the paper evaluates the potential global sustainability outcomes of implementing the SDGs. Given the significance of the SDGs as the primary approach to foster and maintain sustainability at all spatial-temporal scales, it is important to determine and evaluate their potential outcomes and consequences in respect to different development scenarios. This also becomes of significance and relevance due to the spatial regions that the Earth3 model used to make its evaluations. How all of the regions’ implementation of the SDGs cumulatively influences global sustainability over time was not wholly addressed by Randers et al. (2018, 2019). Therefore, this paper seeks to develop and advance knowledge concerning this question.
Secondly, the SDF application to the Earth3 data is a potential significant advancement, both in terms of the methodology and evaluation of sustainability outcomes. Specifically, the SDF application to the Earth3 provides an advancement in how to potentially evaluate the SDGs outcomes upon sustainability at any specified spatial-temporal scale. Most evaluations of the SDGs outcomes have been specific tailored approaches to fulfil a stated issue or objective, as indicated in Table 1. The potential advancement that this paper offers is in respect to the application of the SDF. The SDF was developed with the purpose of being a holistic conceptual and operational sustainability framework, as stated and demonstrated in Phillips (2020, 2022a, 2022b, 2022c) in its application to other quantitative-based assessments. Therefore, the SDF application to the Earth3 data offers the opportunity for a consistent, robust, and integral approach in determining and evaluating the potential or actual global sustainability outcomes from the SDGs implementation.
Thirdly and finally, evaluating the sustainability outcomes of the SDGs have predominantly been specific to a particular goal or a combination of goals, as indicated in Table 1. Whilst there has been research examining the interactions within some or all of the goals, such as Lyytimäki et al. (2021), Pradhan et al. (2017), van Soest et al. (2019), Waage et al. (2015), and Zelinka and Amadei (2019a, 2019b); there has been far less in directly quantitatively determining and evaluating the sustainability outcomes of SDGs implementation. Most evaluations of the implementation and interactions of some or all of the SDGs and their sustainability outcomes have tended to be qualitative in nature and reductionist in perspective. The potential advantage of the SDF, in respect to Earth3 and the SDGs, is that it was developed to be a holistic quantitative framework (Phillips, 2020). This is based upon the integration of four theories and concepts of the environment-human system and relationship from different disciplinary perspectives 3 (Phillips, 2020; see Figure 1). Therefore, the SDF provides a holistic and consistent approach in determining and evaluating the outcomes of the SDGs in respect to four different development scenarios. Furthermore, the SDF can provide insights concerning the influences and impacts that determine sustainability outcomes, whether direct or indirect in nature, and their significance and magnitude.
Methodology
The full Earth3 model results were downloaded from the 2052.info website (re: Dante, 2022), and collated within Microsoft Excel 2016. Due to the use of different indicators and units for each SDG, as shown in Supplementary Table 2, the data had first to be normalised so that all of the SDGs were consistent with one another and to be able to apply the SDF. Therefore, the normalisation of the SDG data involved the following.
Using the amber zone (halfway target) and green zone targets for each SDG, as shown in Supplemental Table 2, 4 a proximity-to-target approach was applied. However, each SDG indicator targets either increased or decreased from the amber zone target to the green zone target. Therefore, a proximity-to-target value (PTV) was calculated using the appropriate following equation developed specifically for the SDF methodology:
(a). Increase towards Green Zone Target:


(b). Decrease towards Green Zone Target:


Glossary: PVT – Proximity-to-Target Values; OV – Obtained Value; GZT – Green Zone Target; AZT – Amber Zone (Halfway) Target; TIx – Target Interval.
Equations (9) and (11) were used in respect to each SDG for the four scenarios as appropriate, to calculate the proximity-to-target values for the seven regions over the period 1990–2050. The years 1980 and 1985 were not included in the final calculations was due to no available data for all of the regions in respect to SDG9 and 11. An example of the generated output is shown in Table 2 in respect to SDG1 (No poverty).
The next step was to further normalise the obtained proximity-to-target values (PTVs). This was because the obtained PTVs had either positive or negative integers, as indicated in Table 2. Therefore, it was necessary to normalise the values so that they occurred within a range from zero onwards in order to apply the SDF component theory the Mathematical Model of Sustainability (MMS) (Phillips, 2010, 2015, 2016). Consequently, using a conditional rule developed in Excel 2019, the obtained PTVs were each assigned a score based upon the following range: 0 = less than or equal to 0 (red zone); 1 = greater than zero to less than 1 (amber zone) and 2 = greater than 1 (green zone).
The obtained proximity-to-target score (PTS) for each SDG in the seven regions were then added together, to give a global PTS value for each assessed year in each scenario (see Table 2). Finally, the potential maximum global PTS value was calculated which was 14 (7 × 2), reflecting the seven regions and the maximum normalised PTS of 2.
With the PTS values obtained, the MMS was applied using the methodology shown in Figure 2. The values obtained through the MMS consisted of the following: (i) the Environment (
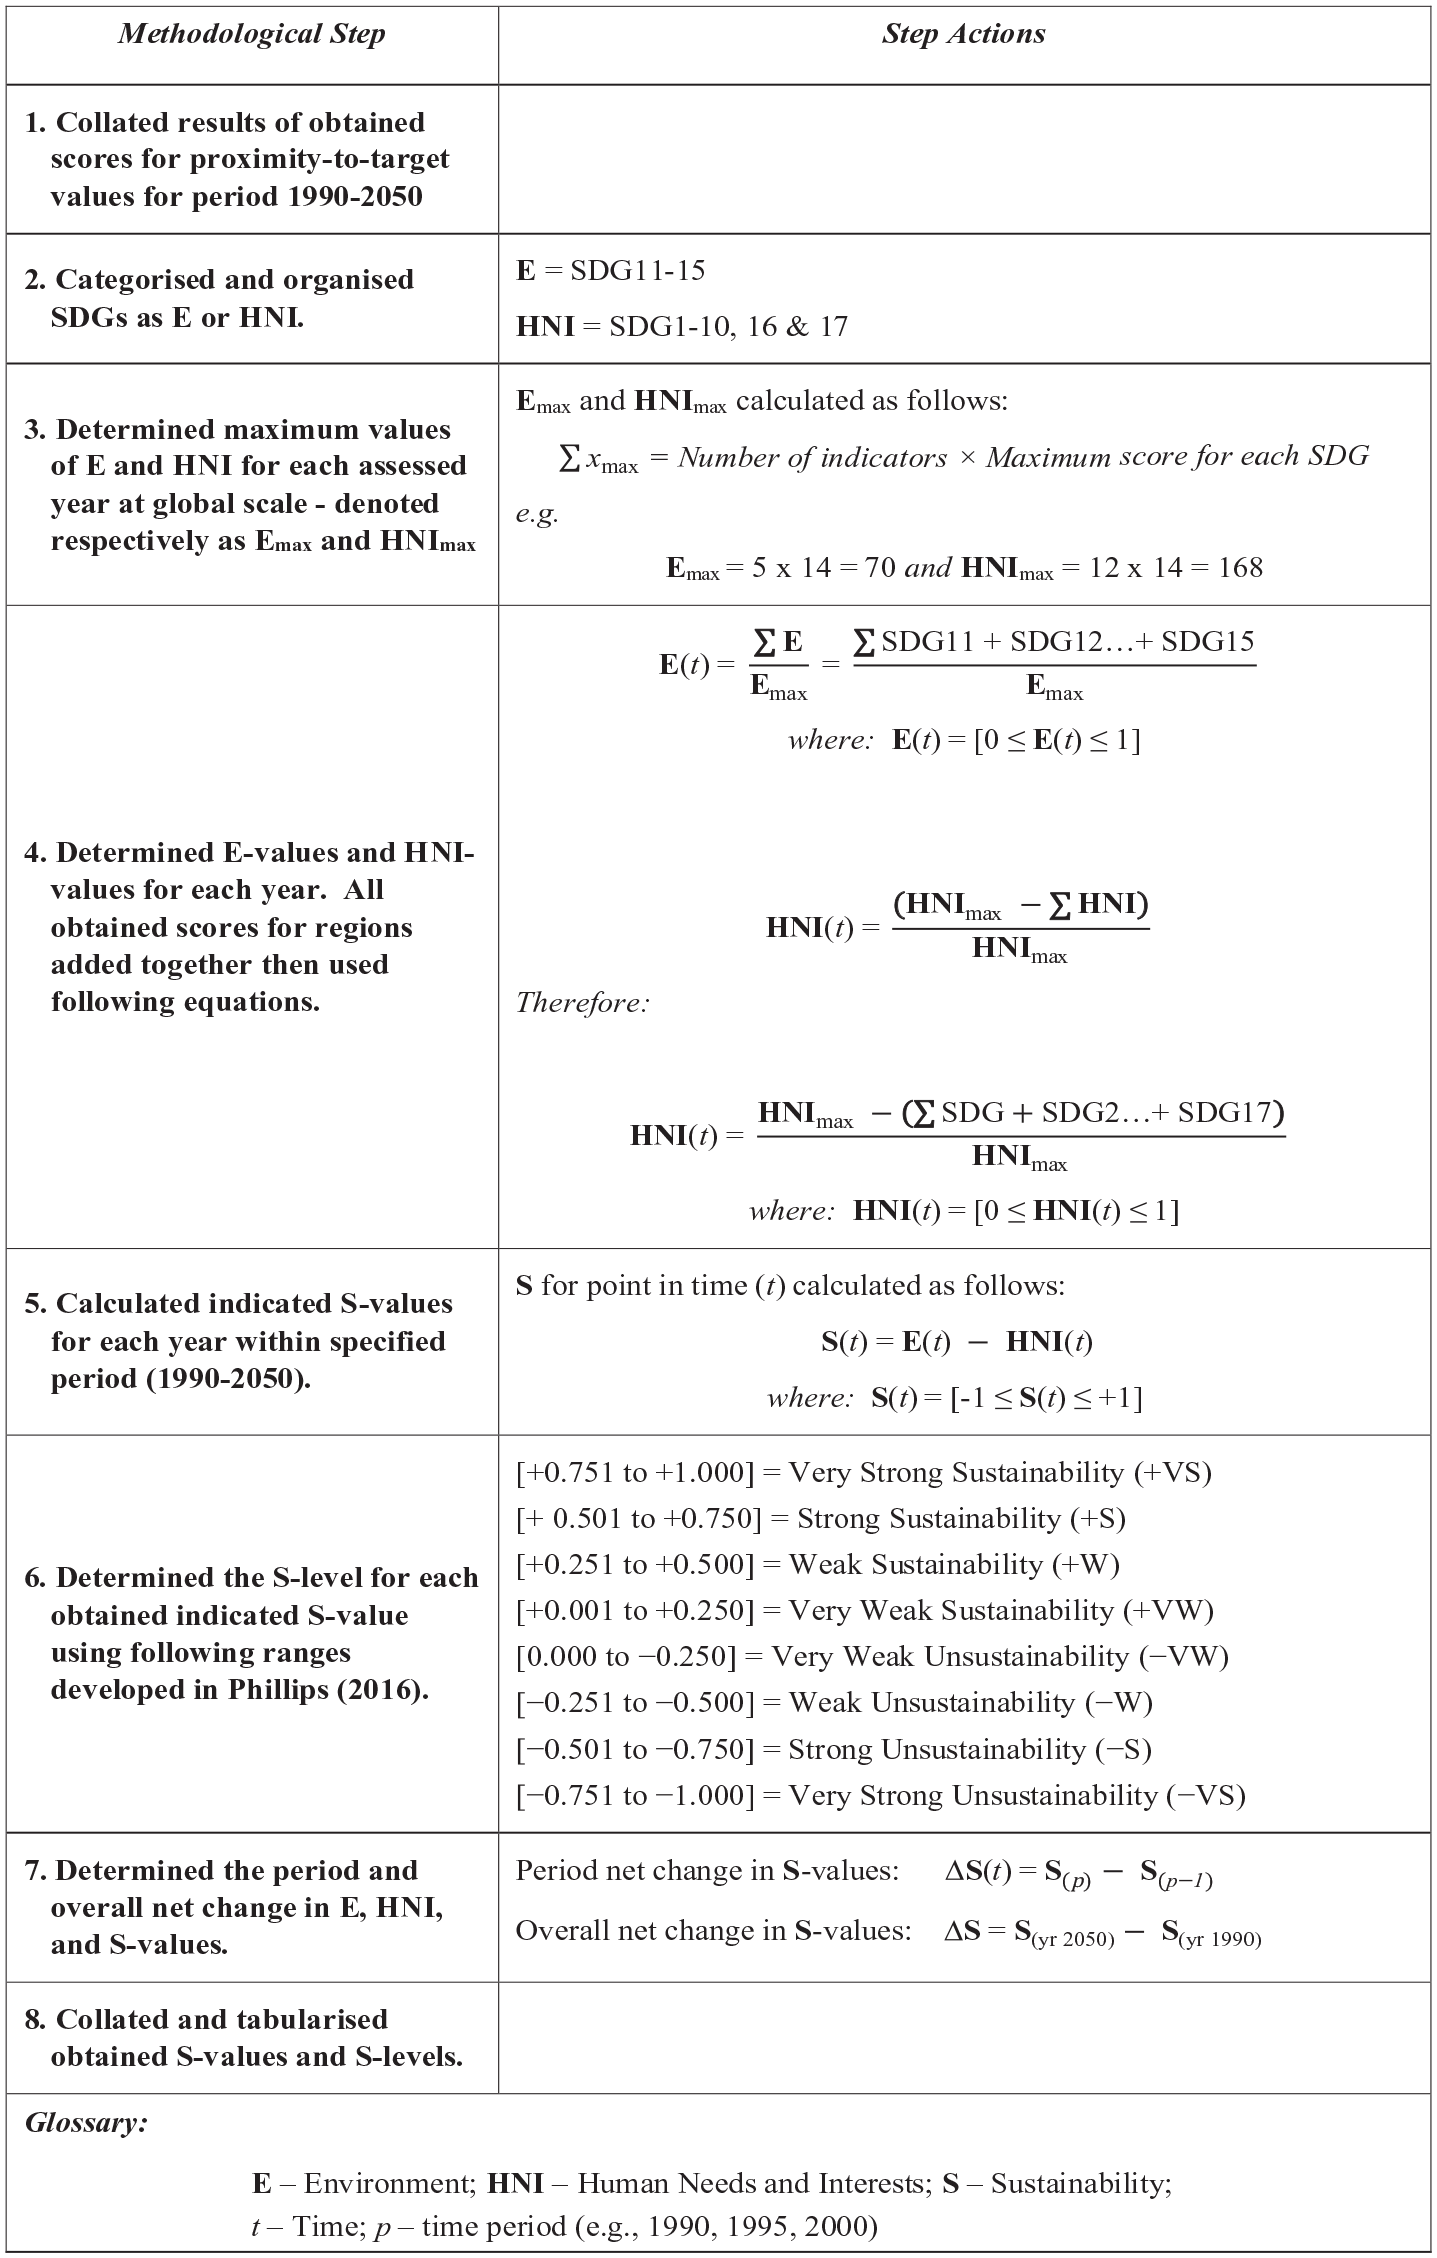
MMS application process for determined proximity-to-target scores of SDGs at global spatial scale, based on and adapting Phillips (2016, 2020, 2022c, 2022a, 2022b) (see Supplemental Figure 3).
The
The final stage of the SDF methodology was the Fourier analysis. This indicatively determine the fundamental dynamic characteristics and trends of the environment-human system & relationship over time. The analysis was conducted using the obtained values of period net change of
Results and analysis
Obtained E, HNI and S-values
Scenario 1 (Same)
As Table 3 and Figure 3 shows, the obtained indicated
Obtained
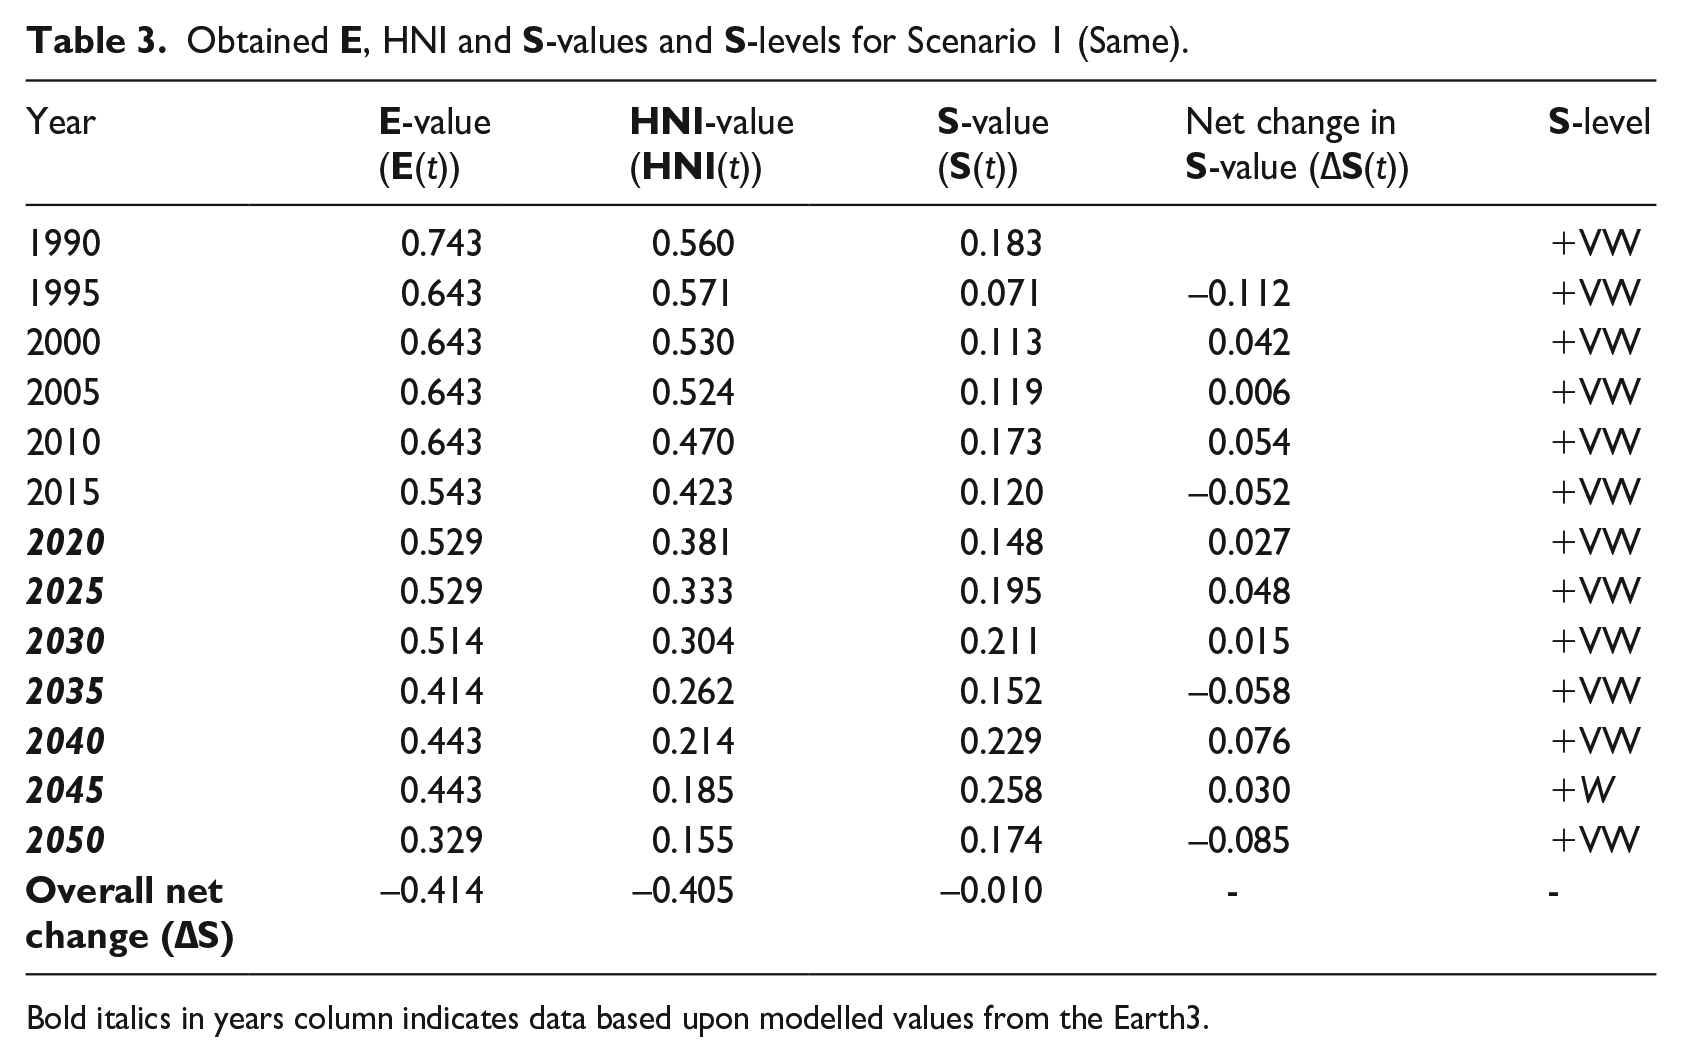
Bold italics in years column indicates data based upon modelled values from the Earth3.
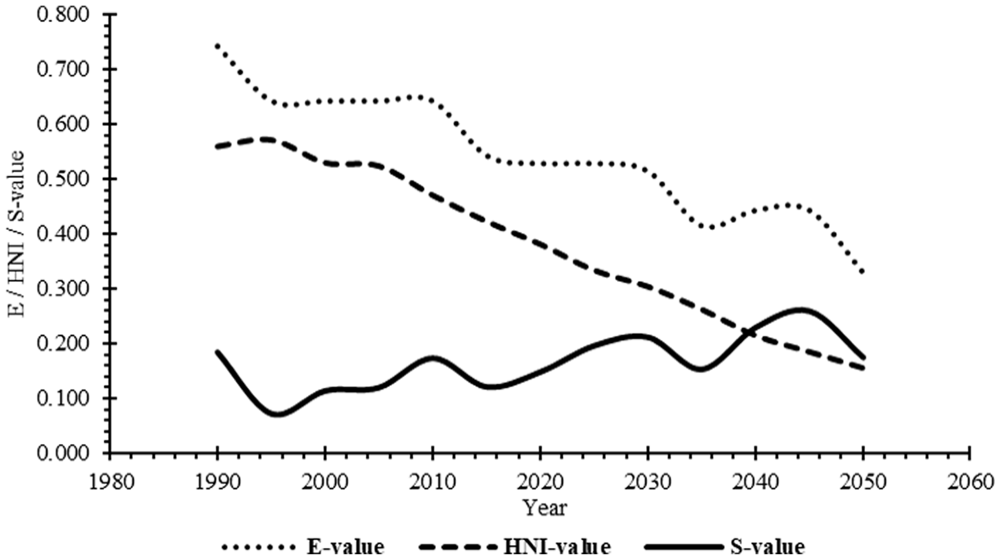
Trends of Scenario 1s
The obtained
Scenario 2 (Faster)
As shown in Table 4 and Figure 4, this scenario shares similar fundamental trends with Scenario 1. The obtained
Obtained
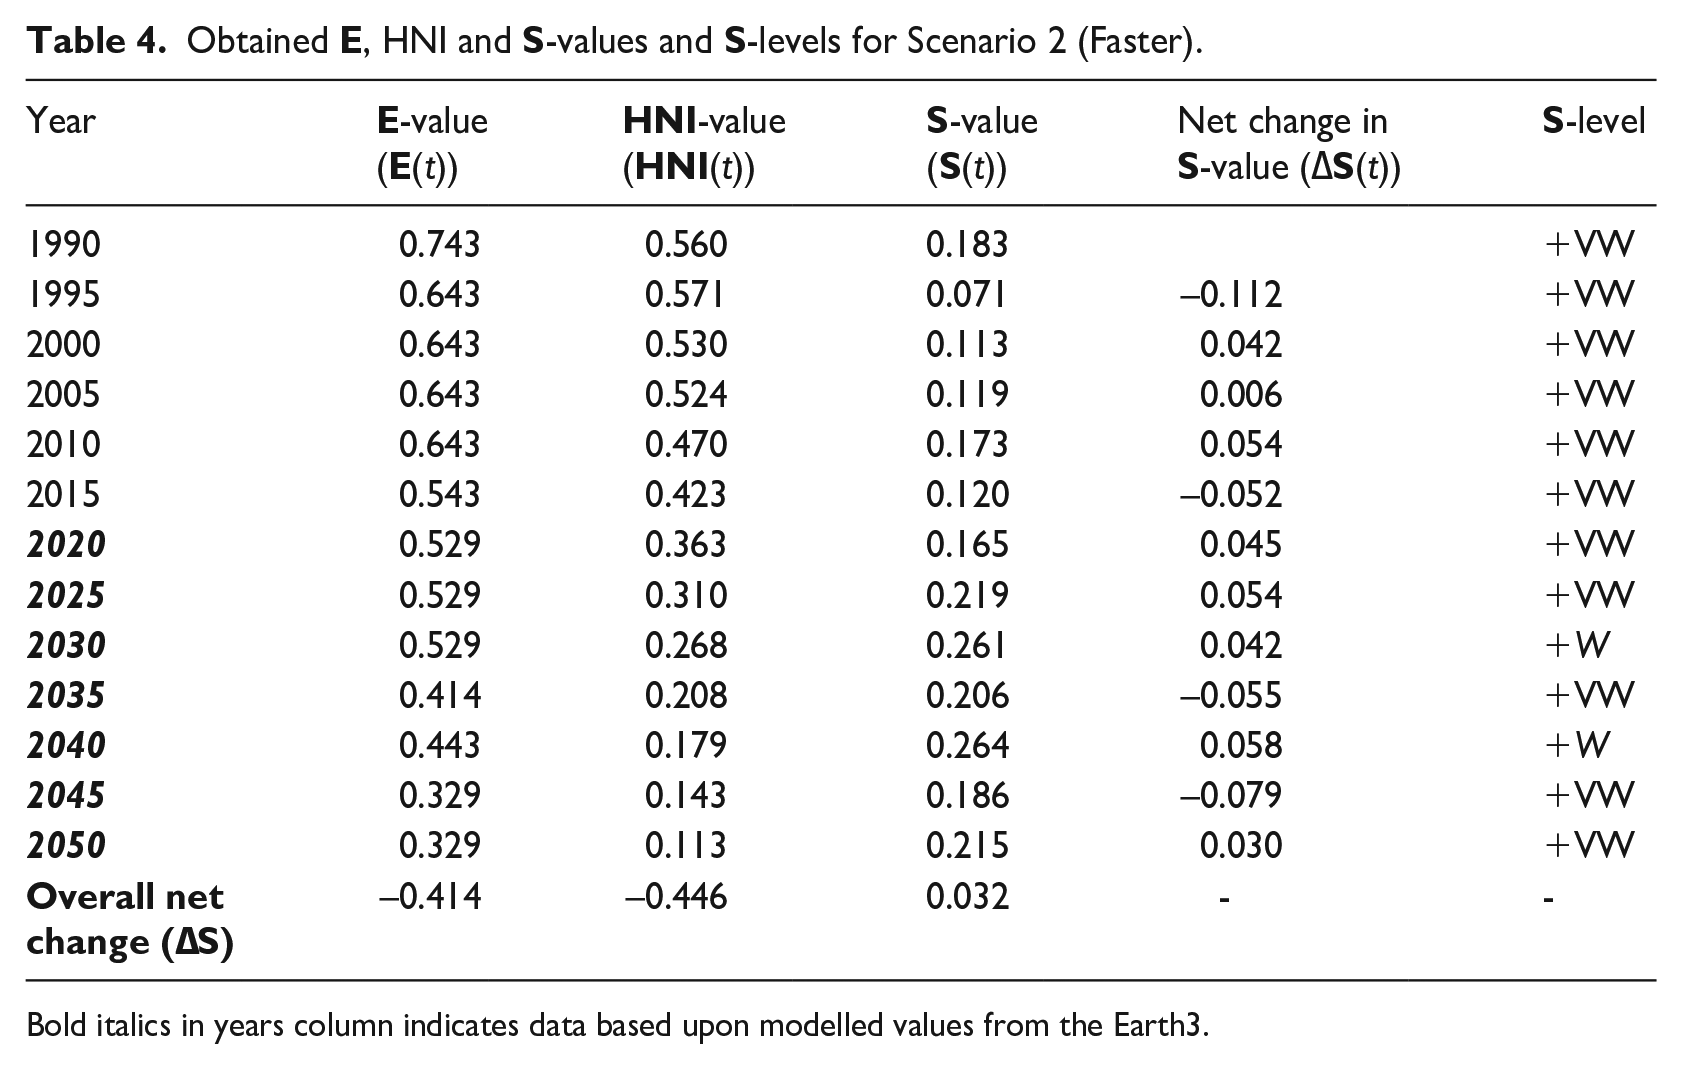
Bold italics in years column indicates data based upon modelled values from the Earth3.
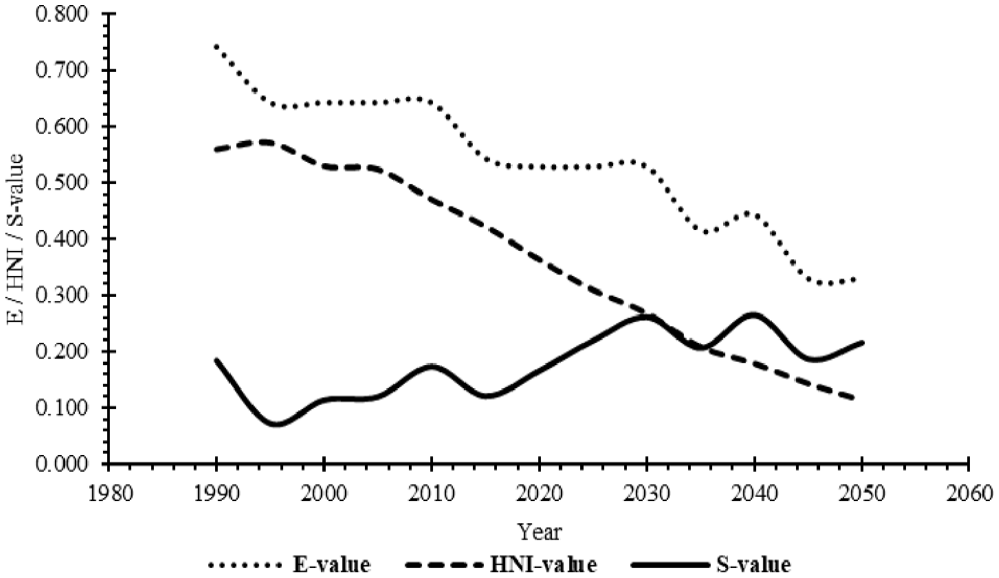
Trends of Scenario 2s
As with Scenario 1, the obtained
Scenario 3 (Harder)
Table 5 and Figure 5 indicates that the obtained
Obtained
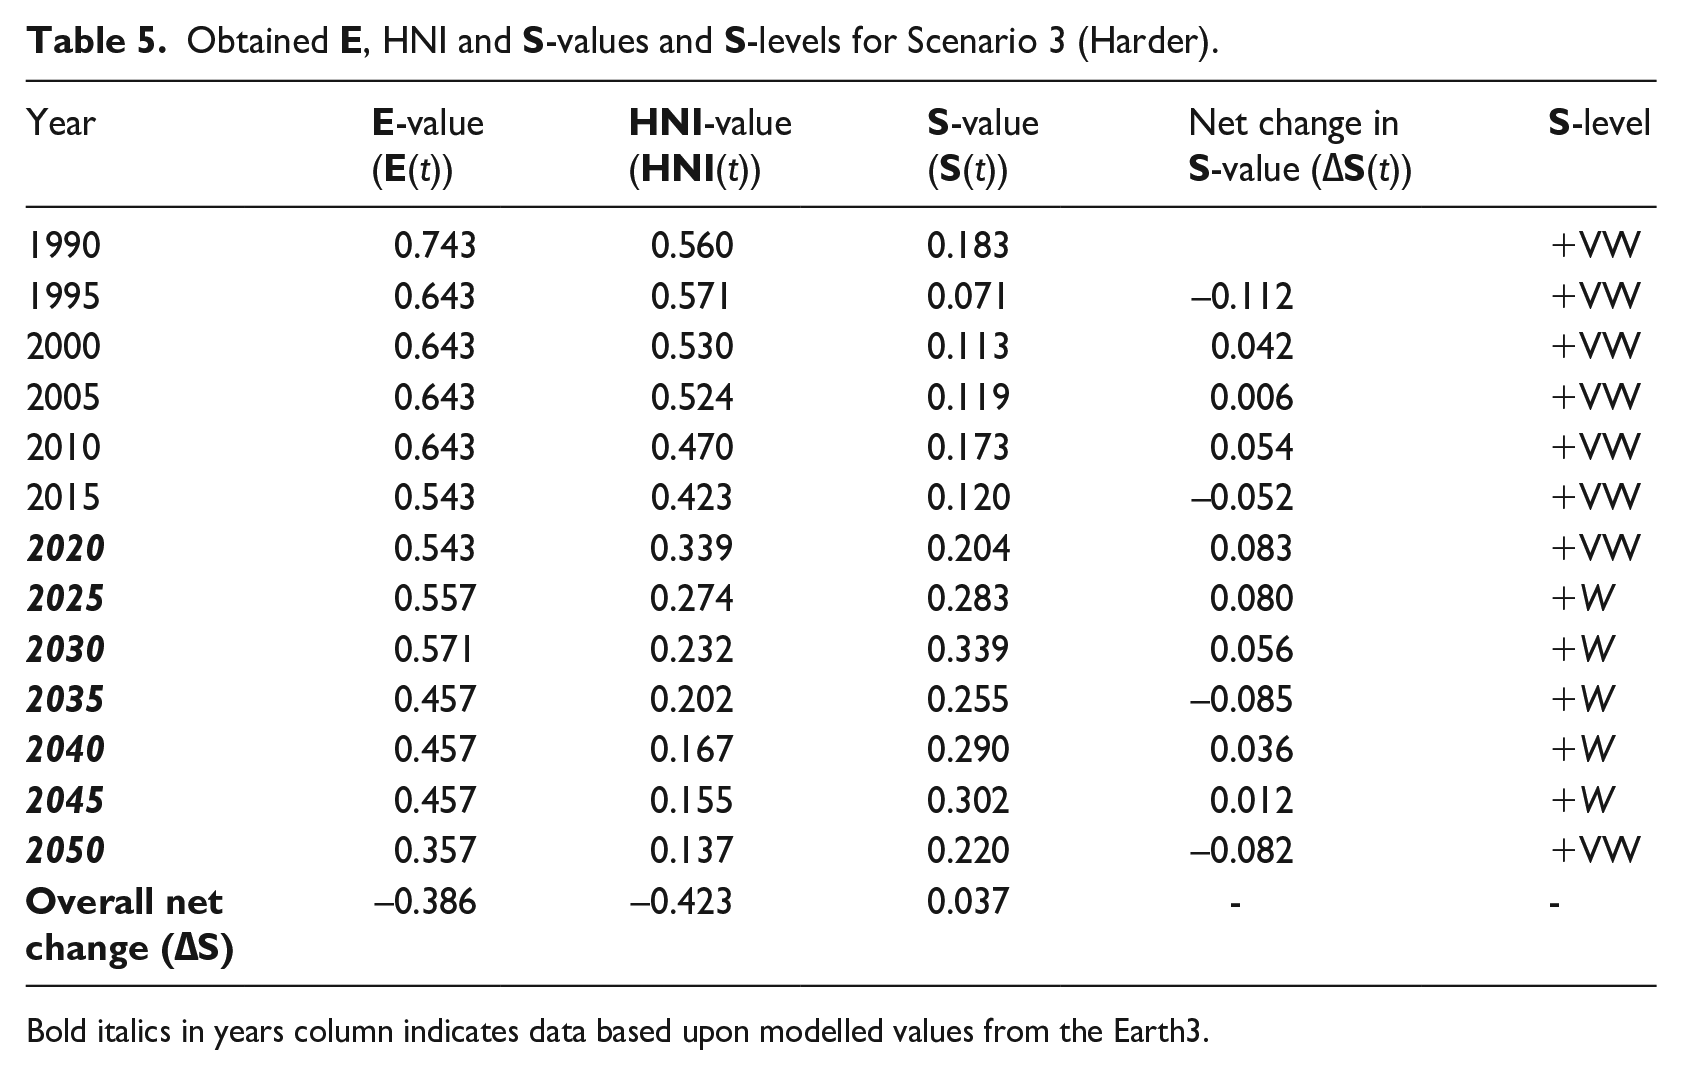
Bold italics in years column indicates data based upon modelled values from the Earth3.
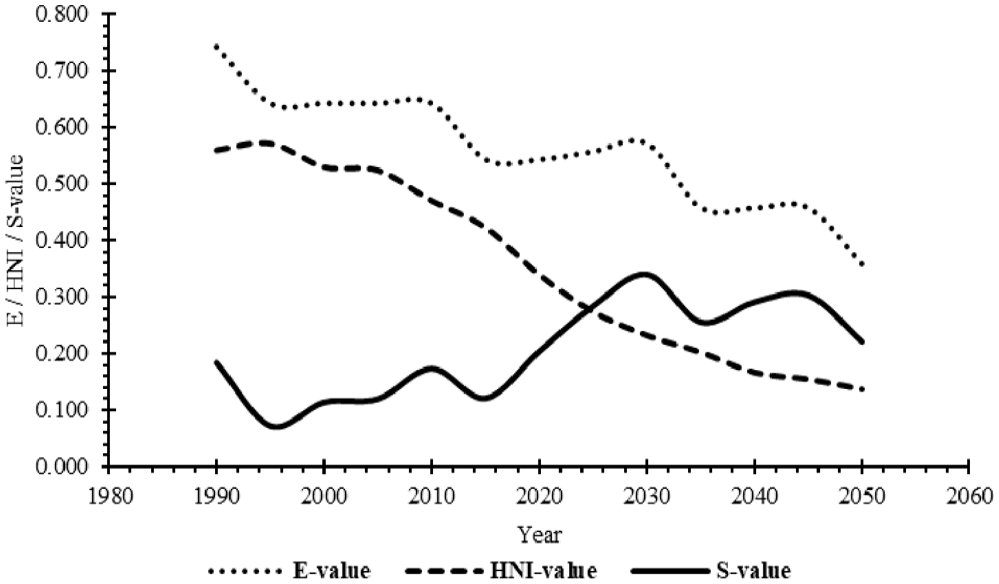
Trends of Scenario 3s
The results obtained for this scenario indicates an improvement in comparison to Scenarios 1 and 2. Specifically, that weak sustainability (+W) was obtained and maintained for a longer period than occurred in Scenarios 1 and 2. However, this reverts back to very weak sustainability (+VW) at the end of the specified period. This consequently indicates that the tangible environmental and social wellbeing benefits are achieved for a period of time, as indicated in Supplemental Table 1. Nevertheless, these are diminished as global environmental change, economic and social inequalities, and political discord and apathy increases, as indicated in Supplemental Table 1. Given that this scenario emphasises global co-operation to foster sustainability, then this appears to result in no significant long-term improvements to occur, in comparison to the first two scenarios.
Scenario 4 (Smarter)
As Table 6 and Figure 6 indicates, this scenario was the only one which had a significant tangible improvement in obtained
Obtained
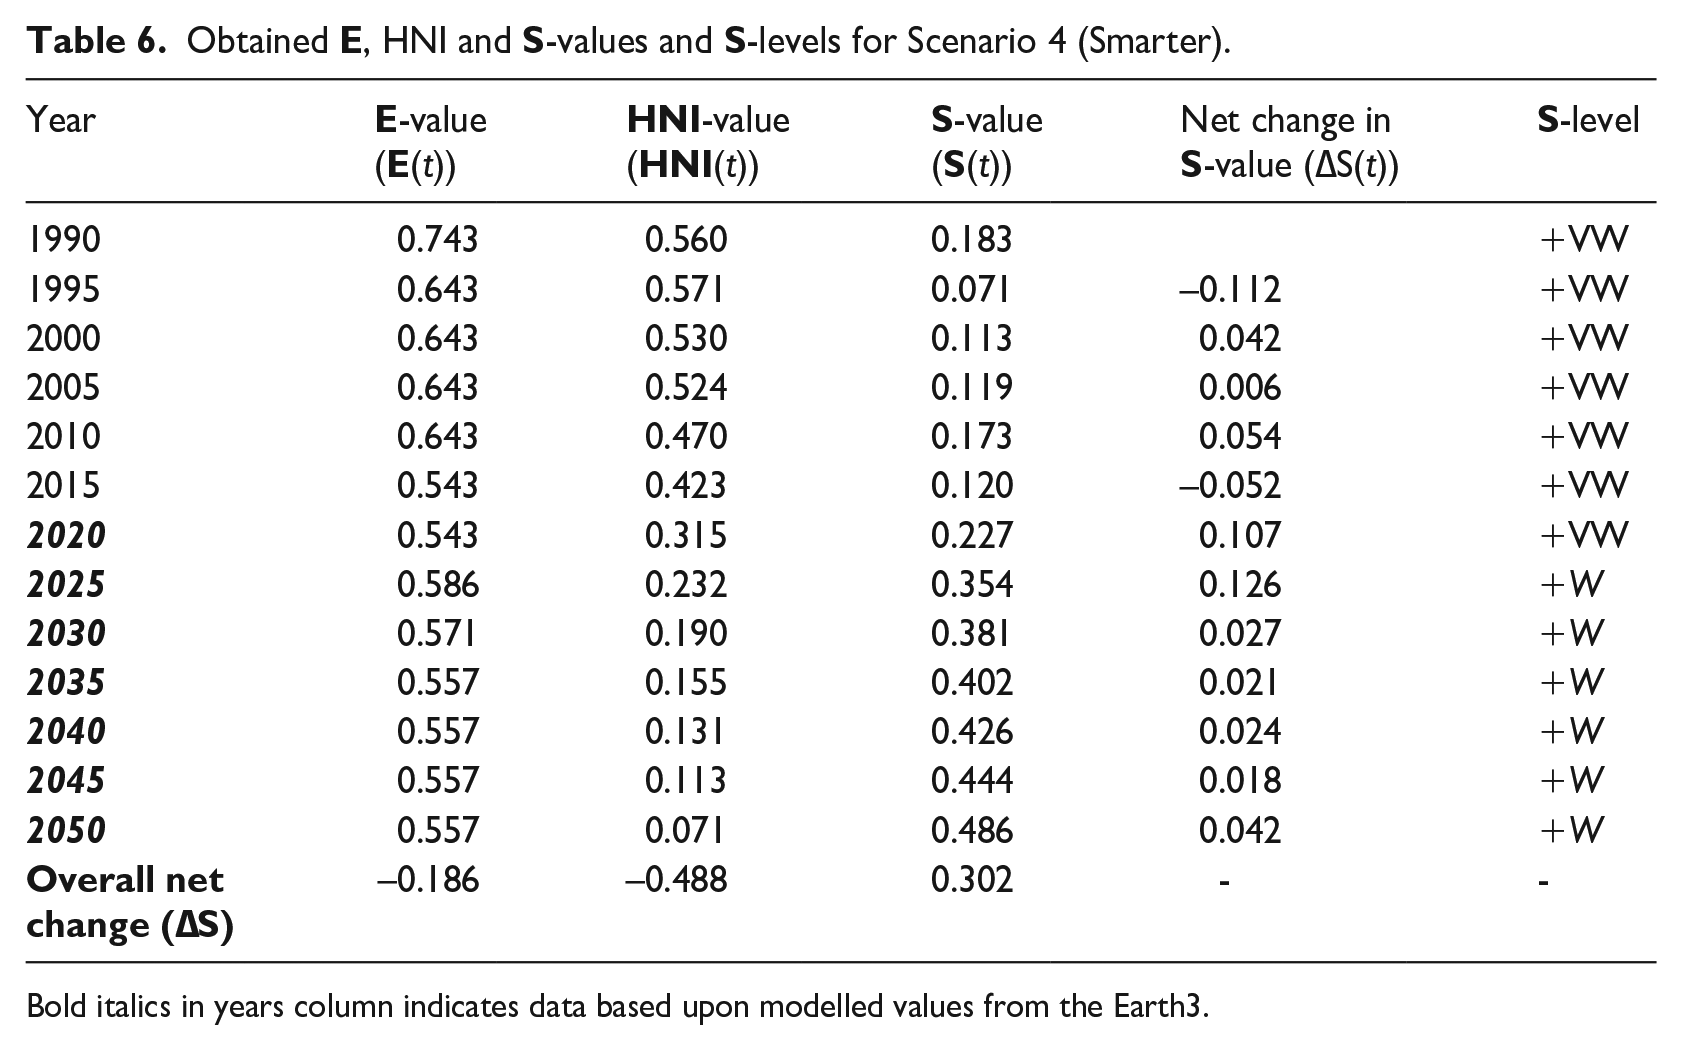
Bold italics in years column indicates data based upon modelled values from the Earth3.
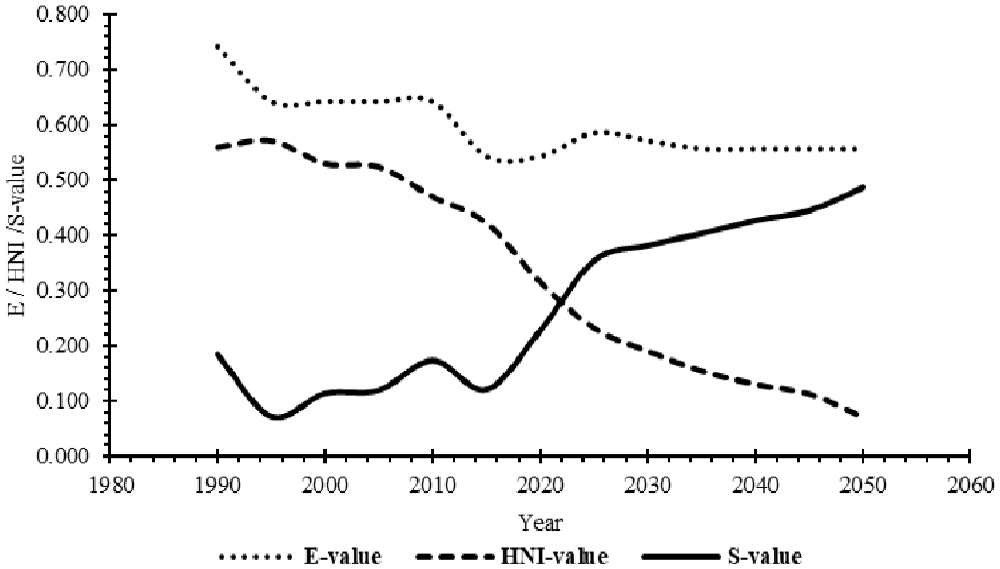
Trends of Scenario 4s
As Table 6 and Figure 6 indicates, the results indicate that Scenario 4 was the best potential scenario evaluated in respect to obtained HNI and
Fourier analysis
Scenario 1
Figure 7 indicates that there is a continuous impact cycle of approximately 10 years duration in the t = 0 to t + 3 plots. This represented by the start to the end of each peak with no lag period in-between. The trend alters in t + 4 plot to a more elongated impact cycle with a pronounced trough of approximately 8 years in duration. This trough occurs in-between the two peak cycles of approximately 10 years duration each. The cycles in the t + 4 plot indicates a greater significance and magnitude of impacts than in the t = 0 to t + 3 plots.
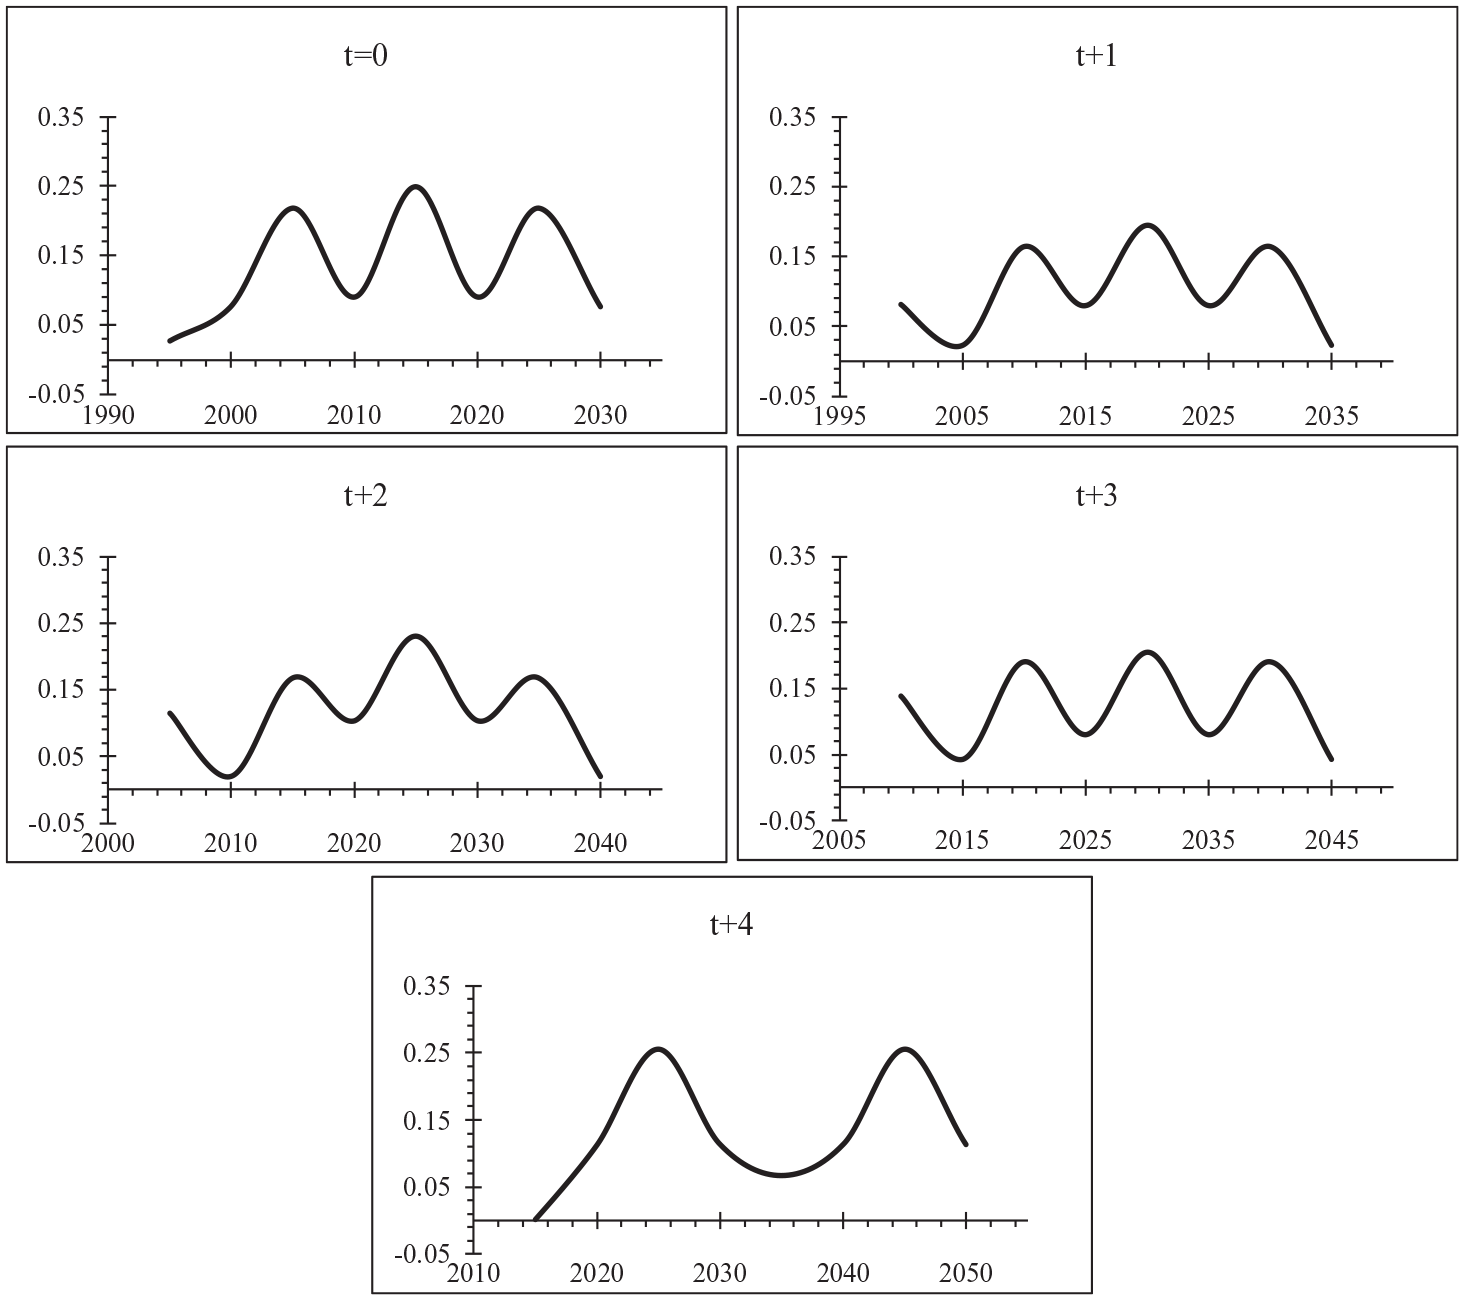
Fourier transformation time series plots of net change of
The changes in cyclic trends from the t = 0 → t + 3 plots to the t + 4 plot indicates alteration in the level and nature of dE/dt of the SDF component theory ‘the Anthropocene Equation’ (re: Gaffney and Steffen, 2017; see equation (S2) in Supplemental Figure 1). However, the impact cycles whilst becoming less frequent, they increase over time in their significance and magnitude. This consequently indicates a change in the level and nature of anthropospheric impacts upon the environmental system. Specifically, the environmental system continues to be fundamentally compromised by anthropogenic activities from historical impacts and those occurring at the time.
Scenario 2
As indicated in Figure 8, the initial cyclic trend of continuous 10-year peak cycles of impacts, as previously seen in Scenario 1, are evident in the t = 0 to t + 2 plots. However, the t + 3 and t + 4 plots indicate a single impact peak of approximately 20 years duration, as measured from the start to the end of the peak cycle. There are also indications of a lag period before and after the impact peak cycle in the t + 3 and t + 4 plots. This consequently indicates that there is a potential rapid alteration in the level and natures of anthropospheric impacts upon the environment, as the scenario’s policies and strategy of accelerated economic fosters greater investment in green technologies and social development. Nevertheless, the t + 3 and t + 4 plots indicate a fundamental change in the level and nature of dE/dt, as also indicated in Scenario 1. This consequently suggests trade-offs between accelerated economic growth and less frequent environmental impacts. However, the nature of such environmental impacts is greater in terms of their duration, significance, and magnitude.
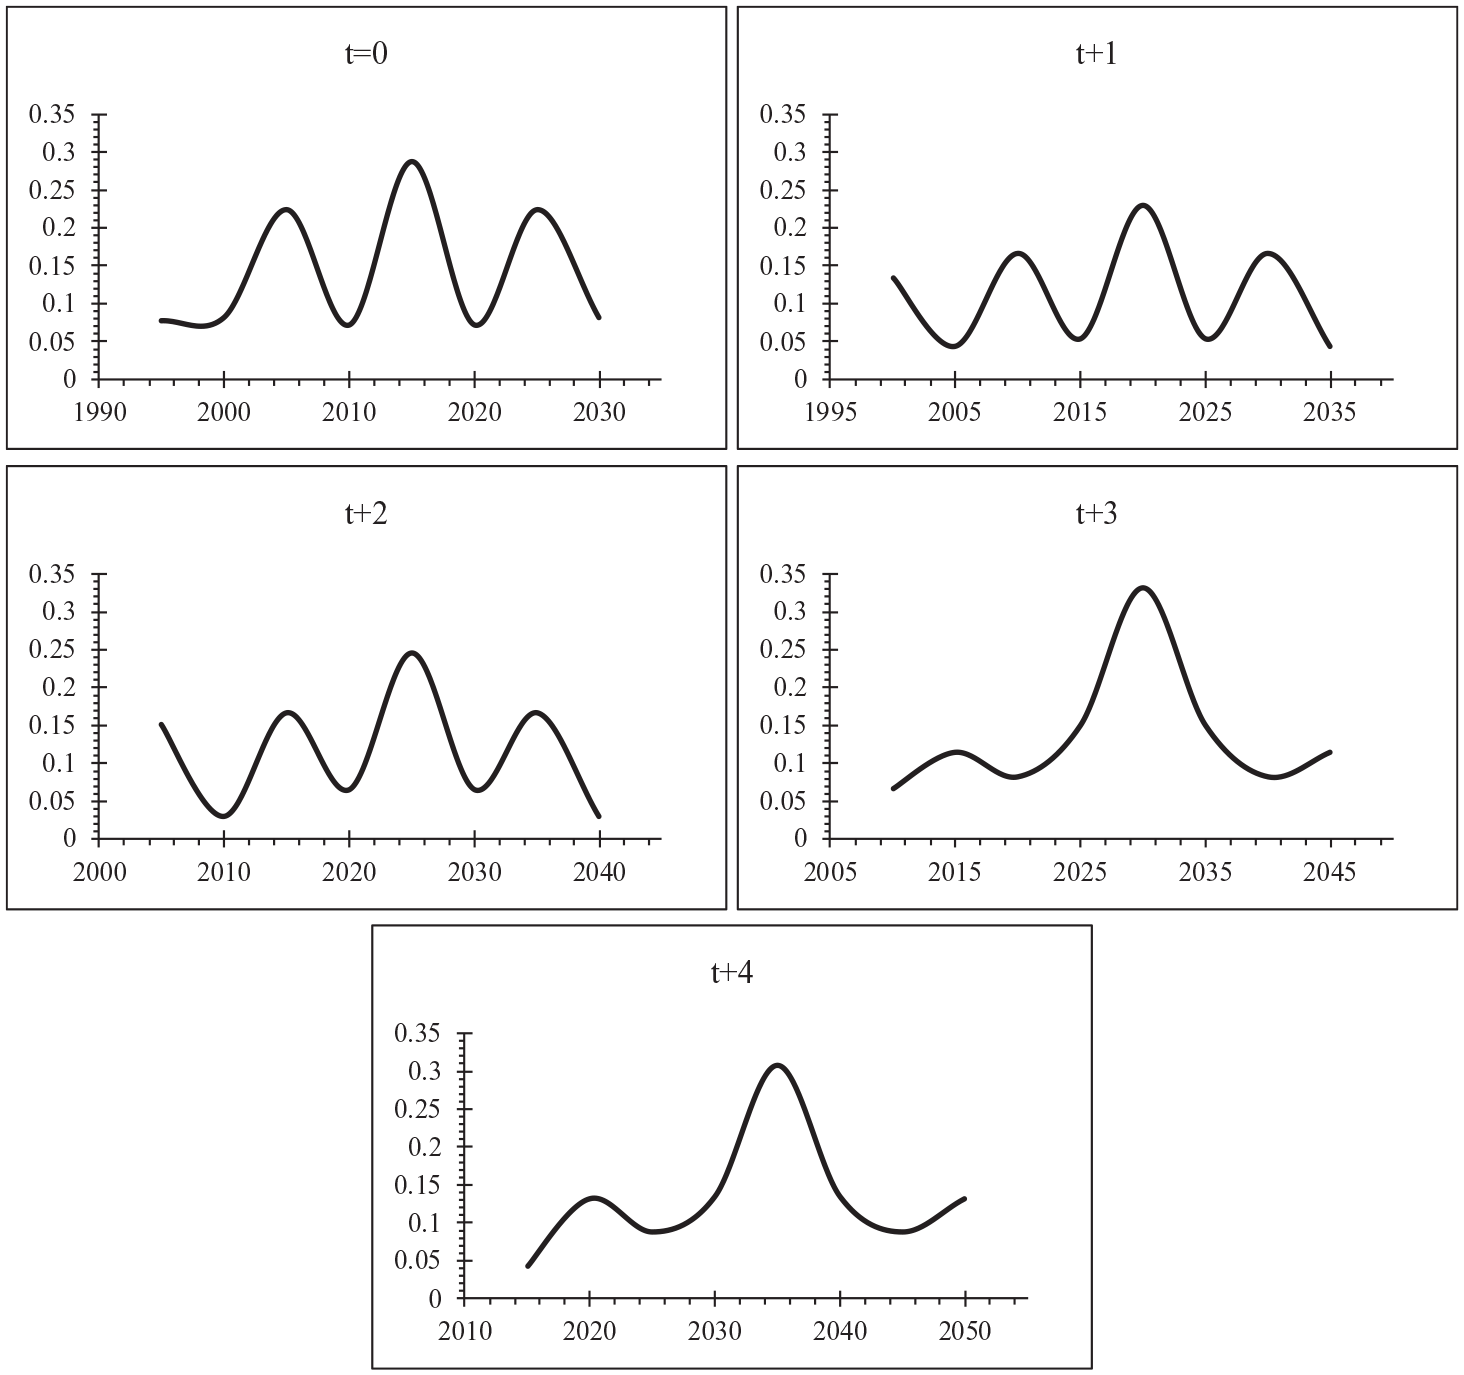
Fourier transformation time series plots of net change of
Scenario 3
As Figure 9 indicates, the t = 0 to t + 3 plots also have the same fundamental 10-year cyclic trends as previously described in Scenarios 1 and 2. However, the t + 4 plot indicates a fundamental change to an impact peak cycle of approximately 15 years duration, with an intervening lag period between peak cycles of approximately 10 years duration. This consequently indicates a significant alteration in the level and nature of dE/dt as the rate of anthropospheric impacts decelerates because of the implementation the scenario’s policies and strategy. However, unlike in the previous two scenarios, the presence of lag period between peak cycles indicates a period of minimal anthropospheric impacts occurring. This consequently suggests that the environmental system could have a period of time to recover to some degree before the next impact peak cycle occurs.
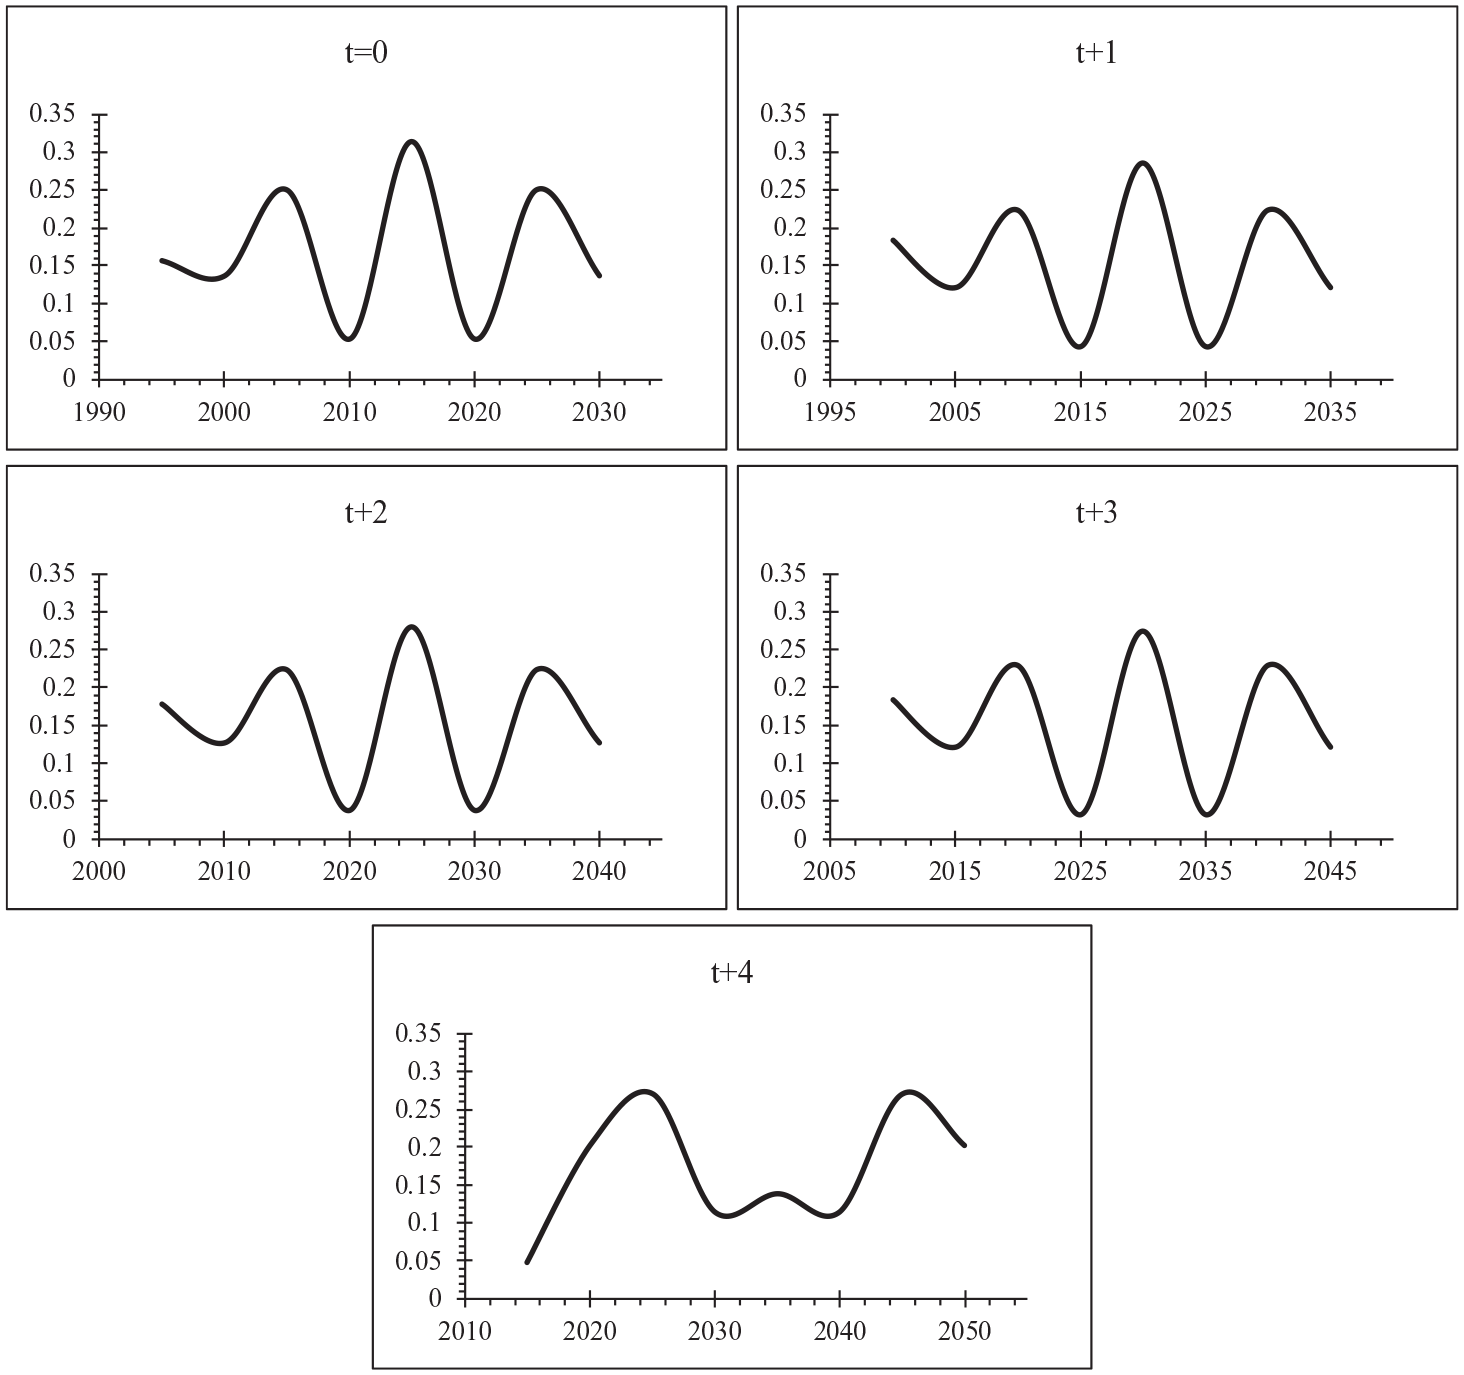
Fourier transformation time series plots of net change of
Scenario 4
As Figure 10 indicates, the t = 0 cycle is characterised by a continuous peak cycle of 10 years duration each, as previous indicated in the other scenarios. However, the t + 1 to t + 4 plots show the most significant and fundamental change of cyclical trends in comparison to the previous three scenarios. Specifically, the cycles are characterised by continuous shallow curvature peaks of approximately 15 years duration, from the start to end of each cycle. This indicates a fundamental change in the level and nature of dE/dt. Specifically, cycles where there is minimal anthropospheric impacts upon the environment in both significance and magnitude. This is a profoundly different dynamic trend in comparison to the previous three scenarios, which were characterised by definitive detrimental impact peak cycles. Therefore, Scenario 4s different dynamics would indicate that its policies and strategic approach are potentially more conducive towards fostering a co-evolutionary environment-human relationship.
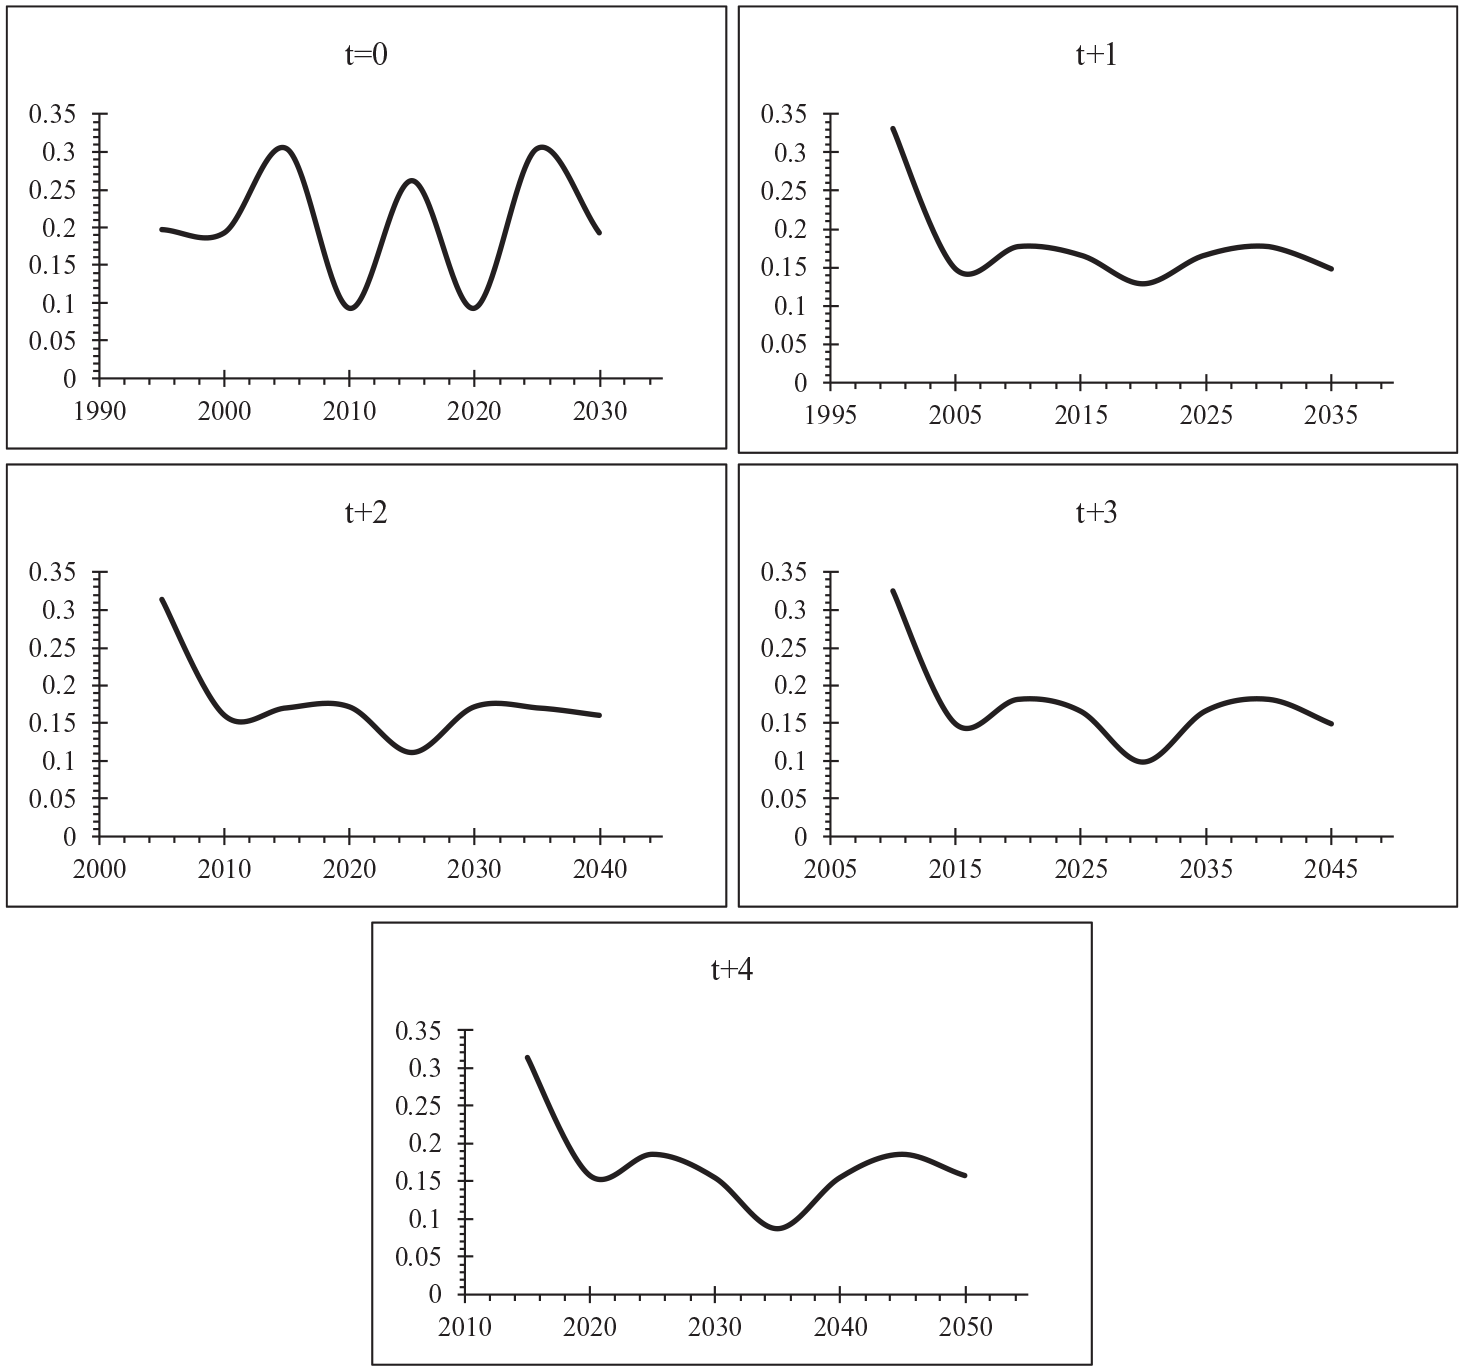
Fourier transformation time series plots of net change of
Discussion
Dynamic analysis
In all four scenarios evaluated,
Scenarios 1–3
In respect to Scenarios 1–3, the primary outcome by the end of the specified period (the year 2050) is a significantly degraded environment. The level and condition of available environmental resources & services may be insufficient to support anthropospheric activities & needs at that time and beyond. This is because the continuous reliance of transforming environmental resources & services to anthropospheric capital (KN → KA) in order to foster economic growth and development, and attempting to reduce social inequalities. However, whilst global economic growth and development may be fostered, economic and social inequalities would widen, as indicated in Supplemental Table 1. This would particularly be the case in economically challenged countries and regions, where environmental resources & services are limited and potentially unable to fulfil the needs of its society, and/or vulnerable to climate change. As a consequence, this weakens the faith of citizens in their national and local governments and public institutions, because of the increasing inequalities and failures to meet their needs.
As indicated in Tables 3–5, and Figures 3–5 the general trend of Scenarios 1–3 is the occurrence of very weak sustainability. There is the potential for unsustainability occurring, if the environment continues to decline in its available resources and services to fulfil and satisfy anthropospheric activities & needs. This is further supported by Figures 7–9 which indicate a fundamental alteration in the level and nature of dE/dt from consistent multiple impact cycles over the specified period (t = 0 → t + 3 plots) to a single pronounced impact cycle (t + 4 plot). As a consequence, this may indicate that dE/dt not only becomes more singular in duration over the specified period, but more intense in significance and magnitude. The exception to this is Scenario 2 (re: Figure 8), where the single impact trend is evident in both the t + 3 and t + 4 plots. This consequently indicates that the acceleration of economic growth in Scenario 2 does alter the level and nature of dE/dt occurring, so that changes occur earlier than in Scenarios 1 and 3.
Scenario 4
As Figure 10 indicates, after the initial period of impacts represented in the t = 0 plot, the level and nature of dE/dt is altered to relatively low levels as represented by the shallow nature of the peak cycle in the t + 1 to t + 4 plots. This strongly indicates a fundamental system transformation occurring in respect to the nature of environment-human system & relationship. Whereas in Scenarios 1–3 there is a strong emphasis on economic growth and development, Scenario 4 is more focussed on primarily social development and environmental mitigation & management. In addition, as indicated in Supplemental Table 1, unlike in the other scenarios’ main policy frameworks, there is the inclusion of population stabilisation as a direct and integral part of the strategic pathway.
The primary focus on social development, population stabilisation, and environmental mitigation & management within Scenario 4, consequently produced the best indicated outcomes of the four scenarios evaluated. This is supported by the results obtained in respect to Figures 6 and 10 which indicates that the level and nature of dE/dt was fundamentally different compared to Scenario 1–3. Specifically, the rate of change to the environment (
Summary of findings
The dynamics of the scenarios clearly indicate the potential significance of population management coupled with managed economic & social development to foster the best co-evolutionary pathway options for sustainability to occur. Furthermore, policies focussed on increasing economic growth levels are insufficient to foster meaningful and conducive sustainability as indicated in Figures 3–5. This is due to unmitigated population levels resulting in the continuous increase of economic and social inequalities, and causing further significant degradation of the available environmental resources & services for future generations beyond 2050, as previously indicated by Phillips (2015, 2020, 2022c). Based upon the results and analysis presented, Scenario 4 is indicated as the best potential option of those evaluated to foster a global co-evolutionary relationship, and thus national and global sustainability.
Broader context
The results in this paper further supports and extends the previous findings of Phillips (2015, 2020, 2022a, 2022b, 2022c). These independently indicated the significant individual and cumulative detrimental influence and impact of population, GDP and greenhouse gases (GHG) upon the level and nature of sustainability at all spatial-temporal scales. The three influencing factors were collectively termed as ‘the triumvirate’ by Phillips (2020, 2022c) to indicate their individual and cumulative role, influence and impacts. Phillips (2020, 2022c) defined the role and interactions of the triumvirate upon detrimentally influencing and impacting on sustainability, within the context of the SDF, as follows: (1) Increases in population levels (size, density, and growth) results in the need for basic and desired goods and services to increase; (2) This results in increased use and/or degradation of available resources and services (environmental and anthropospheric) to fulfil those needs, and thus economic growth and development increases; (3) Consequently, this accelerates GHG emissions from the production and consumption of goods and services in fulfilment of societal needs, and also reduced carbon uptake from flora, fauna and sinks (e.g. ocean, soil etc.) due to degradation and changes to environmental resources, systems, and functions and (4) Therefore, increases in the levels of population, GDP, and GHG detrimentally impacts upon the level and nature of sustainability occurring.
The current literature further supports the fundamental cause-effect relationship and impacts of the triumvirate (Population-GDP-GHG) upon the environment-human system in the following respects. Chang et al. (2019), Dong et al. (2018), Wang and Li (2016), Zhao et al. (2014), Wang and Zhao (2015) and Begum et al. (2015) have all stated that population and economic growth were significant factors in accelerating carbon emissions at the regional to global spatial scale. Rahman et al. (2020) supports this by finding a bidirectional causality relationship between economic growth and CO2 emissions, and a unidirectional causality relationship from population growth to CO2 emissions in respect to South Asia. Cumming and von Cramon-Taubadel (2018) determined that population growth increases GDP in economically developed countries, which rely upon non-ecosystem goods and services, such as infrastructure projects and service industries etc. A statistically significant relationship between population growth and CO2 emissions was determined by Alam et al. (2016) and Weber and Sciubba (2019), in respect to Brazil, China, India, Malaysia and European regions. A positively coupled relationship between economic growth and CO2 emissions in IEA 5 member states was determined by Khan and Hou (2021). Raihan and Tuspekova (2022a, 2022b) managed to go further by quantifying the ratio between economic growth and CO2 emissions at the national level. Specifically, in respect to Kazakhstan and Malaysia, Raihan and Tuspekova (2022a &b) determined that for every 1% increase in economic growth, CO2 emissions increased by 0.34% and 0.78% respectively. This therefore briefly, but fundamentally, demonstrates the cause-effect relationship and interactions between the triumvirate factors that influences and impacts upon sustainability, as previous indicated by Phillips (2015, 2020, 2022a, 2022b, 2022c).
Broader implications
The nature of the relationship between human population and the environment was initially crystallised by Malthus (1798), and then by formalised by Ehrlich (1968), Hardin (1968) and Meadows et al. (1972). And yet, in the development and implementation of sustainability policy and strategy, population management has been somewhat neglected. This is despite being potentially the one of the most fundamental anthropospheric factors in influencing and determining the levels and nature of sustainability occurring at any specified spatial-temporal scale.
The SDGs and its predecessors, tracking back to their origins in the Brundtland report ‘Our Common Future’, (World Commission on Environment and Development (WCED), 1987), have focussed upon primarily economic and social development without effectively addressing the long-term issue and influence of population. As a consequence, this may have partially or significantly contributed towards the current grave predicament that humanity is currently faced with. And yet, a sustainable level of population was one of the seven critical objectives stated by the Brundtland report for environmental and development policies, which were considered as a ‘strategic imperative’ (World Commission on Environment and Development (WCED), 1987). The omission of sustainable population management as a substantive part of the policy and implementation frameworks emanating from the Brundtland report (e.g. Agenda 21, the Millennium Development Goals, and the Sustainable Development Goals), may be a potential significant contributory and causal factor in the rapid development and acceleration of global environmental change.
Therefore, it can be argued based on the previous findings of Phillips (2020, 2022a, 2022c) and the current literature outlined, that the SDGs fail to address a potentially greater and far too long ignored issue by all concerned – managing our own population levels and societal behaviours from economic growth and development, specifically within the thresholds of the Earth System at all spatial-temporal scales. Climate change is the fundamental symptomatic feedback from the resultant increasing and/or significant levels of greenhouse gas emissions, due to increasing and post-optimum levels of population and GDP, which consequently impacts detrimentally upon sustainability, as determined in the case of the UK, USA and China (re: Phillips, 2022a, 2022b). Therefore, the potential implications are that even if greenhouse gas emissions are eliminated by the year 2050, there will be still the significant and fundamental detrimental influence and impacts of global population levels, which are projected to be approximately 9.8–9.9 billion at that time (International Institute for Sustainable Development (IISD), 2020; United Nations, 2017). Such levels will require further increases in the utilisation of available environmental resources and services, as well as significant social and economic development challenges in fulfilling the needs of population and society at all spatial-temporal scales. However, this will be against the backdrop of a fundamentally changed climate that will be hotter, drier, and/or wetter in nature, with increased weather events of intensity, magnitude, and duration (Met Office, 2022; Intergovernmental Panel on Climate Change (IPCC), 2022). As a consequence, this will, and currently is, fundamentally altering the nature and functions of the environment-human system and co-evolutionary relationship. Therefore, whilst the SDGs do have climate change and social & economic development as an integral part of its framework, without population management as an integral part of the SDGs, then climate change mitigation and social & economic development may not reach the desired targets stated within the goals.
The potential causes and consequences outlined are not only a potential and fundamental failure of governments and governance institutions in policy and practice, but also collectively as a society and a species in not recognising and employing the need for population and economic self-restraint. In respect to the failure of humanity, this is question of a complex scientific and philosophical nature that has been debated for many years, and will continue to do so. However, Biermann et al. (2022) has examined the political impact of the SDGs and the potential failures of governments, institutions, and global governance in implementing them. Specifically: (i) the SDGs are predominantly discursive in their impact; (ii) there is a mismatch between the United Nations’ aspirations for the SDGs and their limited transformative impact; (iii) lack of national funding and international co-operation potentially prevents the SDGs having a stronger political impact; (iv) widespread doubt as to whether the SDGs are capable of guiding societies to greater planetary ecological integrity due to little normative or institutional change and (v) the design of SDGs has contributed to a lack of ambition and coherence to foster focused transformative change towards planetary ecological integrity (Biermann et al., 2022: 796–798).
The issues outlined by Biermann et al. (2022) would seem to indicate that not only are national governments and global institutions continuing with Scenario 1 (the Same pathway; see Supplemental Table 1), but potentially even failing to adequately implement the SDGs to any significant degree. It therefore raises the fundamental question whether the SDGs are intended to be a true pathway to action, or merely words with no meaningful substance and significant intent whatsoever. If national governments and global institutions are truly sincere in their desire to foster a better world environmentally, socially and economically – Then, instead of creating policies such as the SDGs that would appear to be a demonstration of their common wish for a better world, it is now the time to set aside once and for all national self-interest, and implement global co-ordinated and co-operative actions to safeguard humanity’s and planetary well-being and survival, given the threats to both. Such actions must be prepared to include and address the most fundamental and difficult issues in fostering a true co-evolutionary relationship, such as population management, economic and social transformation and global ecological restoration and management, if meaningful sustainability at all spatial-temporal scales is to be achieved.
Conclusion
This paper has conducted a detailed quantitative sustainability analysis of the four development scenarios evaluated by the Earth3 model of Randers et al. (2018, 2019). The results have indicated that Scenario 4 (Smarter) was the best potential option of the scenarios evaluated for producing desirable sustainability outcomes. The other scenarios produced a much-degraded environment and a relatively stagnant level of very weak sustainability over the specified period. The dynamic analysis and discussion of the broader context and implications have highlighted the role of the triumvirate, the failures of the SDGs in addressing population management as part of the approach to mitigate climate change and fostering social & economic development, and the political impact of the SDGs.
The paper has evaluated and determined the potential sustainability outcomes for some of the strategic co-evolutionary pathway options available. All of the options evaluated highlight the present inherent risks to humanity and the planet unless some fundamental transformation of the environment-human relationship occurs. Unless humanity grasps the nettle of fundamental transformative change to our relationship with the environment, then there may not be much of either to speak or write about. As Lovelock (2006) observed: ‘if we continue business as usual, our species may never again enjoy the lush and verdant world we had only a 100 years ago’. Humanity needs to collectively and finally embrace and act upon the warnings of Malthus (1798), Ehrlich (1968), Hardin (1968), Meadows et al. (1972) and Lovelock (2006), as well as numerous others. Unless this occurs, then humanity will perhaps deservedly suffer the dire and harsh consequences of its selfish conceit in respect to its supposed superiority over other species and the planet, because as Feynman (1986) stated: ‘nature cannot be fooled’. And yet, we as a species need our other fellow species (flora and fauna) and the planet far more than they need us, or even want us.
Therefore, not only does humanity need to change its actions and activities, but also needs to change on an individual, societal, and species basis. This means developing the characteristics and behaviours necessary to adopt and maintain a conducive co-evolutionary relationship. Perhaps the best summation of humanity’s current pathway comes from the end of the film ‘The Rocky Horror Picture Show’: ‘And crawling. . . on the planet’s face. Some insects. . . called the human race. . . lost in time, and lost in space. . . and meaning’ (Sharman and O’Brien, 1975). Whilst it is an unusual source for a citation in such a serious scientific paper as this one is; the paper would respectfully point out that wisdom and knowledge has no boundaries, and nor should it. In many ways, humanity has acted as insects to obtain and utilise the environmental resources & services needed to fulfil its requirements from wherever and whoever. This has been at the cost of other humans and/or species and the environment, without any thought or consideration of the impacts caused. Therefore, unless we as a species change our ways once and for all, then we are all truly lost – Not only to ourselves, but also to the planet, and the universe yet to be explored.
Supplemental Material
sj-docx-1-anr-10.1177_20530196231170367 – Supplemental material for Quantitative and dynamic scenario analysis of SDGs outcomes upon global sustainability 1990–2050
Supplemental material, sj-docx-1-anr-10.1177_20530196231170367 for Quantitative and dynamic scenario analysis of SDGs outcomes upon global sustainability 1990–2050 by Jason Phillips in The Anthropocene Review
Footnotes
Declaration of conflicting interests
The author declared no potential conflicts of interest with respect to the research, authorship, and/or publication of this article.
Funding
The author received no financial support for the research, authorship, and/or publication of this article.
Supplemental material
Supplemental material for this article is available online.
Notes
References
Supplementary Material
Please find the following supplemental material available below.
For Open Access articles published under a Creative Commons License, all supplemental material carries the same license as the article it is associated with.
For non-Open Access articles published, all supplemental material carries a non-exclusive license, and permission requests for re-use of supplemental material or any part of supplemental material shall be sent directly to the copyright owner as specified in the copyright notice associated with the article.