
Abstract
The proposed Anthropocene Global Boundary Stratotype Section and Point (GSSP) candidate site of West Flower Garden Bank (27.8762°N, 93.8147°W) is an open ocean location in the Gulf of Mexico with a submerged coral reef and few direct human impacts. Corals contain highly accurate and precise (<±1 year) internal chronologies, similar to tree rings, and their exoskeletons are formed of aragonite and can be preserved in the rock record. Here we present results from a large Siderastrea siderea coral (core 05WFGB3; 1755–2005 CE) sampled with annual and monthly resolutions that show clear markers of global and regional human impacts. Atmospheric nuclear bomb testing by-products (14C, 239+240Pu) have clear increases in this coral starting in 1957 for 14C and the first increase in 1956 for 239+240Pu (potential bases for the Anthropocene GSSP). Coral δ13C declined especially after 1956 consistent with the Suess effect resulting from the burning of fossil fuels. Coral skeletal δ15N starts to increase in 1963 corresponding with the increase in agricultural fertilizers. Coral Hg concentrations (1933–1980) loosely track fluctuations in industrial pollution and coral Ba/Ca increases from 1965–1983 when offshore oil operations expand after 1947. Coral temperature proxies contain the 20th-century global warming trend whereas coral growth declines during this interval.
Introduction
The nuclear age first left its imprint on the Earth in World War II with the detonation of atomic bombs. In the following years, atmospheric nuclear weapons testing was conducted predominately in remote Pacific islands such as Bikini and Eniwetok atolls. Scientists found corals in these atolls contained radioactive bands that correlate to the weapons testing dates and thus one could determine coral growth rates (Knutson et al., 1972). X-ray images (i.e. X-radiographs) of cross-sections cut from coral colonies also reveal high- and low-density bands within the coral skeleton, similar to tree rings, that correlated to radioactive bands and thus years of nuclear testing (Buddemeier et al., 1974; Knutson et al., 1972). Corals are colonial organisms with coral polyps living on top of their aragonite exoskeletons they deposit with varying skeletal density throughout the year as they grow. These annual density bands give scientists time markers for “reading” the environmental history contained in the coral’s skeleton, similar to dendrochronology (Lough and Cantin, 2014). The ability to locate individual years in the coral skeleton allows researchers to correlate the coral’s skeletal geochemical history to calendar dates with high accuracy. Furthermore, these nuclear weapons testing and the radioactive isotope “bomb spikes,” which are present in coral skeletons, have been suggested as the global marker for the Anthropocene Global Boundary Stratotype Section and Point (GSSP) (Waters et al., 2015). The Anthropocene Working Group organized preparatory activities for formalizing the Anthropocene, including events leading to the submission of GSSP proposals, to facilitate a binding decision that the start of the Anthropocene is in the mid-20th century and should align with stratigraphic signals. These activities and proposals are detailed in the introductory article in this special issue (Waters et al., 2023).
This study will examine several radioactive isotopes and other potential Anthropocene markers in detail for a Siderastrea siderea coral located in West Flower Garden Bank (WFGB), one of two coral reefs within the Flower Garden Banks National Marine Sanctuary (FGBNMS) in the northern Gulf of Mexico (GoM). The tropical Atlantic coral species S. siderea is a particularly good species for archiving the past since it has a relatively slow growth rate (3–6 mm year−1), which means an average-sized coral colony (1–2 m) is older (200–400 years) than faster-growing coral species of the same size and therefore provides longer skeletal records. There is a broad scope of prior geochemical research with S. siderea, thus the reason we selected this species for the Anthropocene GSSP candidate; see the review on this species in the Supplemental Material.
The Flower Garden Banks (FGB) are located in the northern GoM at the edge of the wide-continental shelf about 185 km away from the Louisiana and Texas coastline and far from river runoff and coastal upwelling (Figure 1). FGBs’ coral reefs are primarily comprised of large boulder-shaped corals and the reefs have ~50% live coral coverage (Schmahl et al., 2008), which is high for Atlantic coral reefs. Furthermore, FGB corals have so far been minimally affected by coral bleaching (Johnston et al., 2019), a condition caused by rising seawater temperatures threatening coral reefs worldwide, due to FGB’s higher latitude (~28°N), which is near the northernmost limits of coral reef-supporting conditions, and its deeper water depth (18–40 m) than most coral reefs. Fishing is restricted in the sanctuary boundaries to only conventional single hook and line gear. Divers are the typical visitors to FGBNMS and they travel there from April to July, before hurricane season peaks in August and September, and stay on live-aboard boats since the transit time is 10–12 hours. In the past 12 years (2009–2021), FGBNMS averaged about 800 divers per year, thus impacts from divers compared to other Atlantic coral reefs are minimal (personal communication Johnson 2022).
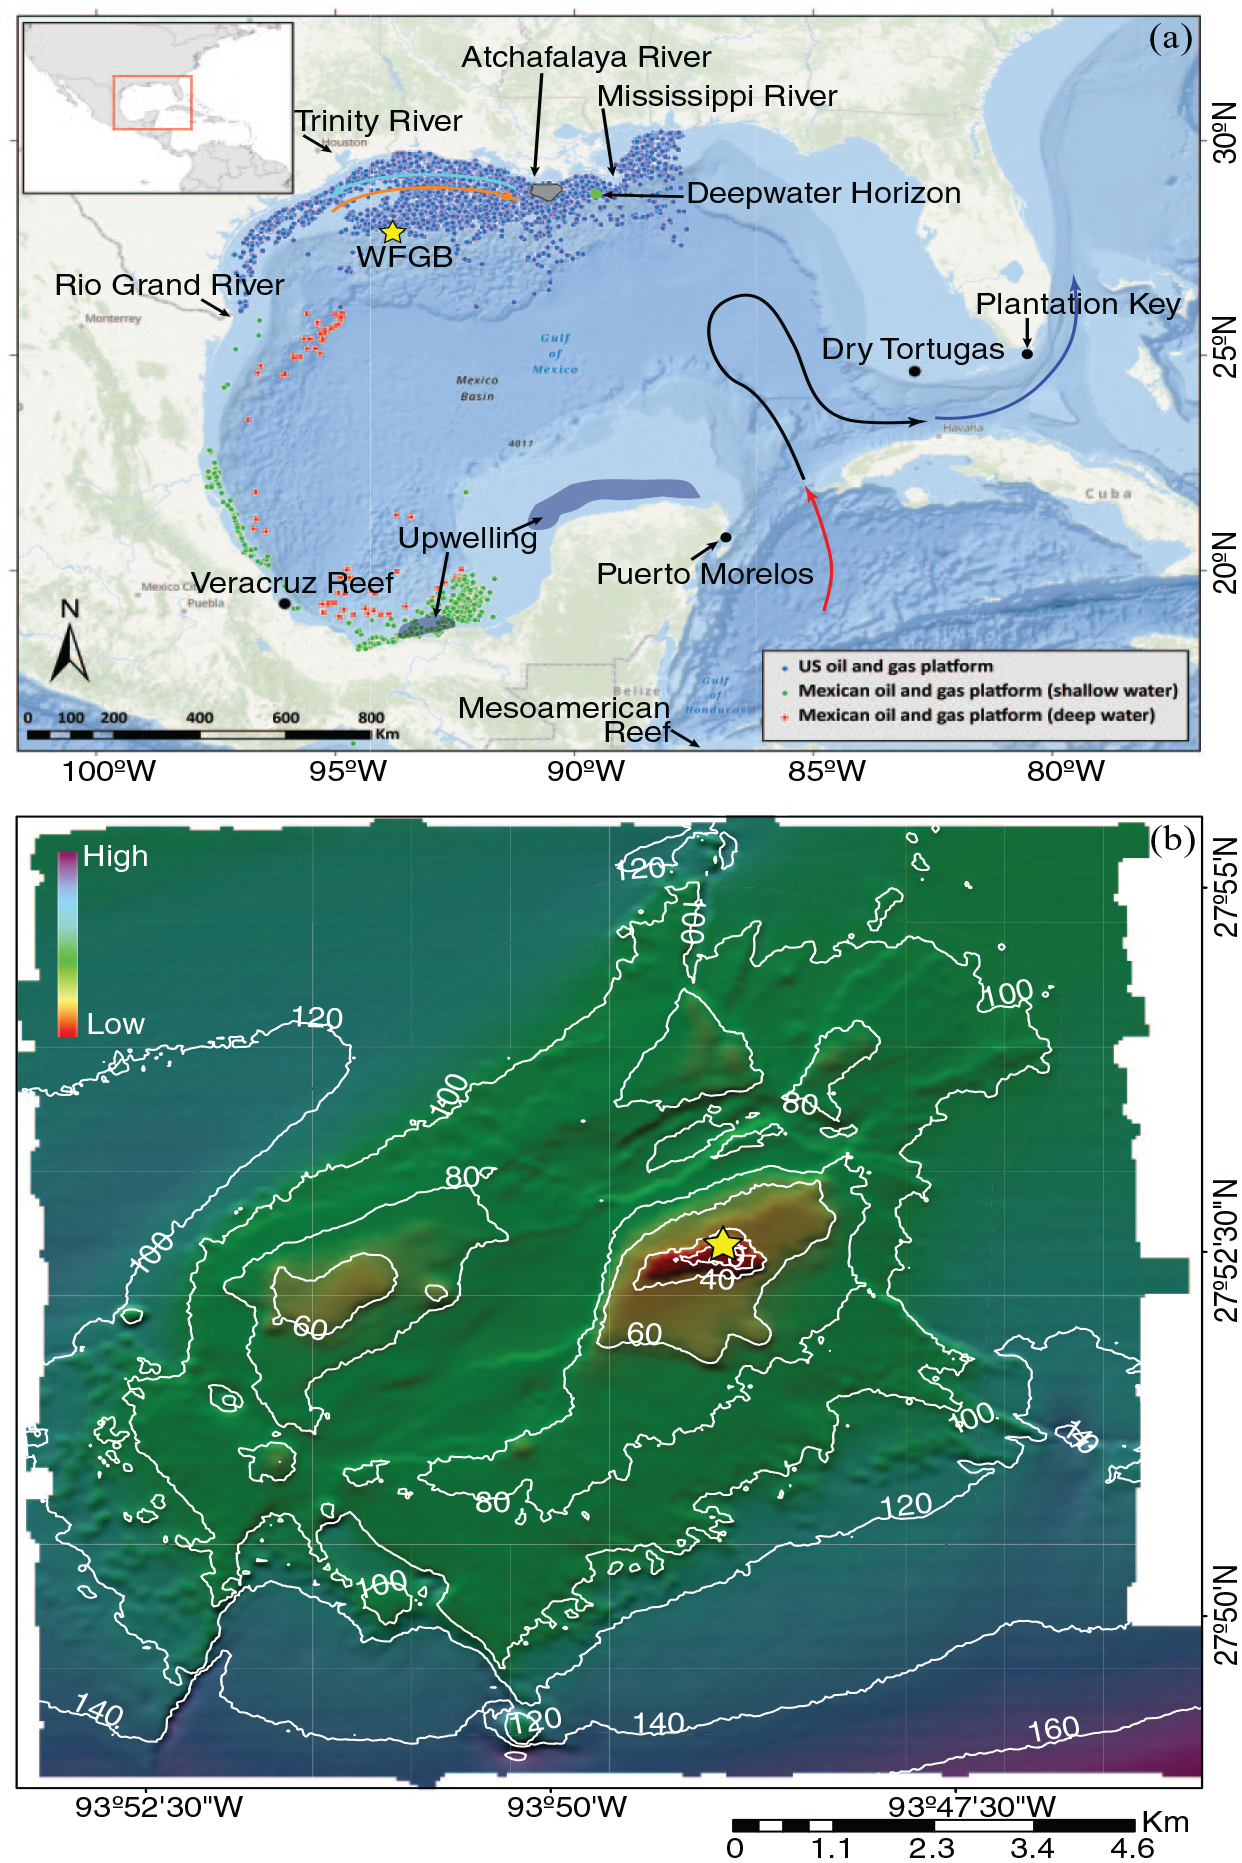
The location of west Flower Gaeden Bank (WFGB) (yellow ★) in the GoM of the western Atlantic Ocean: (a) bathymetry map of the GoM and its location with respect to North America (inset). Curved arrows are the approximate locations of the predominant currents, the Caribbean Current entering the GoM (red line), the Loop Current (black line) that leaves the gulf becoming the Florida Current (blue line). Seasonal northern GoM coastal currents (winter cyan arrow and summer orange arrow) transport the Mississippi and Atchafalaya Rivers’ discharge along the coastline. The approximate seasonal upwelling zones are dark blue areas. Locations of the United States (US)’ (www.boem.gov) and Mexico’s (mapa.hidrocarburos.gob.mx) oil platforms are small circles. Locations of other relevant sites are marked (•), (b) bathymetry map of WFGB (https://pubs.usgs.gov/of/2002/0411/data.html) noting the location of the S. siderea colony cored for this study (yellow ★). Reproduced in color in online version.
The remote location of the FGBNMS means that these coral reefs are less vulnerable than coastal coral reefs to anthropogenic pollution from the land and are less disturbed by fishing and diving; one of the requirements for the Anthropocene GSSP (Waters et al., 2023). Furthermore, this means there is no local impact or signal in the coral’s skeletal geochemistry, thus corals in FGBNMS are recording environmental histories that are regional or global rather than local. The candidate site reported here is within the FGBNMS and is protected and actively managed by the National Oceanic Atmospheric Administration since 1992 with cooperation from fishermen, the oil industry, divers, and conservation groups. FGB has been studied since the 1930s with many books, papers, and annual scientific reports summarizing efforts published by FGBNMS. However, these coral reefs are not immune to anthropogenic influence. The formation of salt domes also creates space under the seabed in which oil and gas can collect. More than 9000 offshore platforms have operated in the northern GoM since 1982 (Figure 1a) and several offshore petroleum platforms have operated within 30 km of the FGB (Pulster et al., 2020), yet there have not been any documented changes in the health of the coral reef caused by oil operations (Office of National Marine Sanctuaries, 2008). Furthermore, FGBNMS was not impacted by the Deepwater Horizon oil spill in 2010, which is located ~540 km from FGBNMS (Figure 1a; Johnston et al., 2021). The FGB coral reefs exist due to the rising salt domes and the salt domes themselves are indirectly a contributing reason to the predicted demise of coral reefs due to global warming (Dee et al., 2019; Frieler et al., 2013) by providing locations for crude oil to accumulate. Paradoxically, the FGB coral reefs are perhaps the healthiest in waters of the United States (US) and the Atlantic Ocean and are poised to survive longer than other coral reefs (Lawman et al., 2022), and thus another reason why we selected WFGB as a candidate site for the Anthropocene GSSP.
Materials and methods
Geographic settings of the core site
The GoM is a semi-enclosed basin located in the western Atlantic Ocean just northwest of the Caribbean Sea surrounded by the US, Mexico, and Cuba (Figure 1a). The gulf has an area of over 1,500,000 km2 where one-third of that area is a broad gently sloping continental shelf with a water depth of less than 200 m and also contains “salt domes” rising toward the ocean surface. Some of these submerged salt domes reach water shallow enough to have coral reefs form in the last 12,000 years after the Last Glacial Maximum when global sea level rose from the lowstand (Slowey et al., 2008).
Waters in the GoM are a mixture of riverine waters with warm and saltier waters from the Caribbean Sea, which is a mixture of North and South Atlantic waters (Wilson and Johns, 1997), brought into the gulf by the Loop Current through the Yucatan Channel and exiting through the Straits of Florida to ultimately form the Gulf Stream (Figure 1a; Alvera-Azcárate et al., 2009). The northern extent of the Loop Current varies seasonally and sheds eddies that migrate and persist for many weeks (Alvera-Azcárate et al., 2009; Sturges and Evans, 1983). The surface water temperature in the northern gulf can reach 31°C in the summer and cools to 18°C in winter.
The primary freshwater source to the GoM is the Mississippi River, which accounts for 64% of the total freshwater discharge into the GoM (Darnell and Defenbaugh, 2015) and other notable rivers near FGBNMS are the Atchafalaya, Trinity, and Rio Grande (Figure 1a). Mississippi River discharge into the northern GoM contains immense amounts of nutrients that increase primary production in the ocean surface waters and lead to eutrophication that forms one of the largest hypoxic zones in the world along the Louisiana coast (Rabalais et al., 2002). This river water moves westward along the coast by seasonally varying cross-shelf currents (Zavala-Hidalgo et al., 2014).
Field collection of core, sampling, and core imagery
A team of divers from FGBNMS, Florida Keys National Marine Sanctuary, US Geological Survey, and Texas A&M University collected coral cores from WFGB in May 2005 under permit FGBNMS-2005-002. They used an underwater hydraulic drill system with a 4-inch (101.6 mm) diameter diamond-tipped drill bit to vertically drill down from the top center of the coral colony. A 1.74 m-long cylindrical core (05WFGB3) was collected in five sections from a large boulder-shaped S. siderea coral colony (27.8762°N, 93.8147°W) at a water depth of 21.3 m. The coral colony is still on the reef and could be cored again with the proper permits and in cooperation with FGBNMS. The core 05WFGB3 is on loan from the FGBNMS and will ultimately be returned to them. Details on cutting the core, X-ray imaging, and preparations for extracting samples are detailed in the Supplemental Material.
Coral X-radiographs and scans were used to determine annual extension (one component of coral growth) per year, locate sampling paths, and assign years. A year was assigned to each density band couplet (light and dark) starting from the core top and counting down to the bottom of the core. The ruler tool in Adobe Photoshop was used to measure the distance from the top of successive high-density dark bands (~January) and distances were recorded in the measurement log. Three paths were measured for each slab and the results for each year were averaged together. The precision of this method is limited by the resolution of the X-radiographs, clarity of the density bands in the X-radiographs, and user experience; therefore, the precision for extension measurements was estimated by the standard error of the mean (>±0.174 mm, 1σ).
Two sampling resolutions were used for geochemical analyses, annual for radiogenic isotopes, δ15N, and Hg, which require more mass, and monthly for trace elemental ratios and stable isotope ratios (Table 1). Annual coral samples were removed from coral slabs (slabs C and D) using X-radiographs to aid in cutting for each year starting in winter (assuming January) to the next year. For monthly samples, an micromill system was used to extract monthly samples (0.4 mm increment sample−1) from the coral slab surface (DeLong et al., 2011; Weerabaddana et al., 2021), see Supplemental Material. Divots (1.5 mm deep) were made at every 12th sample, which are visible in the coral scans and X-radiographs, as markers to assist in assigning time to the coral geochemistry.
Sample details for geochemical analysis.
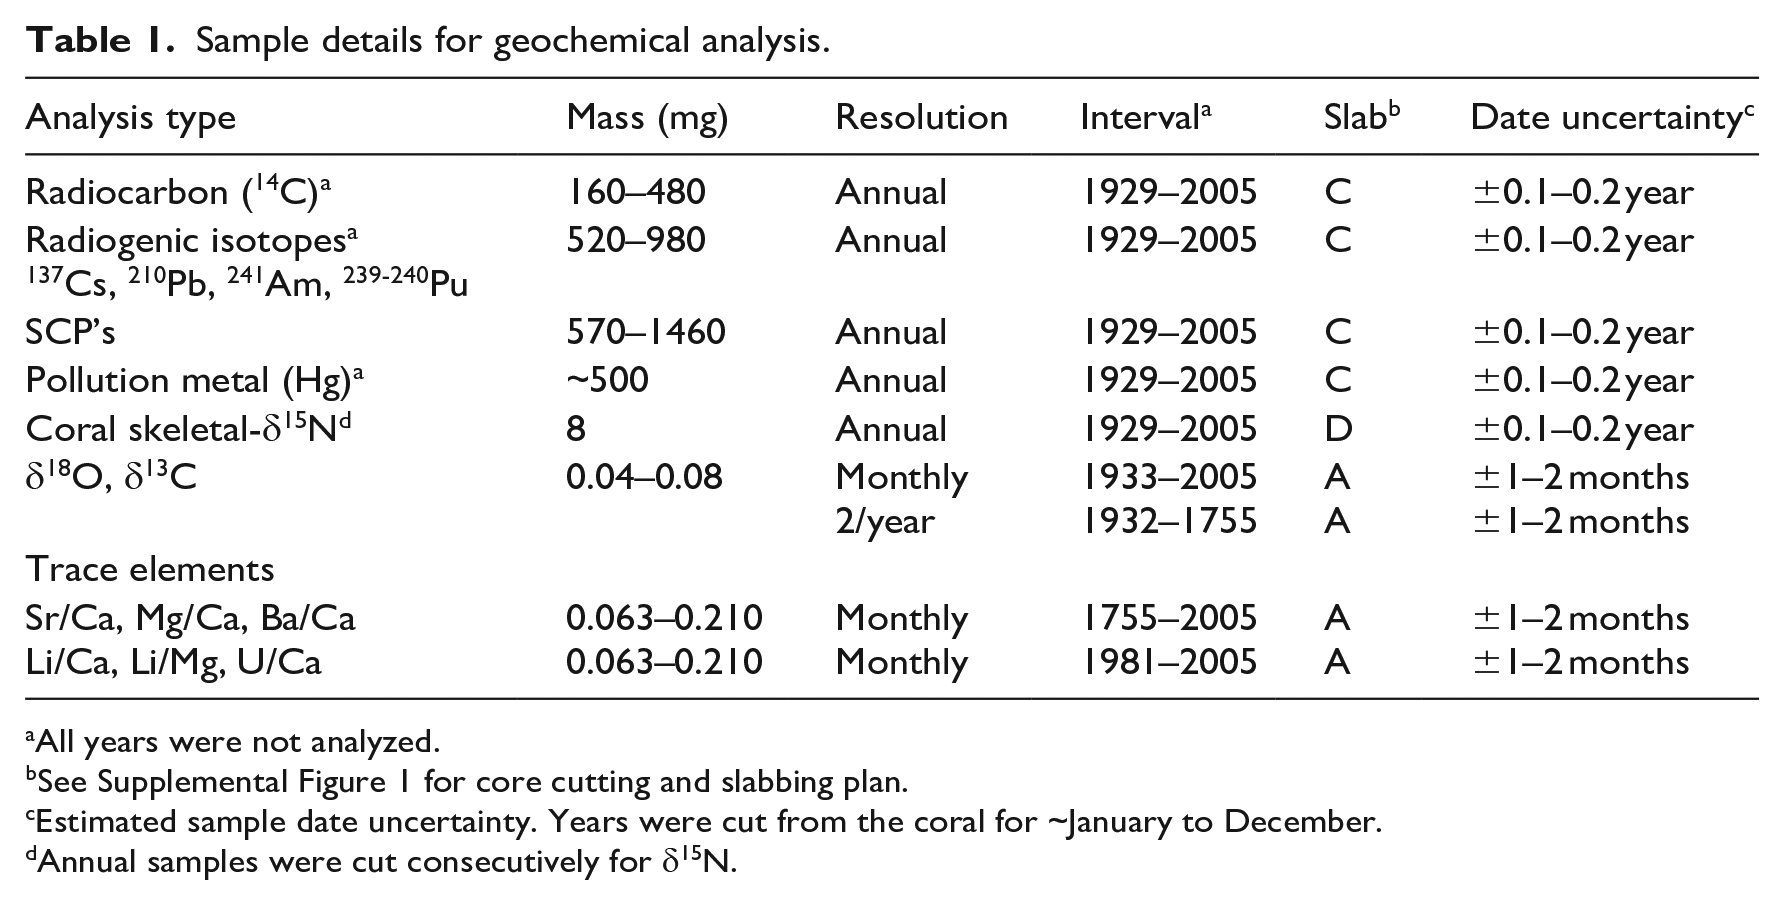
All years were not analyzed.
See Supplemental Figure 1 for core cutting and slabbing plan.
Estimated sample date uncertainty. Years were cut from the coral for ~January to December.
Annual samples were cut consecutively for δ15N.
Chronological controls
Chronologies for corals were determined by counting annual density band couplets from the top of the core when collected live and the collection date is known (May 2005 for core 05WFGB3) down core for each density band couplet. Two coral samples were dated with high precision 230Th dating (<±1 year for corals <100 years old) (Shen et al., 2003, 2008) (Supplemental Figure 5). U-Th isotopic analysis was conducted in the High-Precision Mass Spectrometry and Environmental Change Laboratory at National Taiwan University with a Thermo Electron Neptune multi-collector inductively coupled plasma mass spectrometer (Cheng et al., 2013; Shen et al., 2012).
Time assignment for monthly data was performed with the ~monthly coral Sr/Ca using Analyseries software (Paillard et al., 1996) and then applied to the other geochemical series. Monthly Sr/Ca were aligned to a monthly sea surface temperature (SST) time series (ERSSTv3b for the 2° grid box centered on WFGB, 28°N, 94°W) (Smith et al., 2008) back to 1870 CE and then using a time series of repeating monthly SST climatology for the older coral sections. Coral Sr/Ca maxima were assigned to the coldest month each year and coral Sr/Ca minima to the warmest month each year. S. siderea can grow faster in summer when compared with winter; therefore, time assignment using only two tie-points per year may be biased toward the summer; therefore, mid-spring and mid-autumn tie points were used (DeLong et al., 2016). After time assignment, each time series was linearly interpolated to even monthly time intervals. The X-radiograph chronology was verified by matching the coral Sr/Ca annual cycles using the divots in the coral scans and X-radiographs.
Anthropocene proxies
Methods for radiogenic and stable isotopes and trace elements listed in Table 1 appear in Supplemental Material.
Numerical analysis
Means are reported with ±1 standard deviation. Correlation analysis is Pearson correlation using degrees of freedom. Significance of linear trends was assessed with the Mann-Kendall test (Greene et al., 2019). Change points (ischange.m in MATLAB) were detected for changes in linear slope, and/or means for a specified number of changes (Killick et al., 2012). Statistical tests assume a 5% significance level.
Results
Chronology
The entire core 05WFGB3 spans 1755–2005 CE as determined by counting annual density bands in the X-radiographs and annual cycles in monthly coral Sr/Ca and verified with two 230Th dates (Supplemental Figure 5, Supplemental Table 2). There is no evidence of diagenesis in this coral core and we find no evidence of post-depositional alteration in the X-radiographs (Supplemental Figures 2–5). The core section containing 1932–2005 (05WFGB3-1), which is the interval of interest for the GSSP markers, is continuous and has no breaks except for ones that occurred in the laboratory for which there are no missing time (Supplemental Figures 2–5). The coral X-radiographs for the three slabs have clear annual density bands that correlate among the slabs and the years are easily marked. The monthly coral Sr/Ca and δ18O variations co-vary with temperature records for FGB (see section Sr/Ca, Li/Ca, Li/Mg, and U/Ca; and Weerabaddana et al., 2021) further supporting the accurate-to-the-year chronology assignment (1932–2005 CE) for core section 05WFGB3-1. Further coral chronology results for the remainder of the core (1755–1931 CE) before the proposed Anthropocene base are located in Supplemental Material.
Calculation of growth rates
Measurements of the X-radiographs for each year resulted in an overall average annual linear extension of 5.99 (±0.61, 1σ) mm for 1928–2004 CE, the interval for Anthropocene markers in this report (Figure 2). The maximum is 7.81 mm (1934) and the minimum is 3.58 mm (1932), the year of the break between core sections, which contributed to this low extension year. There is a significant decreasing trend (0.0092 mm year−1) in coral annual extension during this interval resulting in a decrease in coral growth of 0.70 mm in 76 years. The minimum annual linear extension is greater than the threshold for growth-related effects for this species (<1.7 mm) for coral geochemical proxies (DeLong et al., 2016; Kuffner et al., 2017); therefore, there is no concern with growth-related effects for this coral’s geochemistry.
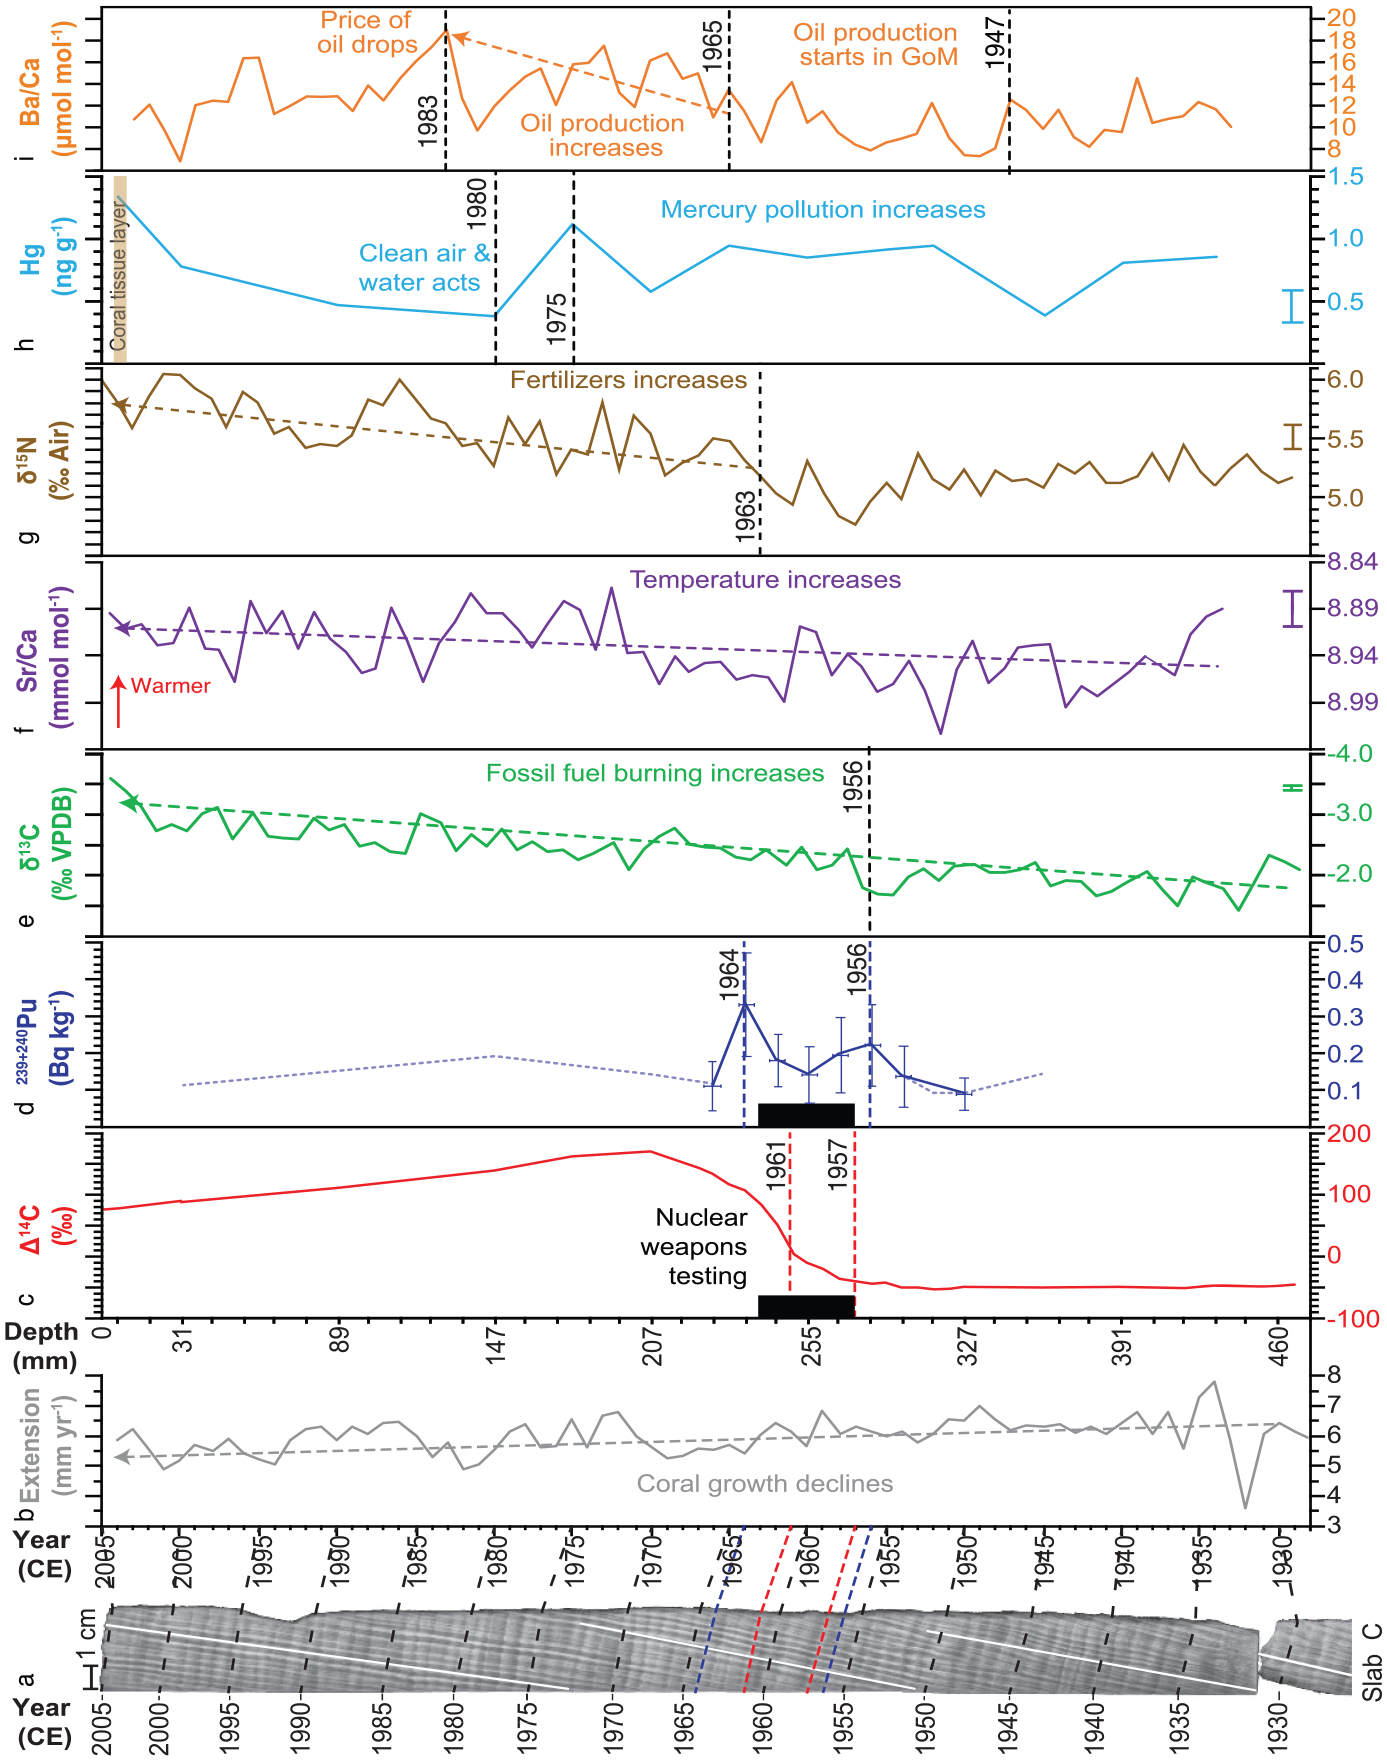
Composite of annually-resolved proxies from core 05WFGB3: (a) X-radiograph of slab C with examples of counting path (white lines) and every 5 years noted (labels on ~January) connected to (b) years in the coral annual extension (black dashed lines). Years for the proposed base of the Anthropocene markers are noted as red dashed lines in (a and c) and secondary marker with blue dashed lines in (a and d) with blue dotted line is limit of detection values (sample activity is less than this value) rather than actual measured activity. (b) Annual extension was determined from coral growth direction noted as white lines in (a). Depth from core top for (c–i) is aligned with extension (b) and years (a) with depth noted for January of each year or the base of the annual sample for the annually-sampled proxies (c, d, g, and h) and the annual average from monthly samples (e, f, and i). Black boxes span 1957–1963, the period of extensive atmospheric thermonuclear weapons testing (c and d). Linear trends (dashed lines with arrowheads) are significant (1%). Error bars represent analytical precision (1σ) and if not plotted analytical precision is smaller than the line weight. Dating uncertainties for each proxy are given in Table 1. Reproduced in color in online version.
Coral colonies do not grow at a constant rate but vary year-to-year and within the colony (Figure 2, Supplemental Figure 6) because the coral colony is dome-shaped and the coral grows vertically and horizontally at different rates. Boulder-shaped massive corals have internal centimeter-scale growth structures that can vary within the colony; however, S. siderea has relatively simple internal structures compared to other Atlantic massive coral species and thus has more internally reproducible geochemical records that result in robust geochemical time series (DeLong et al., 2011, 2016). Coral annual density couplets visible in X-radiographs provide highly accurate chronologies with continuous deposition of the coral skeleton with rare occurrences of missing and false years as are found in tree-ring chronologies (Black et al., 2019; DeLong et al., 2013).
Radioisotopes (and guidance for other proxies)
Radiocarbon – Core 05WFGB3 exhibits low (−50‰) Δ14C from 1920 to 1957 CE followed by an increase observed after 1957 (depth from core top to January 1957 = 284.1 mm) with the largest year-to-year increase occurring from 1961 to 1962 and increasing to a maximum in 1970 CE (depth = 207.2 mm) (Figure 2, Table 2, Supplemental Figure 7). For change point analysis (Killick et al., 2012), we tested 1 to 4 change points and found consistent results. We found this analysis is sensitive to the direction of the time series and results vary by 1 year; we used the earliest year for the proposed Anthropocene marker. The coral Δ14C represents the transfer of the atmospheric Δ14C signal to the surface ocean (i.e. the actual bomb peak observed in the atmosphere after 1954 in the northern hemisphere and 1955 in the southern hemisphere).
Radiocarbon measurements for core 05WFGB3 carbonate analysis.
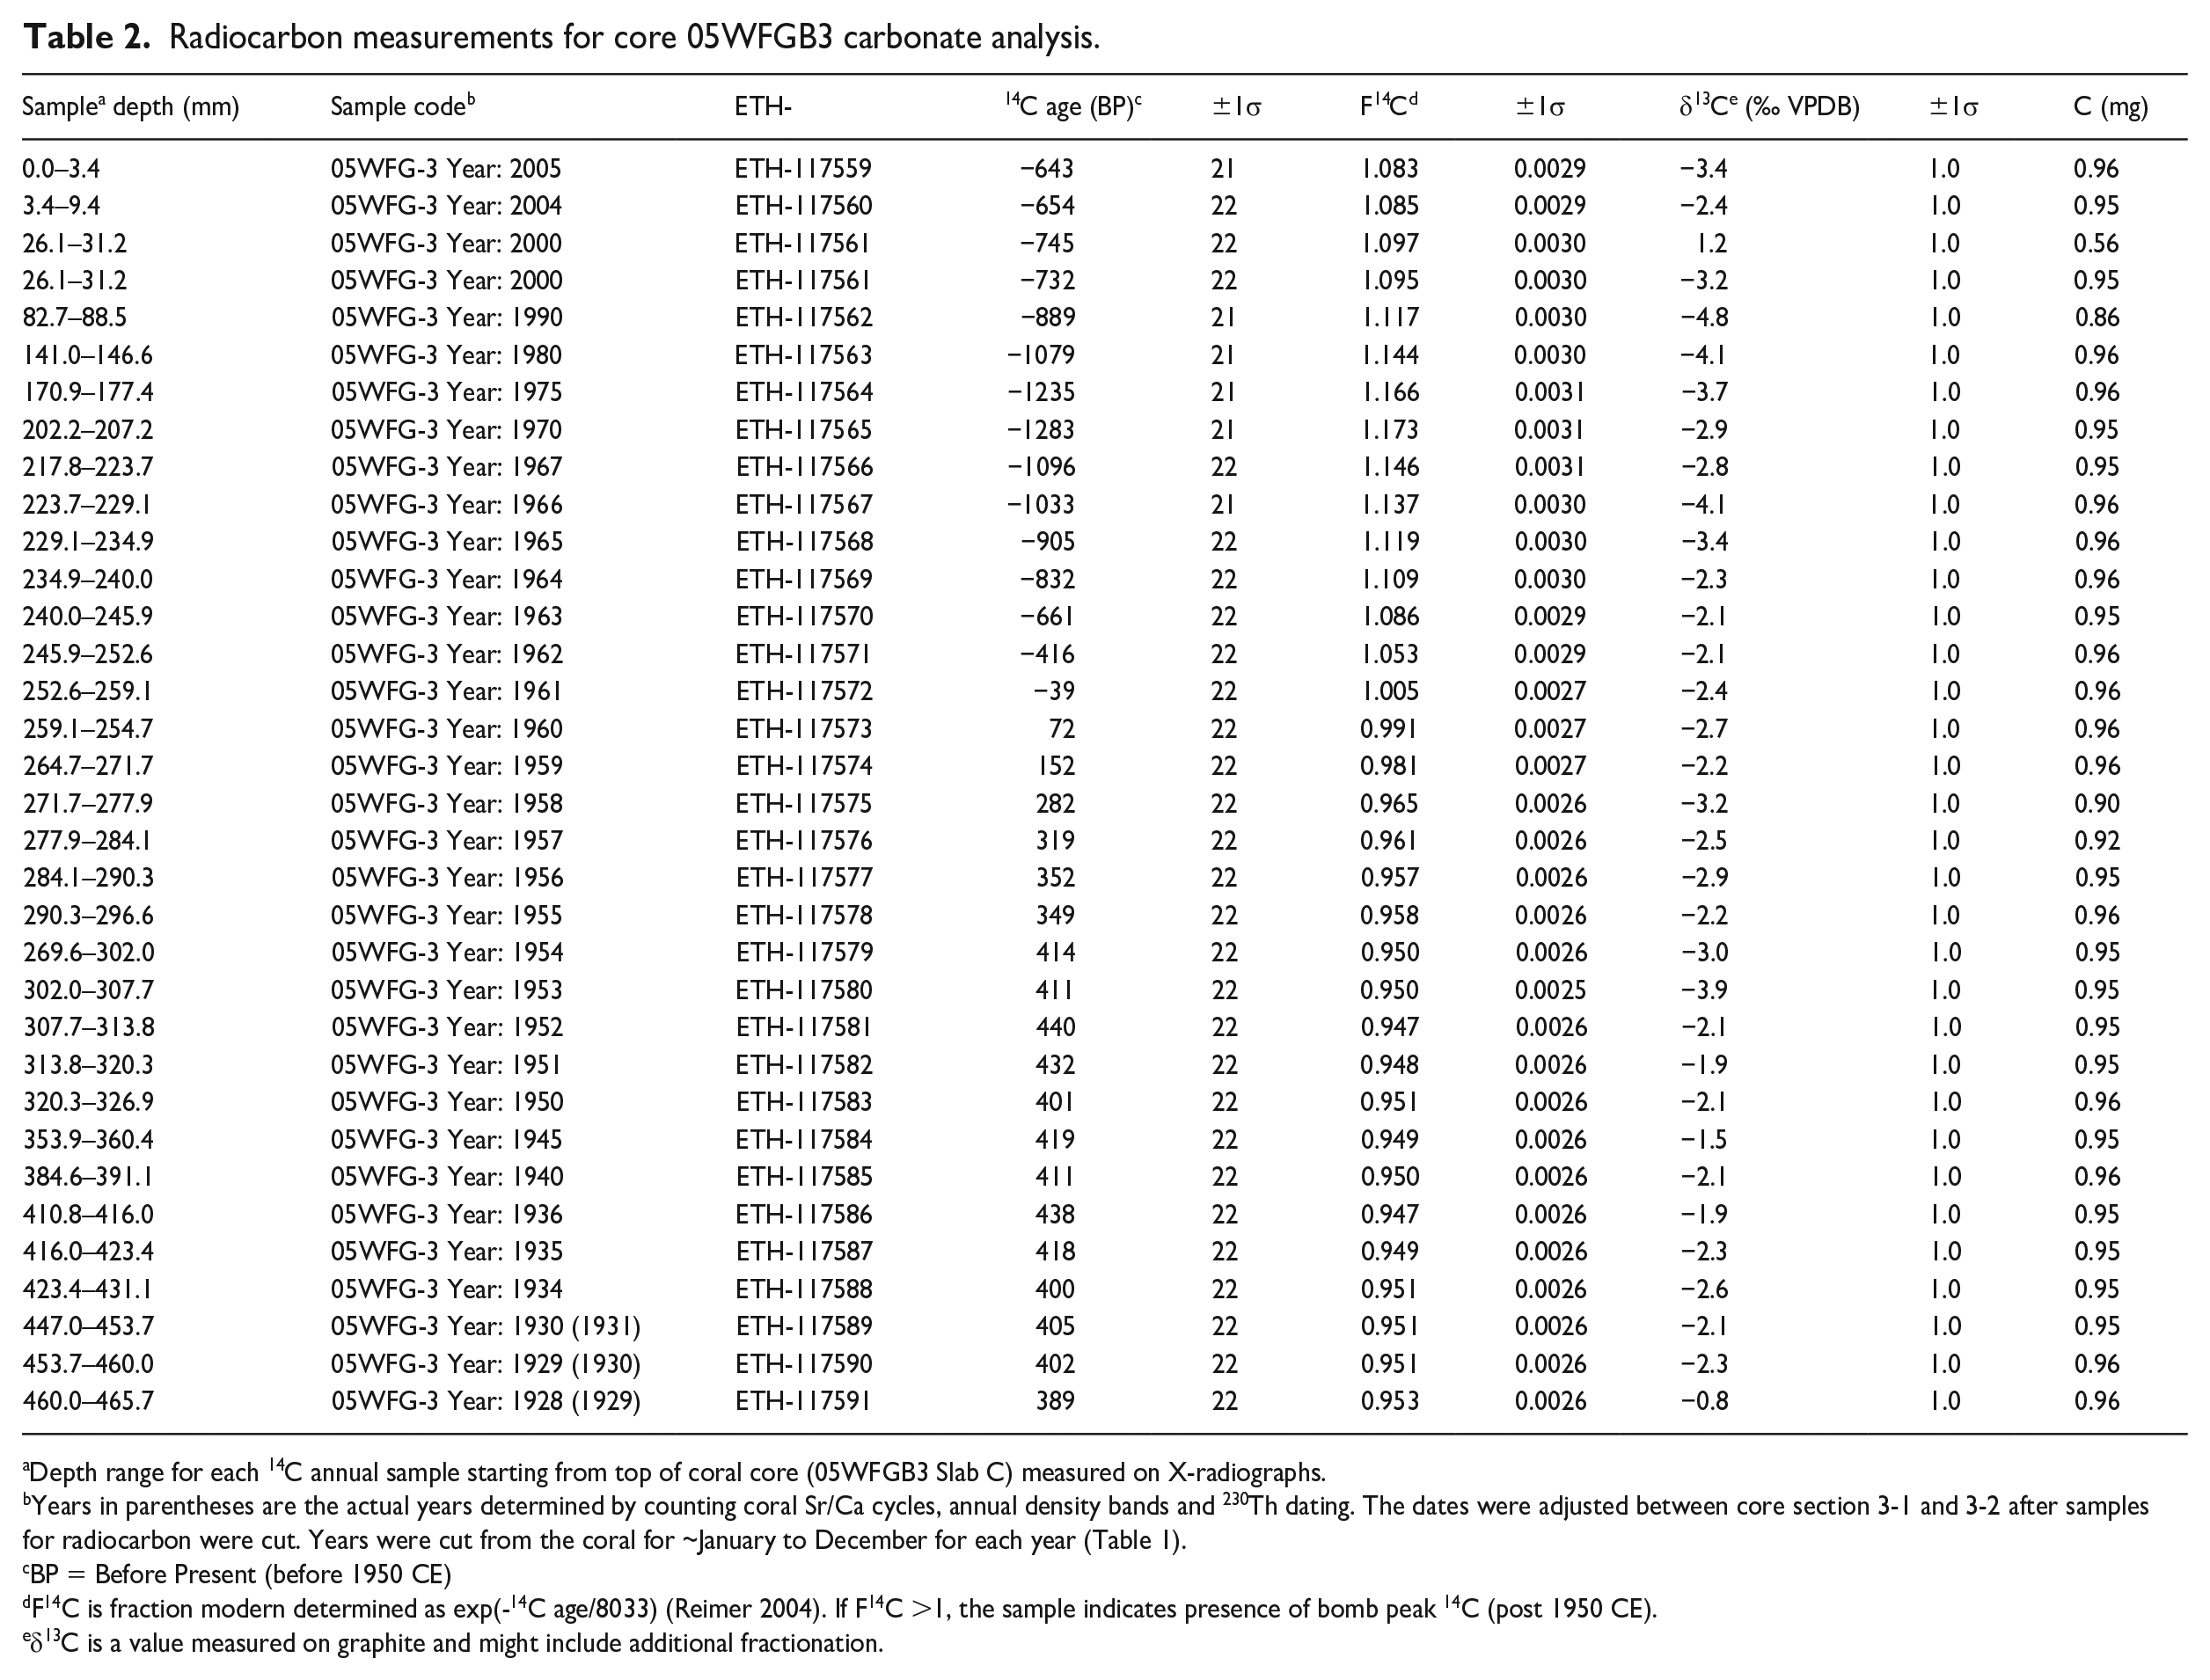
Depth range for each 14C annual sample starting from top of coral core (05WFGB3 Slab C) measured on X-radiographs.
Years in parentheses are the actual years determined by counting coral Sr/Ca cycles, annual density bands and 230Th dating. The dates were adjusted between core section 3-1 and 3-2 after samples for radiocarbon were cut. Years were cut from the coral for ~January to December for each year (Table 1).
BP = Before Present (before 1950 CE)
F14C is fraction modern determined as exp(-14C age/8033) (Reimer 2004). If F14C >1, the sample indicates presence of bomb peak 14C (post 1950 CE).
δ13C is a value measured on graphite and might include additional fractionation.
We compared core 05WFGB3 14C results to two Orbicella faveolata coral records (Wagner, 2011), one in the WFGB close to the coral where the core 05WFGB3 was extracted from and the other from Santiaguillo Reef offshore from Veracruz, Mexico in the southern GoM, both sampled with annual resolution (Figures 1a and 3). The Veracruz coral Δ14C closely tracks the WFGB coral Δ14C of the same species. There is a 4–7 year difference in the maximum Δ14C peaks between the species and the maximum Δ14C values differ by 11.8‰ with S. siderea having higher maximum values. The rapid increases or “bomb spikes” in all three of these coral Δ14C records occur in the same years within the sampling uncertainty (±0.5 year), suggesting differences in coral species are not influencing these Δ14C results.
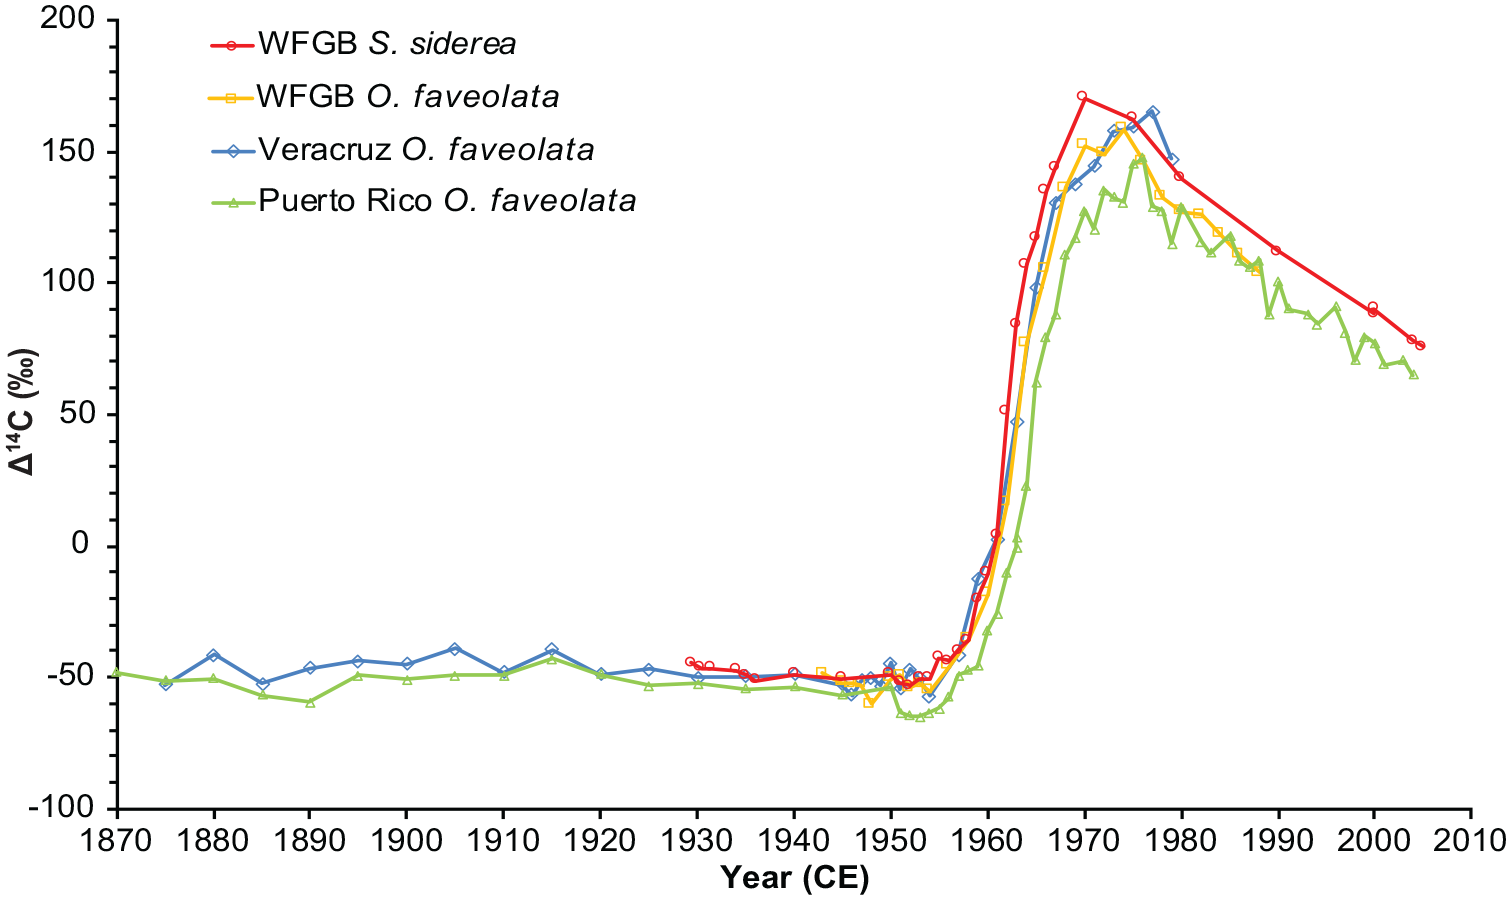
Coral core 05WFGB3 Δ14C values compared with select corals from the tropical Atlantic Ocean (Kilbourne et al., 2007; Wagner, 2011). Coral Δ14C records were not adjusted for the Suess effect. Dating and Δ14C uncertainties (2‰–3‰) are about the size of the hollow circle (Table 1). Reproduced in color in online version.
The Δ14C bomb peak in various parts of the world’s oceans can have different shapes due to each part of the ocean having different patterns of mixing water. The radiocarbon bomb peak was used to untangle this information (Broecker and Peng, 1982). Surface ocean Δ14C values are the result of equilibration with the atmosphere; however, upwelling, advection, and other mixing processes can influence oceanic Δ14C (Mahadevan, 2001). In the northwestern GoM, weak springtime upwelling events (days–weeks) of waters as deep as 200 m can occur along the continental shelf edge, where FGB is located, when the winds reverse in the spring (Murray et al., 1998; Teague et al., 2013). However, daily reef temperature measurements in FGB (Johnston et al., 2021) do not show evidence of cold water upwelling on the reef (the coldest daily temperature was 17.6°C between 1986 and 2014). Furthermore, hermatypic (reef-building) corals generally cannot tolerate temperatures <17°C, thus regular upwelling would impact the development of a coral reef in this location if it was occurring. These short-term upwelling events should not impact coral Δ14C sampled with annual resolution (i.e. each sample represents the annual average Δ14C).
A comparison with an O. faveolata from the southern coast of Puerto Rico (Kilbourne et al., 2007) finds similar timing for the Δ14C increases due to weapons testing (Figure 3). However, the WFGB Δ14C record does not contain the Δ14C depletion event between 1950 and 1953 seen in Puerto Rico and other Caribbean sites due to the mixing of low Δ14C equatorial Atlantic surface waters in the Caribbean Sea (Kilbourne et al., 2007). This depletion event reduces the Δ14C values for Puerto Rico creating a visual shift in the figure but the timing of the increase in Δ14C is the same. The lack of this depletion event in the GoM coral Δ14C records suggests that when the Caribbean waters reach the GoM this lower Δ14C equatorial water has been mixed with other water and/or equilibrated with atmospheric 14C sources; therefore, the GoM represents a more global signal.
Plutonium – The 239+240Pu activities show marked increases in 1956 (depth from core top to January 1956 = 290.3 mm) and 1964 (depth = 240.0 mm) that follow periods of increased atmospheric thermonuclear weapons testing in the early 1950s and 1961–1963 (Figure 2, Table 3, Supplemental Figure 8). Plutonium was not detectable in pre-1950 samples. There is a decline in 239+240Pu activities after 1964, with activities for coral samples dated to 1970, 1980, and 2000 being below detection limits. Unlike Δ14C, only 14 samples from the interval 1936–2000 were analyzed for 239+240Pu, and for 1950–1966 every other year was analyzed; therefore, it is possible greater 239+240Pu peaks could have occurred in odd-numbered years that were not analyzed. This study also examined 239+240Pu yearly from 1950–1959 in coral from Haiti (10LEO1) growing at the water surface (Supplemental Table 9) that has a peak in 1956.
239+240Pu for core 05WFGB3.
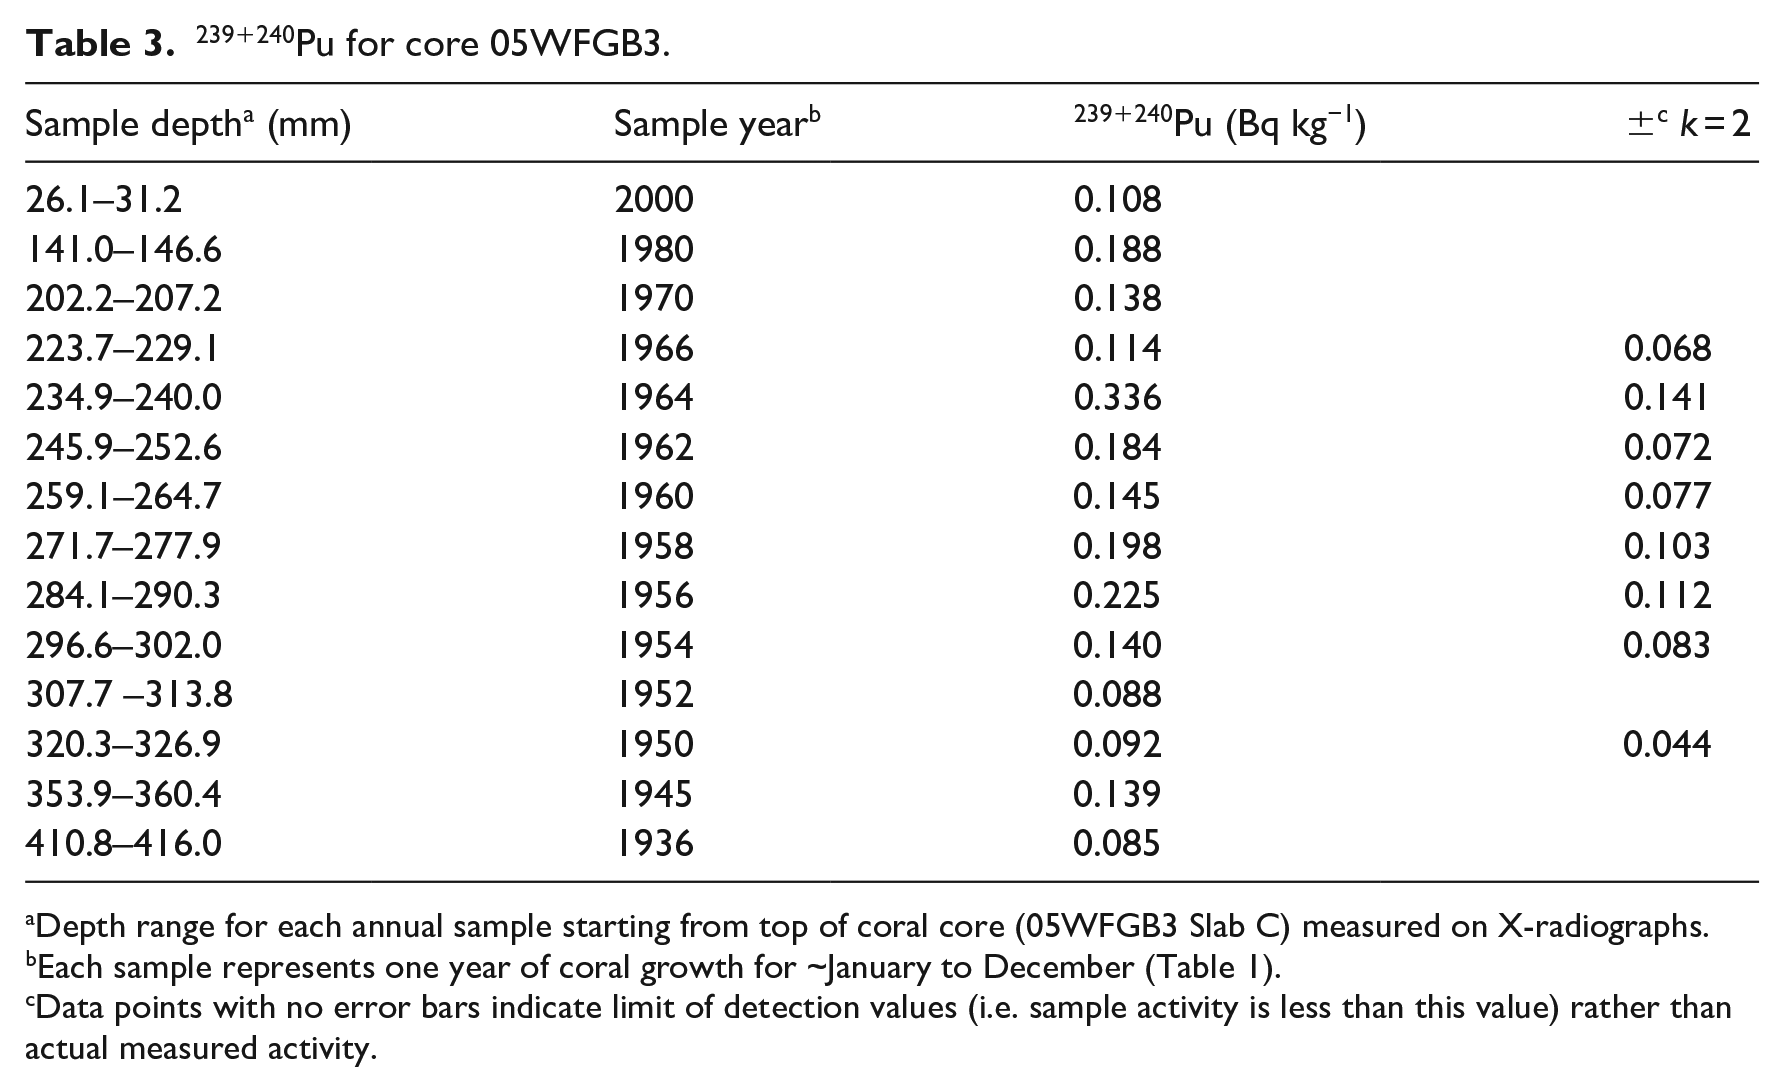
Depth range for each annual sample starting from top of coral core (05WFGB3 Slab C) measured on X-radiographs.
Each sample represents one year of coral growth for ~January to December (Table 1).
Data points with no error bars indicate limit of detection values (i.e. sample activity is less than this value) rather than actual measured activity.
Plutonium fallout from weapons testing has spread worldwide, mostly in the northern hemisphere, where more testing occurred, but was also affected by test location, wind and precipitation patterns, ocean currents, and water depth (Sanchez-Cabeza et al., 2021). A scaled comparison with other coral 239+240Pu studies to highlight maximum values (Figure 4) shows the Pacific corals, especially those near the Pacific Proving Grounds testing sites (Enewetak and Bikini) have maximum 239+240Pu values occurring before the Atlantic corals. Atlantic corals tend to record maximum 239+240Pu activities in the early-mid 1960s following the 1963 global fallout maximum (Sanchez-Cabeza et al., 2021). The exception is the Haiti coral (10LEO1) that has a maximum in 1956. However, this is an artifact of the figure since we scaled by the maximum value for each core and Haiti did not have a sample measured between 1959 and 1970 and thus is missing the 1964 peak. The coral species may also play a role as the other Atlantic corals are Orbicella sp. and corals 05WFGB3 and 10LEO1 are S. siderea, both of which have higher 239+240Pu activities than the Orbicella studies (Figure 4c). S. siderea is a coral with a dense skeleton and is relatively slow growing so it may take up and store Pu in its skeleton more readily than the less dense Orbicella corals.
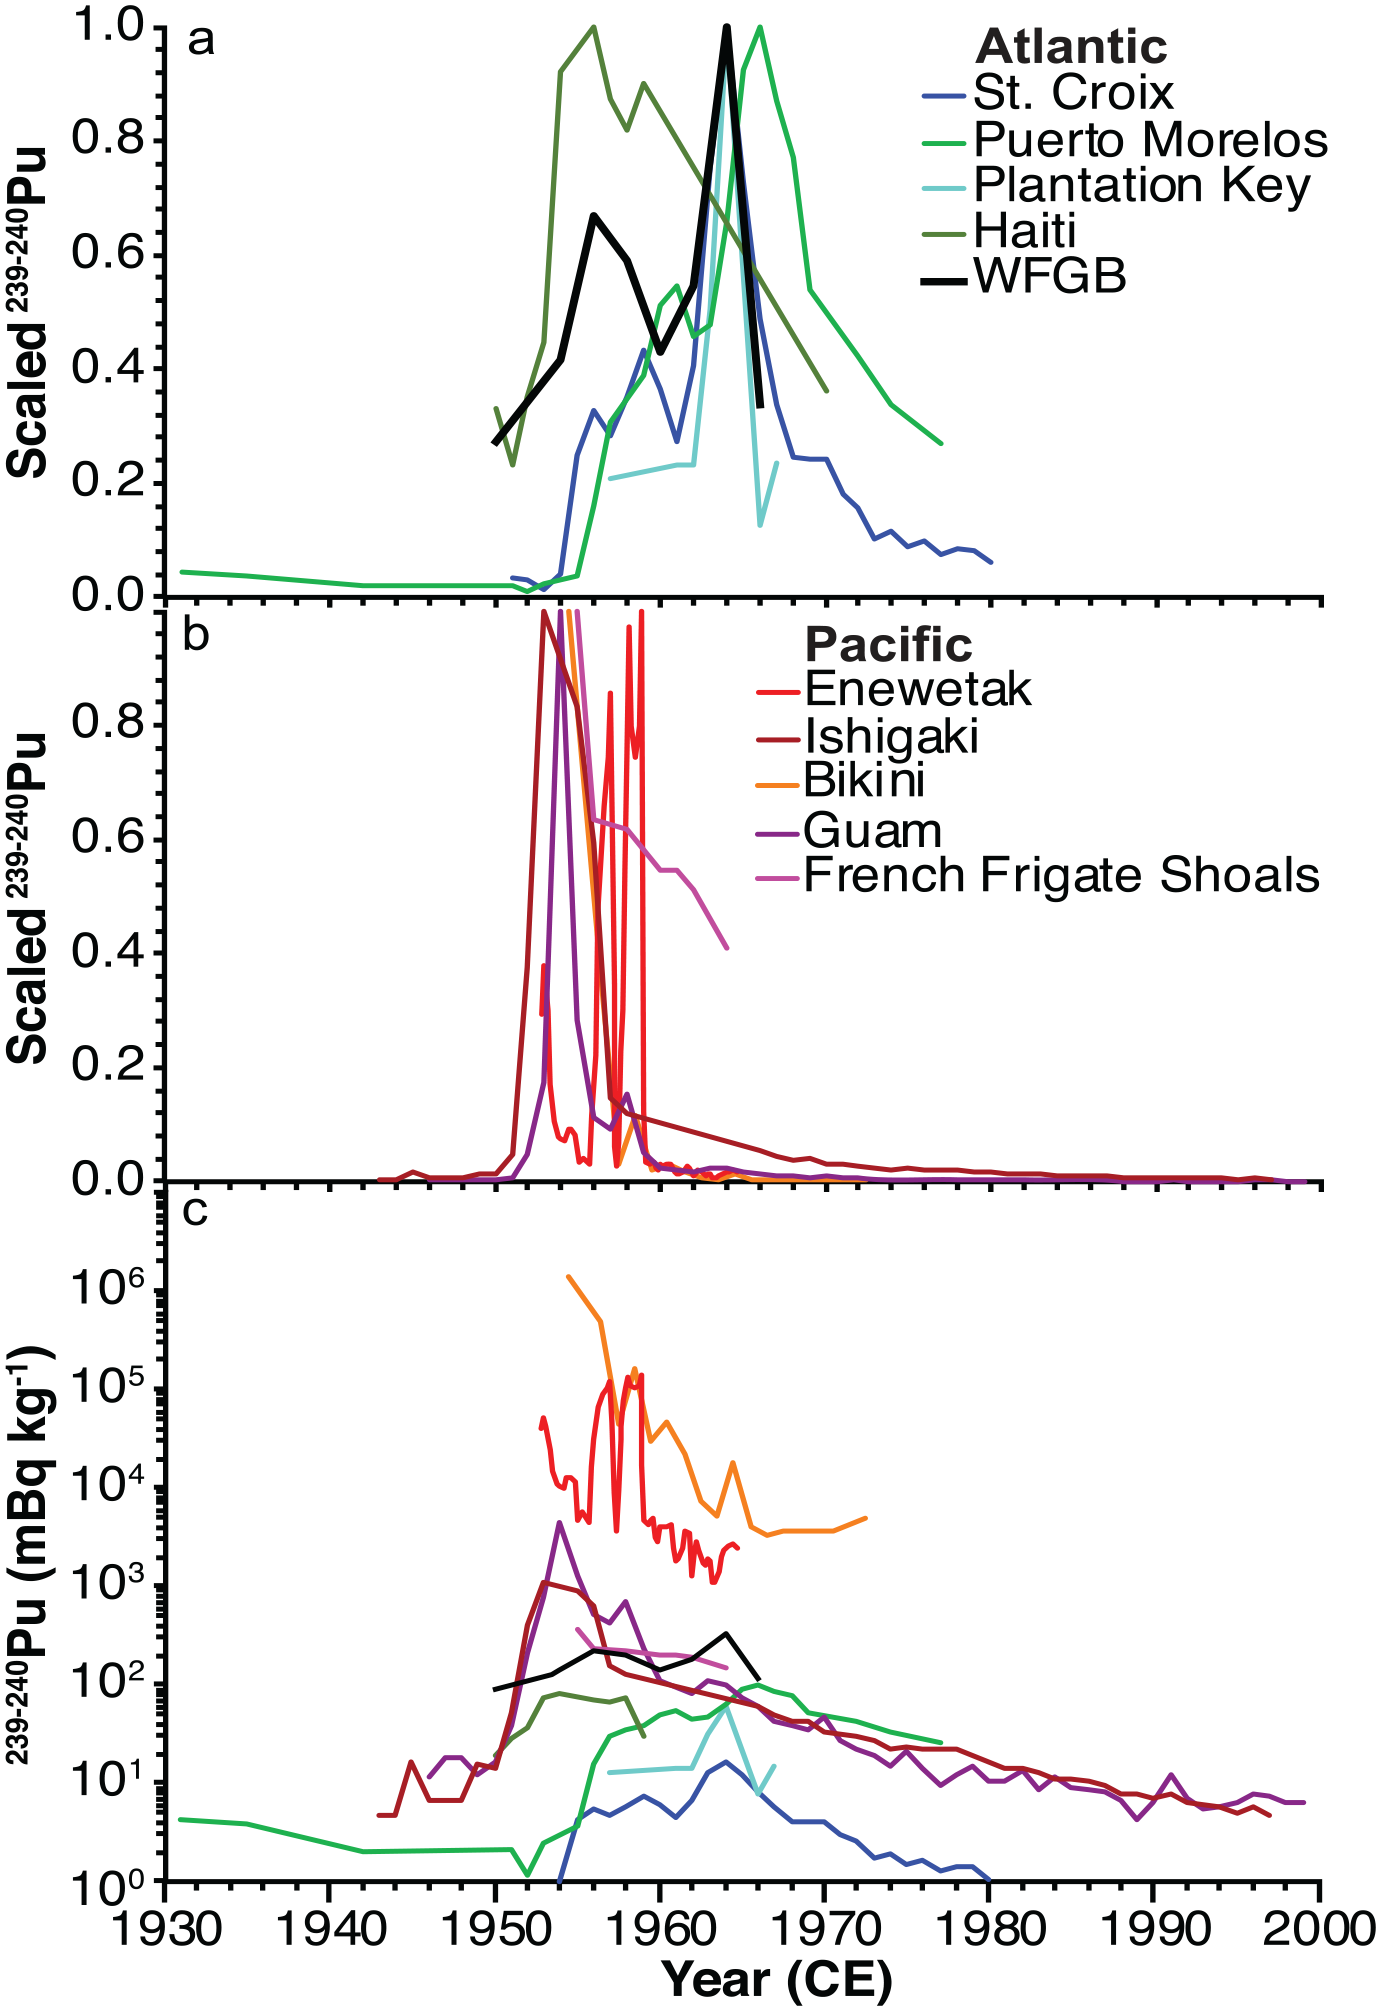
Summary of coral 239+240Pu studies. (a and b) Plutonium is scaled by the maximum activity of each record and is unitless; modified from Sanchez-Cabeza et al. (2021) Pacific sites (a) are warm colors and Atlantic sites (b) are cool colors. (c) Plutonium activities for each record not scaled using the same color labels as in (a and b). Sites are Bikini (Noshkin et al., 1975), Enewetak (Froehlich et al., 2017), Guam (Lindahl et al., 2011), Ishigaki (Lindahl et al., 2012), Hawaii (Buesseler, 1997), Croix (Benninger and Dodge, 1986), Plantation Key (Purdy et al., 1989), Morelos (Sanchez-Cabeza et al., 2021), Haiti (10LEO1; Supplemental Table 9), and WFGB (this study). Reproduced in color in online version.
Other artificial fallout radionuclides – No 137Cs and 241Am were detected in the core 05WFGB3 samples (Supplemental Results, Supplemental Table 4).
Novel materials
Spheroidal carbonaceous fly-ash particles (SCPs) – No SCPs were found in the 33 coral samples from core 05WFGB3 (Supplemental Results, Supplemental Figure 9, Supplemental Table 5).
Geochemical proxies for climate
Oxygen isotopes – The monthly-resolved coral δ18O have clear seasonal cycles that significantly co-vary with temperature (Supplemental Figure 10, Supplemental Table 6) that were averaged annually (January–December) to assess trends. The annual average coral δ18O record has a significant trend toward lower values for the interval from 1932 to 2005 CE indicating lower temperatures and/or saltier conditions similar to the interval from 1826 to 1890 CE (Figure 5a). Instrumental and other coral proxies reconstructions suggest the GoM is warming during the 20th century (Allard et al., 2016; DeLong et al., 2014; Flannery et al., 2017); therefore, we interpret this trend as the northern GoM is becoming saltier. Coral δ18O is an important hydroclimate proxy that can provide insights into moisture flux from the ocean to the atmosphere and freshwater entering the ocean. Coral δ18O by itself is not a marker for the Anthropocene but can inform us of the response of the climate system to anthropogenic forcing.
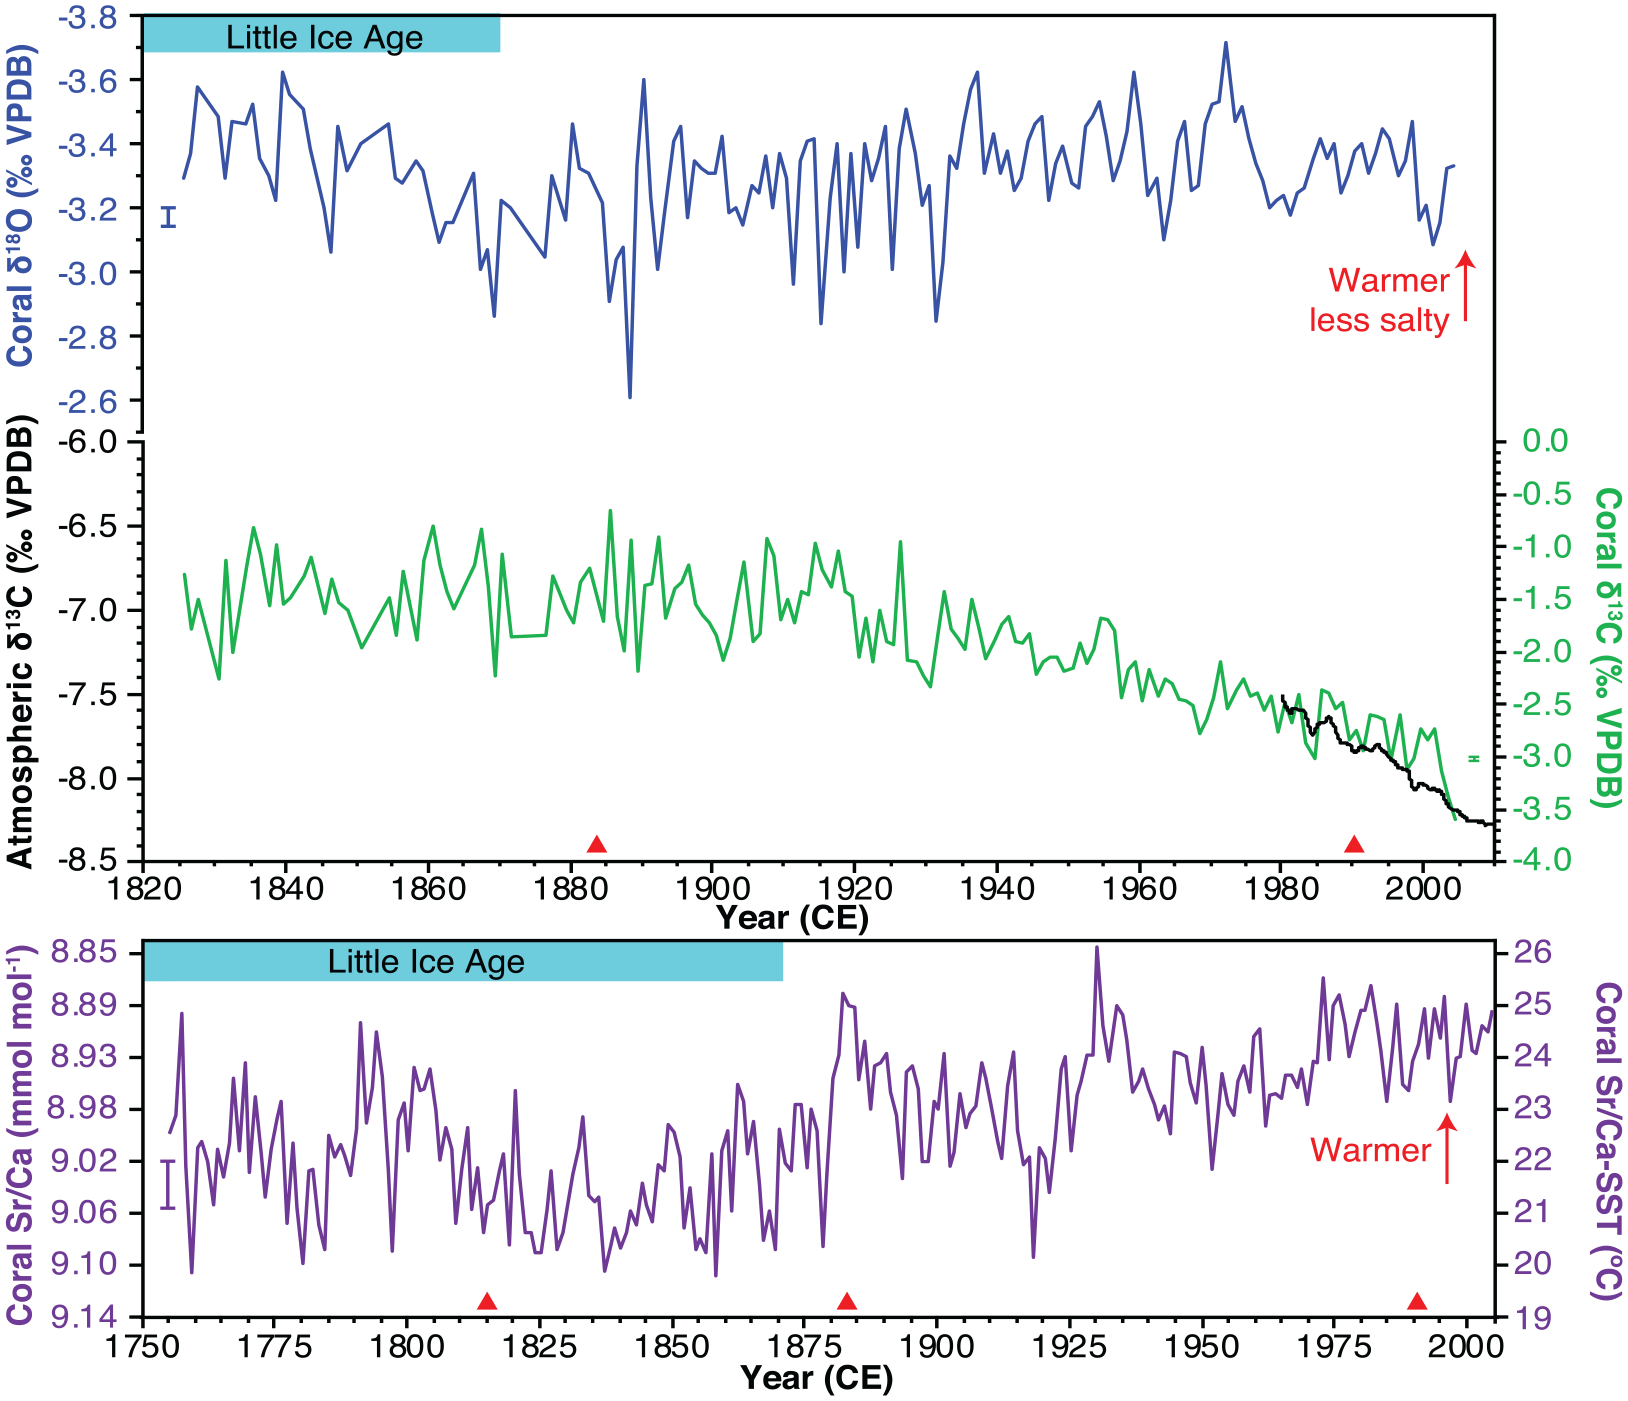
Annual average coral environmental markers from core 05WFGB3 for coral (a) δ18O, (b) δ13C, and (c) Sr/Ca. Monthly coral δ18O and δ13C values were averaged in the interval from 1932–2005 and annual maximum and minimum δ18O and δ13C values were averaged in the interval from 1826–1932. Monthly coral Sr/Ca variations were annually-averaged in the interval from 1755–2005. (b) Atmospheric δ13C is from Mauna Loa, Hawaii is shown with the quasi-regular seasonal cycle removed (Keeling et al., 2001). (c) Coral Sr/Ca was converted to SST using the coral Sr/Ca-SST equation for this coral (Weerabaddana et al., 2021). Coral δ18O and Sr/Ca are scaled to the same temperature range and plotted so that warmer values are up. Error bars (1σ) are analytical precision determined for monthly samples. For Sr/Ca precision, PL precision is plotted (Supplemental Table 1). Reproduced in color in online version.
Sr/Ca, Li/Ca, Li/Mg, and U/Ca – We evaluated several coral temperature proxies from 1986 to 2005 CE and assessed the skill of the temperature reconstructions with reef temperature measurements from WFGB (Johnston et al., 2021) and OISST, a 1° gridded and interpolated data product that includes satellite-derived estimates of monthly SST for complete coverage (Reynolds et al., 2002). The monthly coral Sr/Ca, Li/Ca, Li/Mg, and U/Ca records have clear seasonal cycles that are significantly co-varying with temperature (Supplemental Figure 10, Supplemental Table 6). Coral Sr/Ca analyzed with ICP-OES has the highest correlation with reef temperature and OISST and is the best-performing coral temperature proxy (error of reconstruction = 1.27°C). Coral Sr/Ca analyzed with ICP-OES has a better analytical precision than ICP-MS (Supplemental Table 1) likely due to isotopic interferences in the plasma. For the rest of the core 05WFGB3, we analyzed monthly Sr/Ca using ICP-OES and then determined annual averages (January–December) to assess long-term trends.
The annually-resolved coral Sr/Ca record has a significant linear decrease of 0.048 mmol mol−1, equivalent to an increasing trend of 1.1°C, for the interval from 1932 to 2005 CE, similar to the global warming trend (Figures 2 and 5c), using the coral Sr/Ca-SST calibration equation determined for this coral (Weerabaddana et al., 2021). The interval from 1940 to 1970 CE has cooler SST with warmer SST after 1970. The interval from 1755 to 1880 CE, part of the Little Ice Age, is cooler than 1880–2005 CE with the coldest decades occurring between 1810 and 1880 CE when explosive volcanic eruptions cool global temperatures. Like coral δ18O, coral Sr/Ca is an important climate proxy that provides insights into past temperature variability. It is not an Anthropocene marker in itself but indicates the climate response to anthropogenic forcing. Additionally, coral Sr/Ca is useful for confirming the annual density band chronology by determining if a year is present when a band is not clear in the X-radiograph and for assessing temporal overlaps in core breaks.
Organic matter proxies
Carbon isotopes – The annually-resolved coral δ13C averages −1.43‰ in the 1800s with a significant decreasing trend starting in the interval between 1906 and 1913 CE (results of change point analysis varies based on the number of change points) that accelerates from 2000 to 2005 CE to an average value of −3.14‰ (Figures 2 and 5b). This trend is called the “Suess effect” (Keeling, 1979) to describe the addition of CO2 to the atmosphere from burning fossil fuels with lower δ13C values compared to preindustrial levels. A comparison with atmospheric δ13C measurements in Hawaii (1980–2005) (Keeling et al., 2001) finds a decrease of 0.67‰ while coral δ13C declines by 1.12‰ for the same time interval, thus the coral 05WFGB3 is capturing global trends in δ13C and CO2 but with a higher rate of decline. A comparison with Atlantic coral and sclerosponge δ13C records (1800–2000 CE) finds similar trends with more rapid decreases in the oceans due to a greater amount of CO2 in the surface oceans and that the rate of decline is accelerating at the end of the 20th century (Swart et al., 2010). This new coral δ13C record extended to 2005 confirms further acceleration. There are slightly different δ13C timings in trends for South Pacific coral δ13C records, but the overall trends are similar (Dassié et al., 2013).
Coral skeleton nitrogen isotopes (CS-δ15N) – The annually-resolved CS-δ15N record for core 05WFGB3 contains stable values from 1928 to 1962 CE centered at 5.1‰ ± 0.15‰ followed by a significant increasing trend starting in 1963 (0.13‰ decade−1 for 1963–2005) (Figure 2, Table 4, Supplemental Figure 11). The CS-δ15N is a robust indicator of the sources of nitrogen present in the surrounding environment (Duprey et al., 2017, 2020; Erler et al., 2015; Wang et al., 2016, 2018).
Nitrogen isotope ratios for core 05WFGB3.
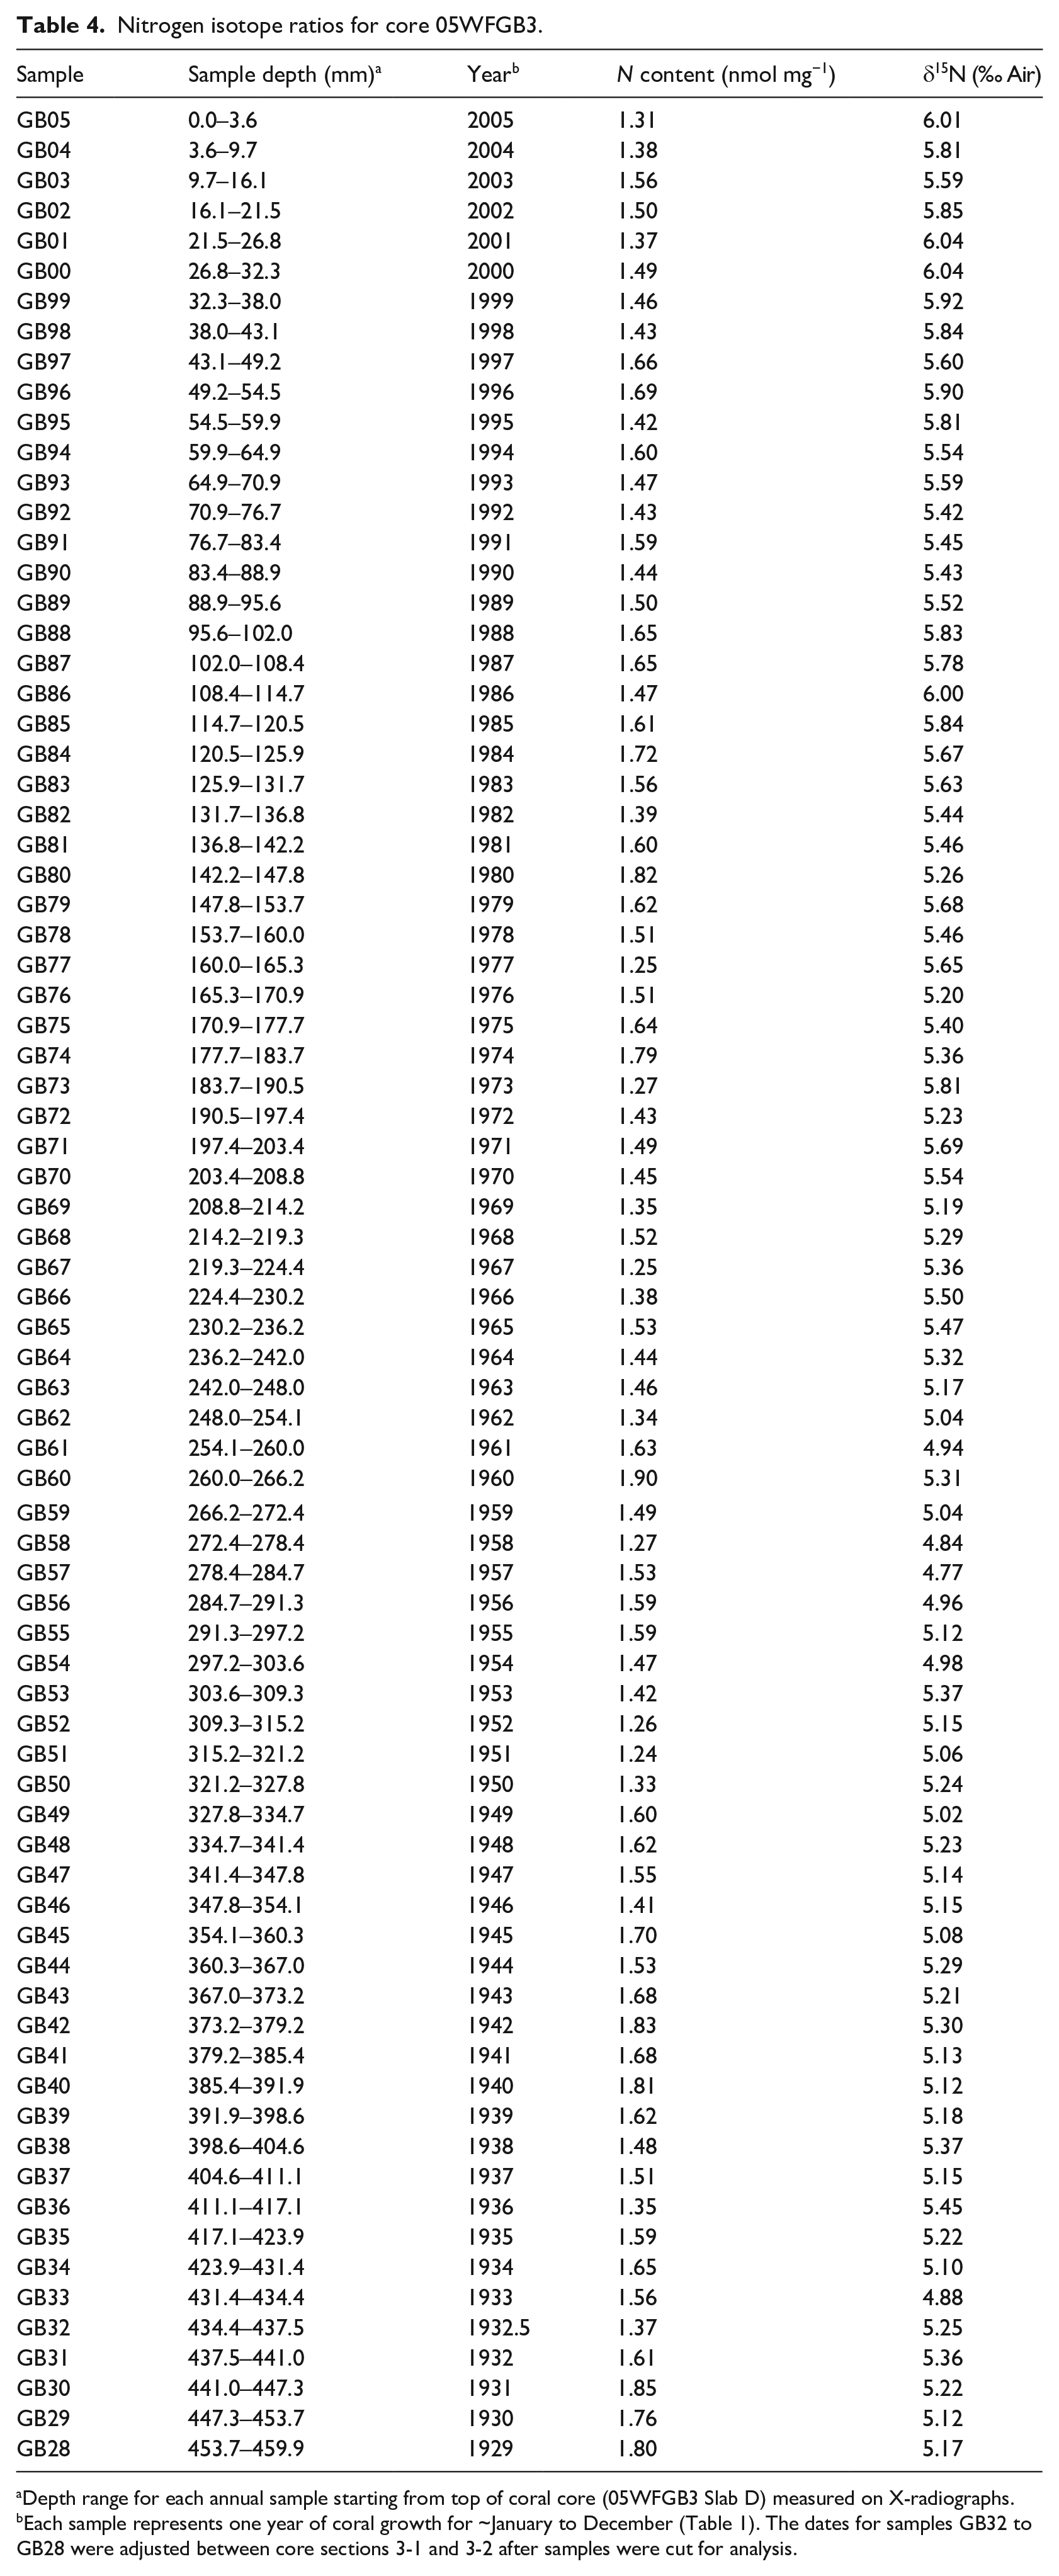
Depth range for each annual sample starting from top of coral core (05WFGB3 Slab D) measured on X-radiographs.
Each sample represents one year of coral growth for ~January to December (Table 1). The dates for samples GB32 to GB28 were adjusted between core sections 3-1 and 3-2 after samples were cut for analysis.
With values ranging from 4.8‰ to 6.0‰, the 05WFGB3 CS-δ15N record is well-constrained by two end-members: the SubTropical Underwater (STUW) and the Mississippi and Atchafalaya River System (MARS) (see Supplemental Results for the definitions of the end-members). Changes in the CS-δ15N can be interpreted as a change in the respective contribution of the STUW and the MARS to the GoM. The increase in CS-δ15N values observed from the 1960s onward points toward a greater contribution of MARS-derived nitrogen to WFGB. Indeed, the coral record tracks remarkably the nitrogen load within the Mississippi River Basin (Figure 6) that almost doubles from the pre-1960s to 2000s with a ~0.7‰ increase during the same period. This interpretation is consistent with the increase in bulk δ15N observed in the GoM for the 20th century in sediment cores (Rosenbauer et al., 2009) and deep-sea coral records (Prouty et al., 2014) that is attributed to increased nutrient loading from the MARS. See additional CS-δ15N results in the Supplemental Materials.
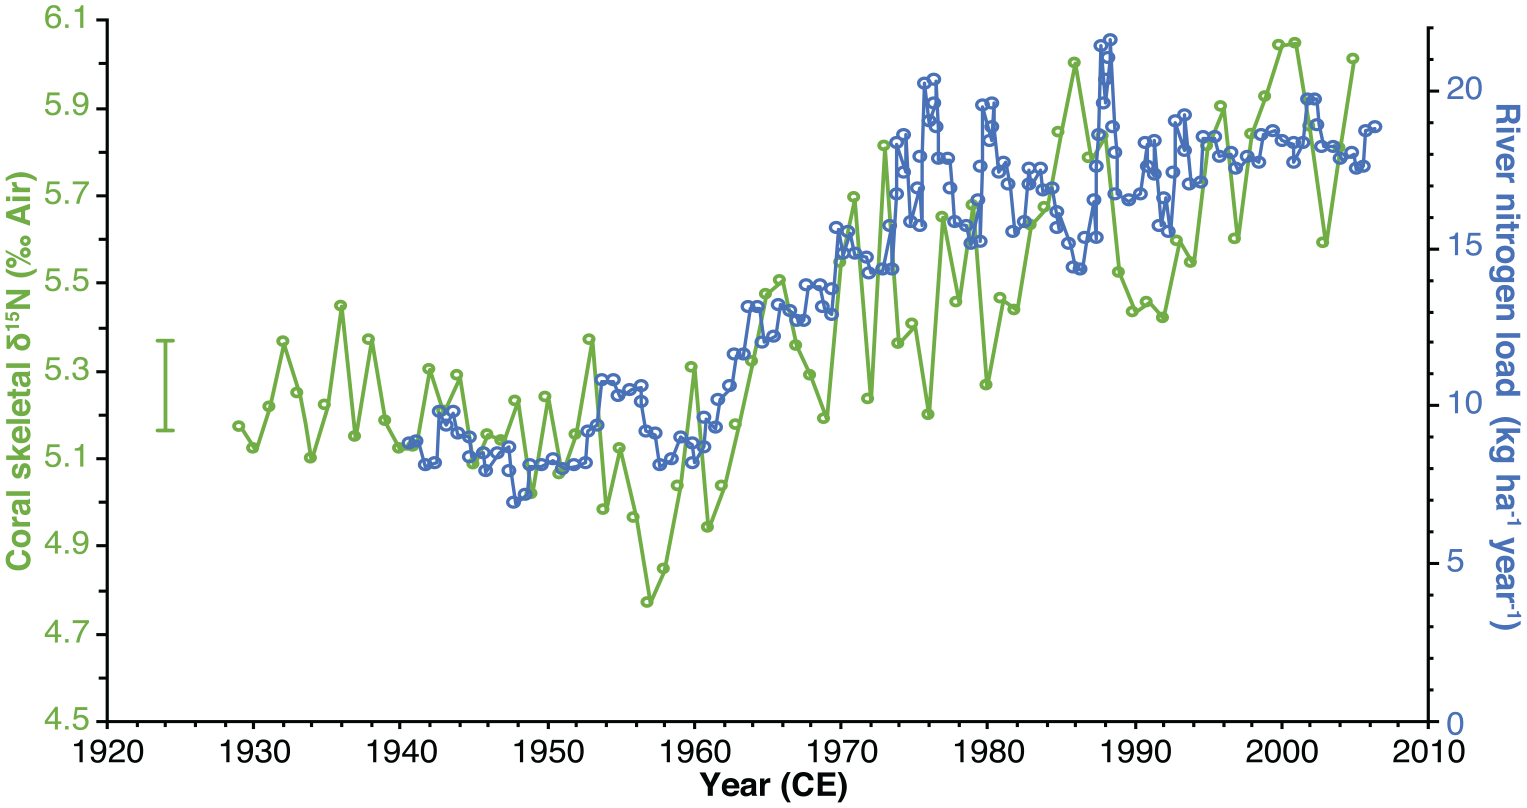
Comparison of CS-δ15N and Mississippi River Basin nitrogen load (David et al., 2010). Error bar is analytical precision (1σ) and years are assessed to be accurate. Reproduced in color in online version.
Inorganic geochemical signals
Lead-210 activity – The low total 210Pb activities from the core 05WFGB3 and the disequilibrium give 210Pb high uncertainties (Supplemental Table 7) and are not deemed an Anthropocene marker for this coral, see Supplemental Results.
Mercury – Mercury concentrations in the samples from the core 05WFGB3 are low and vary from 0.38 to 1.34 ng g−1 with a lower value in 1945 at the end of World War II that increases until 1980 when the lowest Hg value occurs (Figure 2, Supplemental Figure 12, Supplemental Table 8). The topmost sample (2005 CE) includes residues from the coral tissue layer and thus this higher value represents the uptake of Hg by the living coral that is not incorporated into the coral skeleton. A study of Porites astreoides found that 96% of Hg is taken up by living tissue and only 4% was found in the coral skeleton (Bastidas and García, 2004).
The Hg concentration in core 05WFGB3 is lower by an order of magnitude than that found in S. siderea corals near industrial sites in Central America (Guzmán and García, 2002) suggesting locations near pollution sources increase coral skeletal Hg concentration. Similar results were found in Bermuda for Diploria labyrinthiformis corals sampled near a landfill versus a nearby open bay (Prouty et al., 2013) with the WFGB coral having similar Hg concentrations as the corals near that landfill (Figure 7). A 200-year-long record of coral Hg from the South China Sea (Sun et al., 2016) has a lower baseline Hg concentration than core 05WFGB3 with a similar maximum Hg concentration; however, these two records are not co-varying. That study found increases in coral Hg are associated with Chinese wars. Core 05WFGB3 shows some co-variance with US apparent consumption and global production of Hg (Kelly and Matos, 2014) (Figure 7b). The US and other countries enacted pollution regulations in the 1960s and 1970s thus contributing to the reduction in Hg production and consumption and possibly the reduced Hg levels seen in the coral samples for 1980, 1990, and 2000 CE. The results suggest core 05WFGB3 may be recording the US and global Hg fluctuations within the resolution of these records yet further analysis, preferably annually, would help further resolve the coral Hg signal.
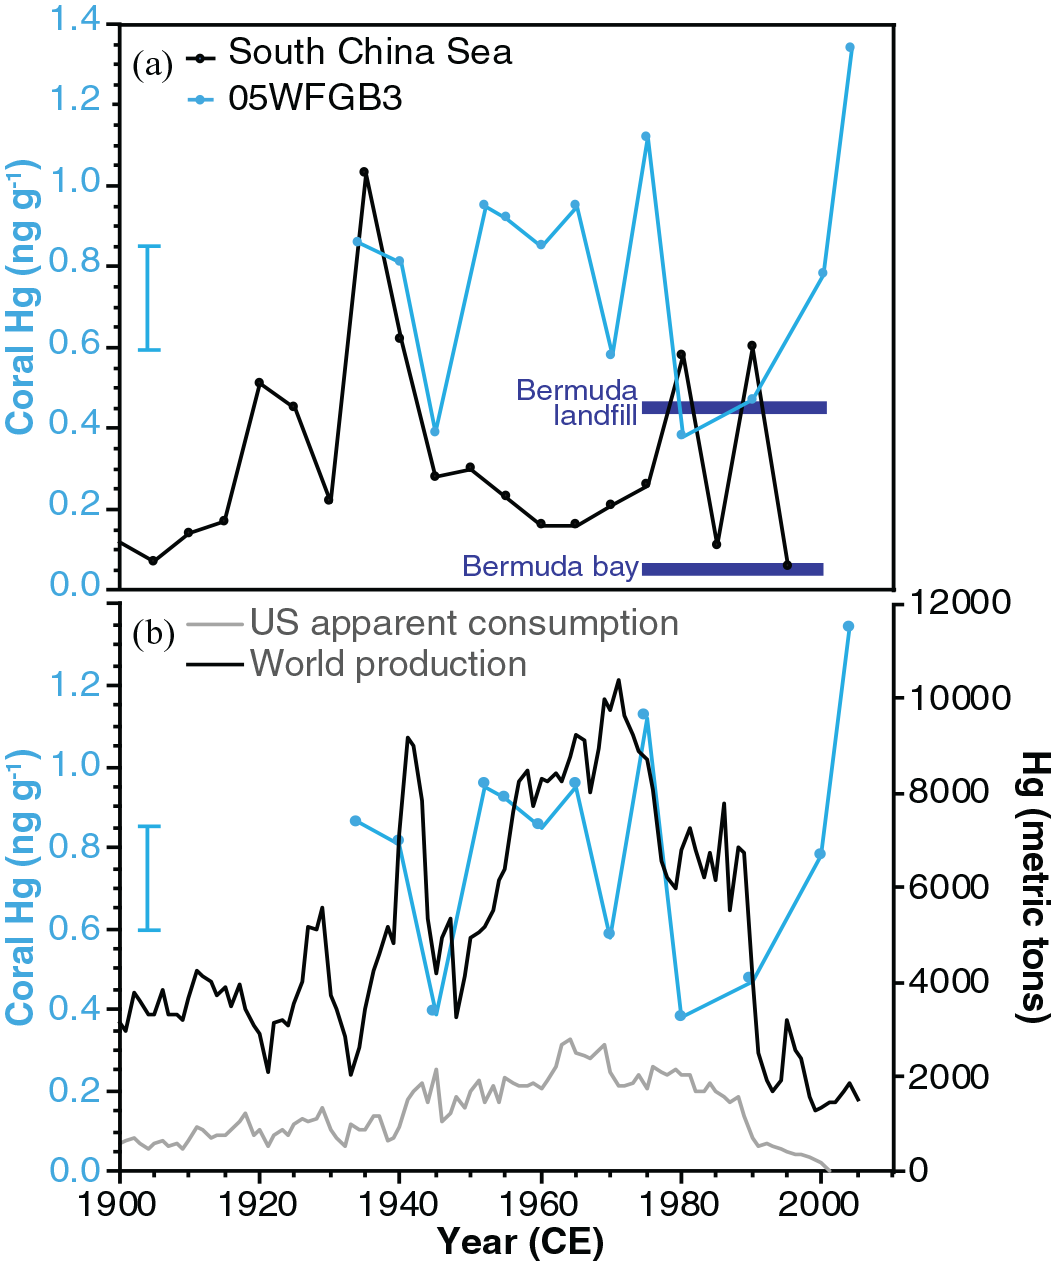
(a) Comparison of coral Hg skeletal concentrations with core 05WFGB3. Two coral Hg averages (1974–1994; dark blue squares) from Bermuda show differences between a relatively open ocean location and a coral growing near a landfill (Prouty et al., 2013). The South China Sea record has samples spanning 5-years and is plotted in the center of each 5-year interval (Sun et al., 2016). (b) US apparent consumption and world production of Hg (Kelly and Matos, 2014) compared with coral 05WFGB3 Hg concentration. WFGB samples are from 1 year but analyzed ~5-year intervals (Supplemental Table 8). Error bar is analytical precision (1σ) and years are assessed to be accurate. Reproduced in color in online version.
Barium – The monthly-resolved coral Ba/Ca record has clear seasonal cycles that do not significantly co-vary with temperature (Supplemental Figure 10). The coral Ba/Ca results presented here build upon the study of Weerabaddana et al. (2021) that revealed the seasonal cycle in monthly coral Ba/Ca is mostly driven by surface ocean productivity. Furthermore, that study found the GoM has some of the highest coral Ba/Ca values globally. The annually-averaged coral Ba/Ca contains a significant difference in mean coral Ba/Ca of 1.57 μmol mol−1 between 1933–1947 and 1948–2004, pre- and post-oil extraction operations in the GoM, respectively. There is a significant increasing trend from 1965 to 1983 (these years are change points along with 1947; Figure 2). Generally, coral Ba/Ca records upwelling or riverine sedimentation in the coastal environment (Alibert et al., 2003; Lea et al., 1989); however, WFGB is not close enough to a river source or upwelling that would influence coral Ba/Ca. However, the GoM is home to extensive ocean drilling operations that use barite (BaSO4) as drilling muds and has many offshore oil platforms (Figure 1a) that discharge production waters that contain barite into the gulf (Bleiwas and Miller, 2015). The US barite production and consumption can be used as a proxy for barite input to the oceans (Kelly and Matos, 2014) since >90% of barite produced in the US are used for offshore oil drilling (Bleiwas and Miller, 2015) and the GoM is the primary oil field for the US. Barite production and consumption peaks in 1981 with a sharp decline afterward with falling oil prices and coral Ba/Ca captures this peak in 1983 with a three-year delay due to barite production stockpiles taking time to be shipped to the offshore drilling platforms before being used as drilling mud (Weerabaddana et al., 2021).
Discussion
We propose the coral core 05WFGB3 as the Anthropocene GSSP and this discussion will address the requirements for a GSSP that applies to the Anthropocene (Head and Gibbard, 2015; Waters et al., 2023). The core 05WFGB3 provides a record of a primary Anthropocene marker, the Δ14C bomb spike starting in 1957 CE, and secondary markers in the 20th century, the 239+240Pu bomb spikes in 1956 and 1964, that can be accurately dated to the year and correlated with global anthropogenic signals (Figure 2). The core 05WFGB3 is 1.74 m long and is comprised of primary aragonite with no signs of diagenesis, bioerosion, or disturbances in the core except for breaks that occur during coring or during cutting the core into slabs for X-radiographs and geochemical sampling (Supplemental Figures 1–5). The regular monthly coral Sr/Ca and Mg/Ca signals also support the pristine nature of this core since anomalies in these two elemental ratios can be the result of secondary aragonite or calcite precipitation (Quinn and Taylor, 2006; Sayani et al., 2011). Siderastrea siderea is a relatively slow-growing coral (~6 mm year−1) when compared with other corals, yet its growth rate is more than sufficient to visually discern years in the density bands and for geochemical sampling on annual to weekly time scales. There is no distinct visible marker or litho-facies change for the year 1957 in the core 05WFGB3 but the year can be found by counting the annual density bands that are visible (wetting the surface helps to see the bands) but are easier to see in X-radiographs. Counting annual bands provides accurate dating and chronology control for corals similar to dendrochronology (Black et al., 2019). Furthermore, corals can be 230Th-dated with accuracies better than ±1 year for corals <100 years old when a single annual density band is dated (Shen et al., 2003, 2008). WFGB is an open ocean location managed and protected by the FGBNMS that is accessible by boat and to divers. FGBNMS also coordinates and compiles all research conducted in FGB in annual and other reports (Johnston et al., 2021).
Geochemical proxies are the primary markers used for chemostratigraphy in a coral skeleton such that researchers can examine how their variations are influenced by the evolution of global and regional anthropogenic activities (Figure 2). The fallout from atmospheric thermonuclear weapon testing is a significant, globally widespread, and abrupt signature that can be used as a global marker for the onset of human-dominated changes in the environment (Waters et al., 2015). However, the timing and amplitude of the bomb spikes in the surface ocean and thus corals can be affected by (1) location, (2) atmospheric distribution, (3) the rate of equilibration with the atmosphere, (4) the hydrographic regime of the location, (5) biological uptake of radioactive isotopes. The peak of thermonuclear testing occurred in 1951–1958 and 1961–1962 and declined after 1963 due to a Partial Test Ban Treaty and moratoriums when testing was mainly underground in the late 1960s (UNSCEAR, 2000).
Coral core 05WFGB3 contains the radiocarbon “bomb spike” with an increase starting in 1957 then a peak acceleration in 1962 and reaching a maximum in 1970 (Figure 2). Radiocarbon enters the ocean through gas exchange with the atmosphere with an equilibration time of 7–10 years (Broecker and Peng, 1982; Mahadevan, 2001). The bomb Δ14C maximum in core 05WFGB3 exhibits this expected delay with respect to the atmosphere and the initial increase and acceleration is within the testing dates. The GoM corals do not contain the 14C water mixing signal seen in the Δ14C in corals from the Cariaco Basin and south of Puerto Rico from equatorial waters with 14C depleted water (Figure 3) (Kilbourne et al., 2007; Wagner et al., 2009; Wagner, 2011). Previous GoM coral Δ14C studies found the source waters that feed the GoM and the air-sea exchange of CO2 in the gulf are close to the global average (Wagner et al., 2009, Wagner 2011). Therefore, the Δ14C in core 05WFGB3 is representative of a more global radiocarbon bomb spike than locations with upwelling and mixing water masses that contain 14C-depleted water or locations near the weapons testing sites.
Plutonium-239 is a significant component of the radioactive fallout from thermonuclear weapons testing with a half-life of 24,110 years that will be detectable for ~100,000 years (Hancock et al., 2014) whereas 14C is detectable for ~55,000 years (Hajdas et al., 2021). The coral 239+240Pu record has two clearly marked “bomb spikes” in 1956 and 1964. These spikes are synchronous (±1–2 years) with other tropical Atlantic corals but occur after the bomb spikes in Pacific corals located closer to the testing sites (Sanchez-Cabeza et al., 2021) (Figures 2 and 4) suggesting the WFGB coral is recording wind distributed 239Pu thus a more global bomb spike (Waters et al., 2018). Since the WFGB coral and Haiti microatoll coral are synchronous for the 1956 spike, this suggests water depth and oceans currents are not a factor for these coral 239+240Pu records; however, there are differences in the magnitude of 239+240Pu activities for the Atlantic corals (Figure 4) suggesting a possible biological effect that could be contributing to the coral 239+240Pu activities. Another consideration when comparing the Δ14C and 239+240Pu records in core 05WFGB3 is analytical precision and detection limits where the plutonium analysis was not different from the background for several samples analyzed for this study (Supplemental Figure 8) whereas the Δ14C spike is much greater than analytical precision. Other radioactive isotopes investigated in this study were not detectable in corals possibly due to oceanic or biological processes.
At the same time as nuclear testing was occurring, pollution from industry, fossil fuel burning, and other human activities was rapidly increasing and these proxies can serve as auxiliary Anthropocene markers. The decreasing trend since the 1800s in coral δ13C due to fossil fuel burning has been studied in corals since 1978 (Swart et al., 2010). The decreasing trend in δ13C is accelerating especially after the year 2000 and is almost in sync with atmospheric δ13C due to the oceans up taking atmospheric CO2 (Figure 5b) The δ13C Suess effect is captured in many carbon-based archives that could also be used as chemostratigraphic tool. Parallel to the increasing fossil fuel burning is the addition of greenhouse gases in the atmosphere that is driving temperatures higher. The WFGB coral Sr/Ca is recording these temperature changes in the ocean (Figures 2 and 5b) and contains the global warming trend. However, the timing of the warming trend does vary by location and is not globally synchronous to a year or even a decade (Abram et al., 2016; PAGES 2k Consortium, 2013) but could serve as marker in a wide array of archives with resolutions that are not always annual. Mercury levels in the environment have tripled since the pre-industrial interval with an increase after World War II (Horowitz et al., 2014). The WFGB coral Hg record captures this variability (Figure 2) and fluctuates with Hg consumption and production (Kelly and Matos, 2014) (Figure 7b). Oil extraction operations using barite as a drilling mud have increased seawater Ba concentration in the GoM (Carriquiry and Horta-Puga, 2010; Deslarzes et al., 1995; Weerabaddana et al., 2021). The increase in mean coral Ba/Ca after 1965 represents the increase in global oil and gas demand after World War II (Figure 2). The coral Ba/Ca record is an indicator of the onset of anthropogenic activities in the GoM yet its scope remains regional and precludes its uses as an Anthropocene marker.
The GoM is intimately linked to North America via the Mississippi River and other rivers that bring anthropogenic pollutants from land to the ocean (mercury and nitrogen). The CS-δ15N record in core 05WFGB3 provides an invaluable perspective on the alteration of the marine nitrogen cycle in the GoM due to recent anthropogenic activities. A significant increase in CS-δ15N is observed after 1963. Transforming forests to agricultural lands and grasslands in the era of “rapid acceleration” accompanied by the massive use of artificial fertilizer during the Green Revolution starting in the 1960s (Ruddiman et al., 2015) to meet the world’s food supply needs has remarkably changed the ocean nitrogen cycle by the increased nutrient loading from agricultural systems. Exposed soil is prone to erosion and nutrient leaching that ended up in the oceans through river runoff is revealed in our coral record (Figures 2 and 6). Although this record is surely a robust indicator of the onset of the anthropogenic footprint on the GoM and North America, its scope remains regional and precludes its use as an Anthropocene marker.
Conclusions
Corals are a unique archive presented here as a candidate for the Anthropocene GSSP. Corals are simultaneously recording the changes that we humans are making to our planet while also on the verge of becoming extinct themselves. Predictions for corals and coral reefs are that they could be dead by 2030 CE in some locations and by 2100 CE for most reefs. Hopefully, a few corals in places of refugia may survive, such as Flower Garden Banks. As the scientific community debates the Anthropocene, the GSSP site, and the year for the start of the Anthropocene, corals will ultimately become the recorder of their last years, passively archiving the changes in their environment, chronologize their stressors, the pollutants, and damage done to these otherwise multi-centenarians living organisms that are now doomed by humans to become a part of the rock record and no longer a part of the living planet Earth.
Supplemental Material
sj-pdf-1-anr-10.1177_20530196221147616 – Supplemental material for The flower garden banks Siderastrea siderea coral as a candidate global boundary stratotype section and point for the Anthropocene series
Supplemental material, sj-pdf-1-anr-10.1177_20530196221147616 for The flower garden banks Siderastrea siderea coral as a candidate global boundary stratotype section and point for the Anthropocene series by Kristine L DeLong, Kylie Palmer, Amy J Wagner, Mudith M Weerabaddana, Niall Slowey, Achim D Herrmann, Nicolas Duprey, Alfredo Martínez-García, Jonathan Jung, Irka Hajdas, Neil L Rose, Sarah L Roberts, Lucy R Roberts, Andrew B Cundy, Pawel Gaca, J Andrew Milton, Handong Yang, Simon D Turner, Chun-Yuan Huang, Chuan-Chou Shen and Jens Zinke in The Anthropocene Review
Research Data
sj-xlsx-1-anr-10.1177_20530196221147616 – Supplemental material for The flower garden banks Siderastrea siderea coral as a candidate global boundary stratotype section and point for the Anthropocene series
Supplemental material, sj-xlsx-1-anr-10.1177_20530196221147616 for The flower garden banks Siderastrea siderea coral as a candidate global boundary stratotype section and point for the Anthropocene series by Kristine L DeLong, Kylie Palmer, Amy J Wagner, Mudith M Weerabaddana, Niall Slowey, Achim D Herrmann, Nicolas Duprey, Alfredo Martínez-García, Jonathan Jung, Irka Hajdas, Neil L Rose, Sarah L Roberts, Lucy R Roberts, Andrew B Cundy, Pawel Gaca, J Andrew Milton, Handong Yang, Simon D Turner, Chun-Yuan Huang, Chuan-Chou Shen and Jens Zinke in The Anthropocene Review
Footnotes
Acknowledgements
Analysis of the West Flower Garden Bank core was facilitated by the collaborative research project between KLD and the Anthropocene Working Group (AWG) to ratify the stratigraphic Anthropocene. The AWG is co-ordinating the assessment of candidate GSSP sites in collaboration with the Haus der Kulturen der Welt (HKW, Berlin) in the framework of its long-term project Anthropocene Curriculum. The Anthropocene Curriculum is an international project for experimental forms of Anthropocene research and education developed by HKW and the Max Planck Institute for the History of Science (MPIWG, Berlin) since 2013. We are deeply grateful to the Flower Garden Banks National Marine Sanctuary for their assistance and access to coral and data resources. Corals were collected under permit FGBNMS-2005-002. We thank Ginesse Listi of the LSU FACES Laboratory for their assistance with the coral X-radiographs. Fred Taylor and Jud Partin at the University of Texas Institute for Geophysics for assisting with core slabbing. Chris Maupin and Brendan Roake at Texas A&M University for providing δ18O and δ13C analyses. We thank LSU PAST laboratory students Gilman Ouellette, Jacob Warner, Deborah Loke, Ashley Pomes, Othalia Roberts, Kendall Brome, and lab coordinator Sarah Crabtree for their efforts during this project. Coral data associated with this article are provided in a Supplemental Excel file. The authors are not aware of any affiliations, memberships, funding, or financial holdings that might be perceived as affecting the objectivity of this research.
Funding
The author(s) disclosed receipt of the following financial support for the research, authorship, and/or publication of this article: We would like to thank our funding source the Haus der Kulturen der Welt in support of the Anthropocene Working Group and this project. Additional support for this research is from the Department of the Interior South Central Climate Adaptation Science Center Cooperative Agreement G19AC00086 and the National Science Foundation award NSF-2102931 to KLD. Coral 230Th dating was supported by grants from the Science Vanguard Research Program of the Ministry of Science and Technology (MOST) (110-2123-M-002-009), the National Taiwan University (110L8907 to C.-C.S.), and the Higher Education Sprout Project of the Ministry of Education (110L901001 and 110L8907) to CCS.
Supplemental material
Supplemental material for this article is available online.
References
Supplementary Material
Please find the following supplemental material available below.
For Open Access articles published under a Creative Commons License, all supplemental material carries the same license as the article it is associated with.
For non-Open Access articles published, all supplemental material carries a non-exclusive license, and permission requests for re-use of supplemental material or any part of supplemental material shall be sent directly to the copyright owner as specified in the copyright notice associated with the article.