
Abstract
Corals are unique in the suite of proposed Anthropocene Global Boundary Stratotype Section and Point (GSSP) archives, as living organisms that produce aragonite exoskeletons preserved in the geological record that contain highly accurate and precise (<±1 year) internal chronologies. The GSSP candidate site North Flinders Reef in the Coral Sea (Australia) is an offshore oceanic reef, and therefore less vulnerable to local human influences than those closer to the coast. Here, we present geochemical records from two Porites sp. corals sampled at an annual to pluri-annual (i.e. 3–5 years) resolution that shows clear global and regional human impacts. Atmospheric nuclear bomb testing by-products (14C,239+240Pu) show a clear increase in the Flinders Reef corals coincident with well-dated nuclear testing operations. By contrast, the radionuclides 241Am and 137Cs are present at low or undetectable levels, as are spheroidal carbonaceous fly-ash particles. Coral δ13C shows centennial variability likely influenced by growth effects in the 18th century and with a progression to lower values starting in 1880 CE and accelerating post-1970 CE. The latter may be related to the Suess effect resulting from 13C-depleted fossil fuel burning. Coral δ15N decreased between 1710 and 1954 CE with a reversal post-1954 CE. Coral temperature proxies indicate prominent centennial variability with equally warm conditions in the 18th and end of 20th century. However, the exact mechanisms responsible for the mid-20th century changes in these parameters need to be scrutinised in further detail.
Plain Language summary:
This work proposes a candidate natural archive for the official marker of the Anthropocene that geologists will use to mark this important interval in time. Our candidate is a live coral from North Flinders Reef in the Coral Sea (Australia), located 150 km east of the Great Barrier Reef, a location that is remote from direct local human influences. Corals are a unique archive of tropical ocean change because they incorporate the geochemical signature from seawater into their limestone skeleton during their long life-spans. Here we investigated a number of geochemical markers in yearly growth layers of the corals to define several markers for the Anthropocene based on changes in temperature, water chemistry, chemicals from pollution and fertilisers, radioactive products from nuclear bomb testing, and by-products from burning fossil fuels. We have detected clear human influences in several of these markers.
Introduction
Corals build their skeletons in such a way that a detailed history of their environment and local water chemistry is preserved which scientists can ‘read’ using various geochemical analyses. The coral polyps live on top of their exoskeletons that are made of aragonite (a mineral form of calcium carbonate) and vary the density of the exoskeleton throughout the year as they grow, thus providing an internal annual chronology which is visible when X-rayed, similar to tree-rings. These annual bands allow scientists to locate individual years of growth in coral, and thereby correlate the coral’s skeletal geochemical history to calendar dates with high accuracy (Lough and Cantin, 2014). Coincidently, the discovery of coral’s internal annual density bands was made by examining corals from Eniwetok Atoll for radioactivity from nuclear testing and correlating these test dates to the coral’s density bands (Knutson et al., 1972).
As corals grow, they preserve a record of the water chemistry in their aragonitic exoskeletons that allows reconstruction of past environmental and climatic conditions at weekly to annual resolution for several centuries (Thompson, 2022). The geochemical proxies in Porites sp. corals used for reconstructions with the highest fidelity include coral Sr/Ca for temperature (Calvo et al., 2007; Corrège, 2006; DeLong et al., 2012; D’Olivo et al., 2018; Thompson, 2022) and δ18O paired with Sr/Ca for temperature and hydroclimate (Reed et al., 2022; Thompson, 2022). Recently developed (Li/Ca, Li/Mg, Sr-U) proxies have produced accurate reconstructions for temperature (DeCarlo et al., 2016; Montagna et al., 2014; Wu et al., 2021a; Zinke et al., 2019). The use of climate and environmental markers in corals (14C, δ13C, δ15N, Hg, Ba/Ca, etc.) including Porites sp. have been reviewed by Saha et al. (2016). Radiogenic isotopes including radiocarbon (14C) and plutonium provide a precise record of nuclear testing (e.g. Druffel and Griffin, 1995, 1999; Froehlich et al., 2016; Lindahl et al., 2011, 2012; Sanchez-Cabeza et al., 2021; Wang et al., 2016). Potential markers for pollution include heavy metals (Hg, Pb, Cu, Zn etc.) (Chen et al., 2010; Fallon et al., 2002; Ramos et al., 2009
For this study, we have selected massive stony (scleractinian) Porites sp. corals that grow to around 4 m in height and 6 m across from North Flinders Reef in the remote central Coral Sea located to the east of the Great Barrier Reef in the southwestern Pacific Ocean. Flinders Reef has been monitored and studied for decades by Parks Australia, and the Australian Institute of Marine Science, which holds the world’s largest coral core repository, providing a good foundation of knowledge to support our Flinders Reef investigation (Calvo et al., 2007; Hendy et al., 2002; Hoey et al., 2021; Pelejero et al., 2005). It is also part of the Coral Sea Marine Park, one of the largest isolated marine parks in the world, so the area is both protected and actively managed.
Massive Porites sp. are widespread across the Indo-Pacific and are particularly useful for geochemical analysis since they have a long life-span (up to 500 years) and grow continuously at intermediate speed (1–2 cm year−1; Cantin and Lough, 2014; Thompson, 2022). Previous studies on a Flinders Reef coral reported 5-year resolution data on boron isotopes (δ11B; a proxy for seawater pH; Pelejero et al., 2005), δ13C (Pelejero et al., 2005) and temperature proxies (Sr/Ca, δ18O; Calvo et al., 2007) from the northwest lagoon of North Flinders Reef while the corals selected for this GSSP study were obtained from the southern cays of North Flinders Reef. The 5-year average pH, Sr/Ca, δ18O and δ13C records for Flinders Reef (core FLI02A) are dominated by strong decadal variability (Figure S1; Calvo et al., 2007; Pelejero et al., 2005). The decadal variability in Flinders Reef was ascribed to the Pacific Decadal Oscillation (PDO) and Interdecadal Pacific Oscillation (IPO; Henley, 2017; Power et al., 1999), which are known to regulate South Pacific ocean climate.
Here, we build on earlier work and expand the analysis by presenting new data on stable isotopes (yearly resolved δ18O, δ13C, δ15N) (3–5-year averages pre-1930 CE), trace elements (yearly resolved Sr/Ca, Mg/Ca, Ba/Ca ratios), radiocarbon, radiogenic isotopes (137Cs, 210Pb, 241Am, 239+240Pu), lead isotopes, mercury and spheroidal carbonaceous particles (SCPs). The aim of our work is to assess whether Flinders reef corals are a suitable archive to define an Anthropocene Global Boundary Stratotype Section and Point (GSSP).
The preparatory activities of the Anthropocene Working Group, including events leading to the submission of GSSP proposals and the binding decision that the base of the Anthropocene should align with stratigraphic signals dating to the mid-20th century, are detailed in the introductory article to this special issue (Waters et al., 2023).
Materials and methods
Geographic setting of core sites
The Coral Sea is bounded to the north by the Papuan peninsula and the Louisiade archipelago and to the south by the submerged Queensland Plateau (Weissel and Watts, 1979). The Coral Sea was formed as seafloor spreading started 62 million years ago (Ma), this being thought to have ceased by approximately 56 Ma. The first coral reefs were established in the Late Oligocene to Early Miocene on the edges of the Queensland Plateau, most probably on ridges (Weissel and Watts, 1979). The Holocene reef of the Flinders Reef most likely grew on top of the Last Interglacial reef framework and previous reef generations, similarly to the evolution of the Great Barrier Reef (Braithwaite et al., 2004). The present-day Flinders Reef lies in the central Coral Sea (Australia) around 250 km from the north-east coast of Australia, 150 km north of the main band of the Great Barrier Reef and, at 40 km long, is one of the largest separate reef systems in the Coral Sea (Hoey et al., 2021).
Major ocean currents affecting Flinders Reef are the two branches of the westwards flowing South Equatorial Current (SEC), which strengthens during the austral summer (December to March) and bifurcates on the Australian continental shelf to form a southwards flowing East Australia Current (EAC) and a northern branch flowing towards the Gulf of Papua (Kessler and Cravatte, 2013; Ridgway et al., 2018; Rousselet et al., 2016; Figures 1 and S1). However, the SEC is not simply a westwards flowing coherent band, but is rather composed of filaments and jets that are controlled by the complex bathymetry created by the presence of islands, reefs, seamounts and ridges (Kessler and Cravatte, 2013; Ridgway et al., 2018; Figure S1). Two zonal jets, the North Vanuatu Jet (NVJ) and North Caledonian Jet (NCJ), formed by the split of the westward flowing SEC, are diverted around Fiji, Vanuatu and New Caledonia. The surface component of the NVJ bifurcates into the equatorwards flowing Gulf of Papua Current and the polewards flowing EAC, which is adjacent to Flinders Reef. The surface component of the NVJ can influence Flinders Reef through its split into the EAC. The surface component of the NCJ joins the southwards flowing EAC. However, the deeper component (below ~200 m) of the NCJ flows equatorwards adjacent to the slope, as seen in Ridgway et al. (2018). The NCJ is thought to possibly influence Flinders Reef by bringing lower thermocline waters to the surface, which later feed the northward flowing Deep Gulf of Papua Current (Ridgway et al., 2018). There may be time-varying eddies and filaments that can separate from the surface mean flow of the NCJ and affect Flinders Reef.
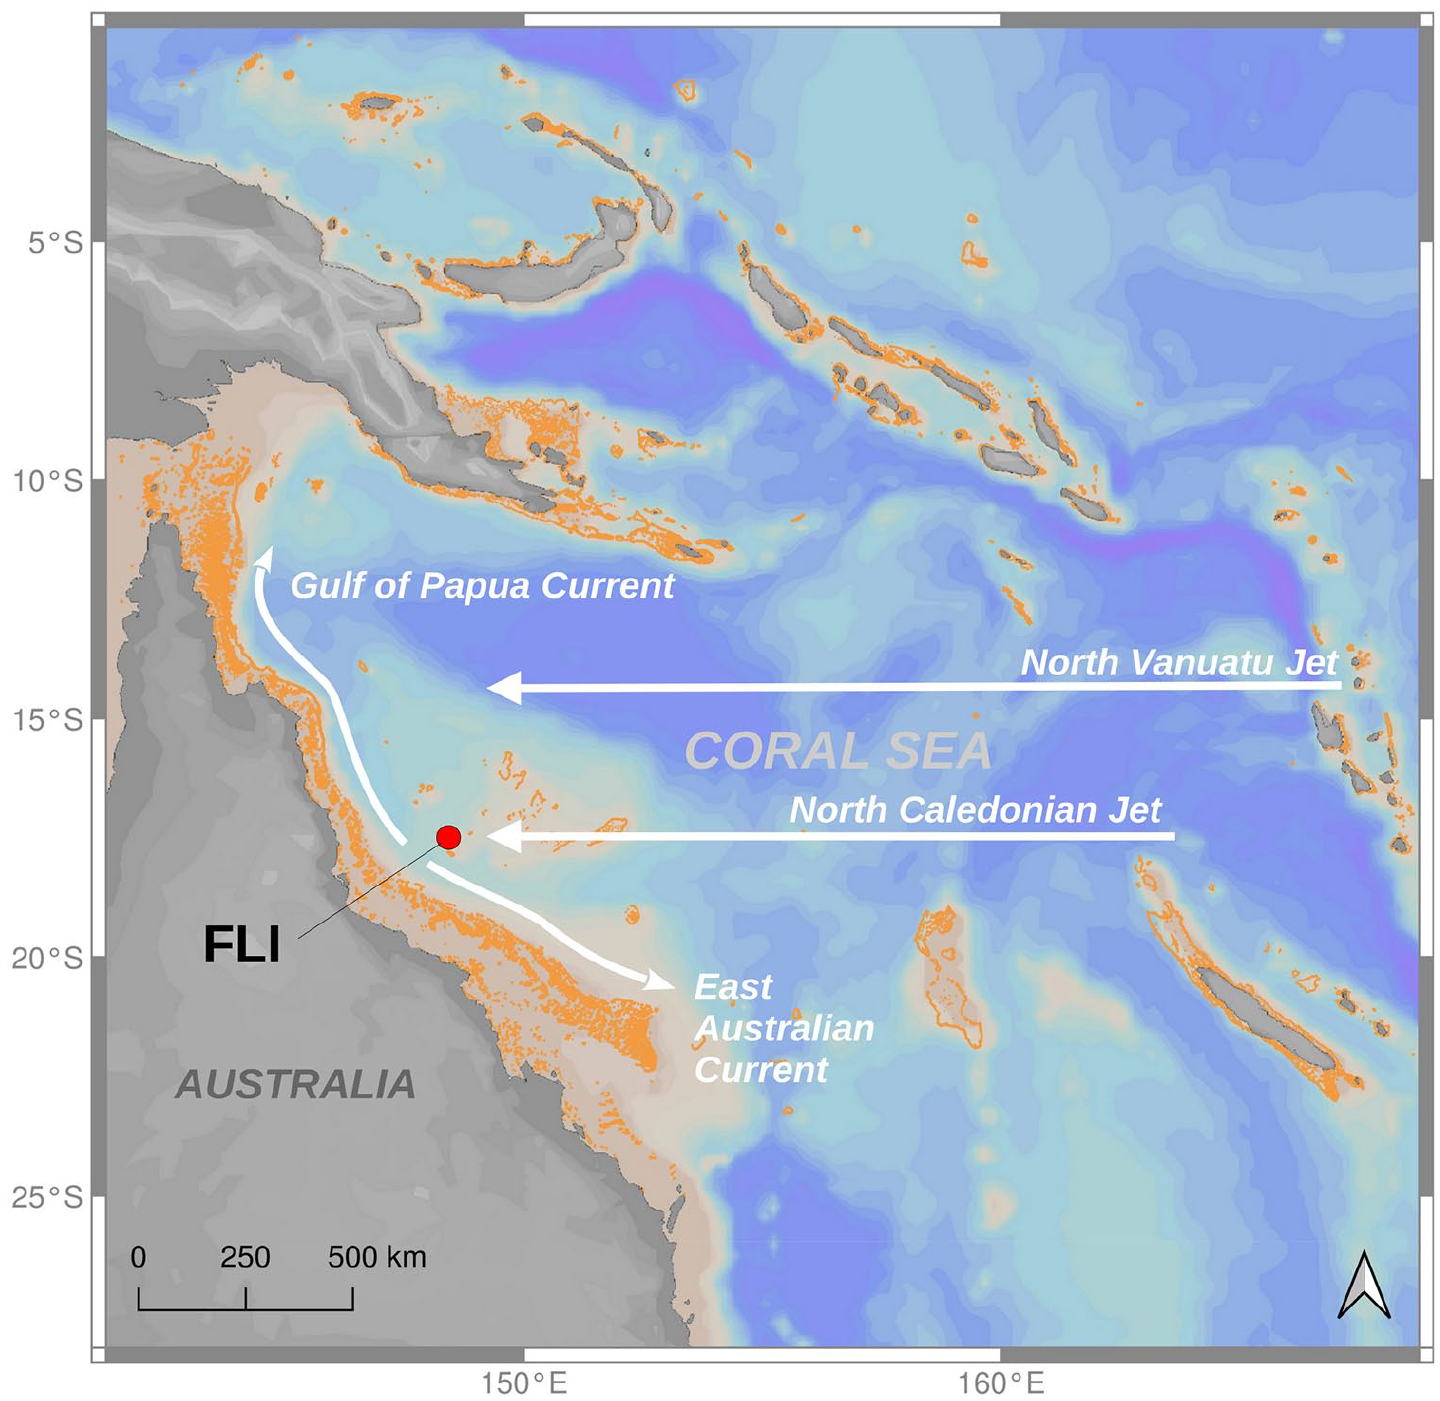
Map of the Coral Sea with Flinders Reefs (red dot) and most important surface ocean currents indicated. The North Vanuatu Jet (NVJ) and the North Caledonian Jet (NCJ) originated from the division of the South Equatorial Current (SEC) due to the seafloor topography. The NVJ and the NCJ bifurcate at latitude 15–18°S into the northward Gulf of Papua Current (GPC) and the southwards flowing East Australian Current (EAC). Coral reefs are shown in orange. Map background: Ocean Data View, coral reefs footprint: WCMC-008-CoralReefs2010. Reproduced in colour in online version.
The climate of Flinders Reef is under the influence of the Australian monsoon that peaks in the austral summer (December to March) when highest rainfall and sea surface temperatures (hereafter SST; approx. 29°C) in the region are recorded (Calvo et al., 2007). The seasonal range in SST is 4°C–5°C with lowest SST around August in any given year (austral winter). The austral summer season is the season of tropical cyclone (TC) occurrences (Puotinen et al., 2020). Locally, the impact from TC has led to periodic destruction of coral reefs in the central Coral Sea (Ceccarelli et al., 2013; DeCarlo et al., 2019; Hoey et al., 2020, 2021; Puotinen et al., 2020). The period between 1990 and 1997 CE was marked by high TC activity affecting the central Coral Sea with seven notable to severe events (Hoey et al., 2020). Two additional strong TCs were recorded in 2014 (Dylan) and 2017 CE (Debbie). Such cyclones affect Flinders Reef when damaging wave heights exceed 4 m.
Because Flinders Reef is an offshore, oceanic reef, it is less vulnerable to local human influences and has lower tourism numbers than those closer to the coast, which also receive pollution from the coast and rivers through sedimentation. This means that the signals that these corals record are more indicative of global and regional changes in addition to site-specific variations. It is a truly oceanic reef dominated by natural oceanographic variability and the multiple effects from anthropogenic climate change. As with many Coral Sea reefs, Flinders Reef has been affected by coral bleaching (DeCarlo et al., 2019; Hoey et al., 2021) with the most recent bleaching reported in 2020 CE and resulting in a decline of coral cover of 59% (Hoey et al., 2021). Even hardy coral species, such as massive Porites and Favites, have suffered severe bleaching in recent years. Previous coral bleaching events were also reported in 2016 and 2017 CE with >50% declines in coral cover (DeCarlo et al., 2019; Harrison et al., 2019; Hoey et al., 2020). Thus, the effects of anthropogenic climate change are unequivocally felt across the Coral Sea.
Field collection of core, sampling and core imagery
A 3 m-long core was extracted from the southern section of North Flinders reef in May 1992 (FLI01A; GPS: 17.7179S 148.45102E) from approximately 5 to 10 m water depth by the Australian Institute of Marine Science (AIMS) using a hydraulic drill system, and a 0.5 m-long core in December 2017 (FLI05A; GPS: 17.70472S, 148.46541E) from 5 m water depth by a team of divers from James Cook University (Australia) and the University of Western Australia using a pneumatic air drilling system during a research cruise with MV Phoenix (DeCarlo et al., 2019; Figure 2). They drilled vertically down from the top of the coral colony. Cores were drilled with 5 cm (FLI05A) and 9 cm (FLI01A) diameter bits, and core holes were filled with cement plugs to prevent infestation by bio-eroding organisms and to provide the coral tissue with a hard surface to grow over during recovery. Once retrieved, the core was rinsed with freshwater, sun-dried and stored on board the research vessel before sectioning at the Australian Institute of Marine Science. Here, we also make use of published data sets from coral core FLI02A described in Pelejero et al. (2005) and Calvo et al. (2007). For method details on FLI02A we refer the reader to the original publications. We emphasise that all cores can be re-cored if necessary given permission by the Marine Parks Australia. All cores are stored in the core depository of the Australian Institute of Marine Science.
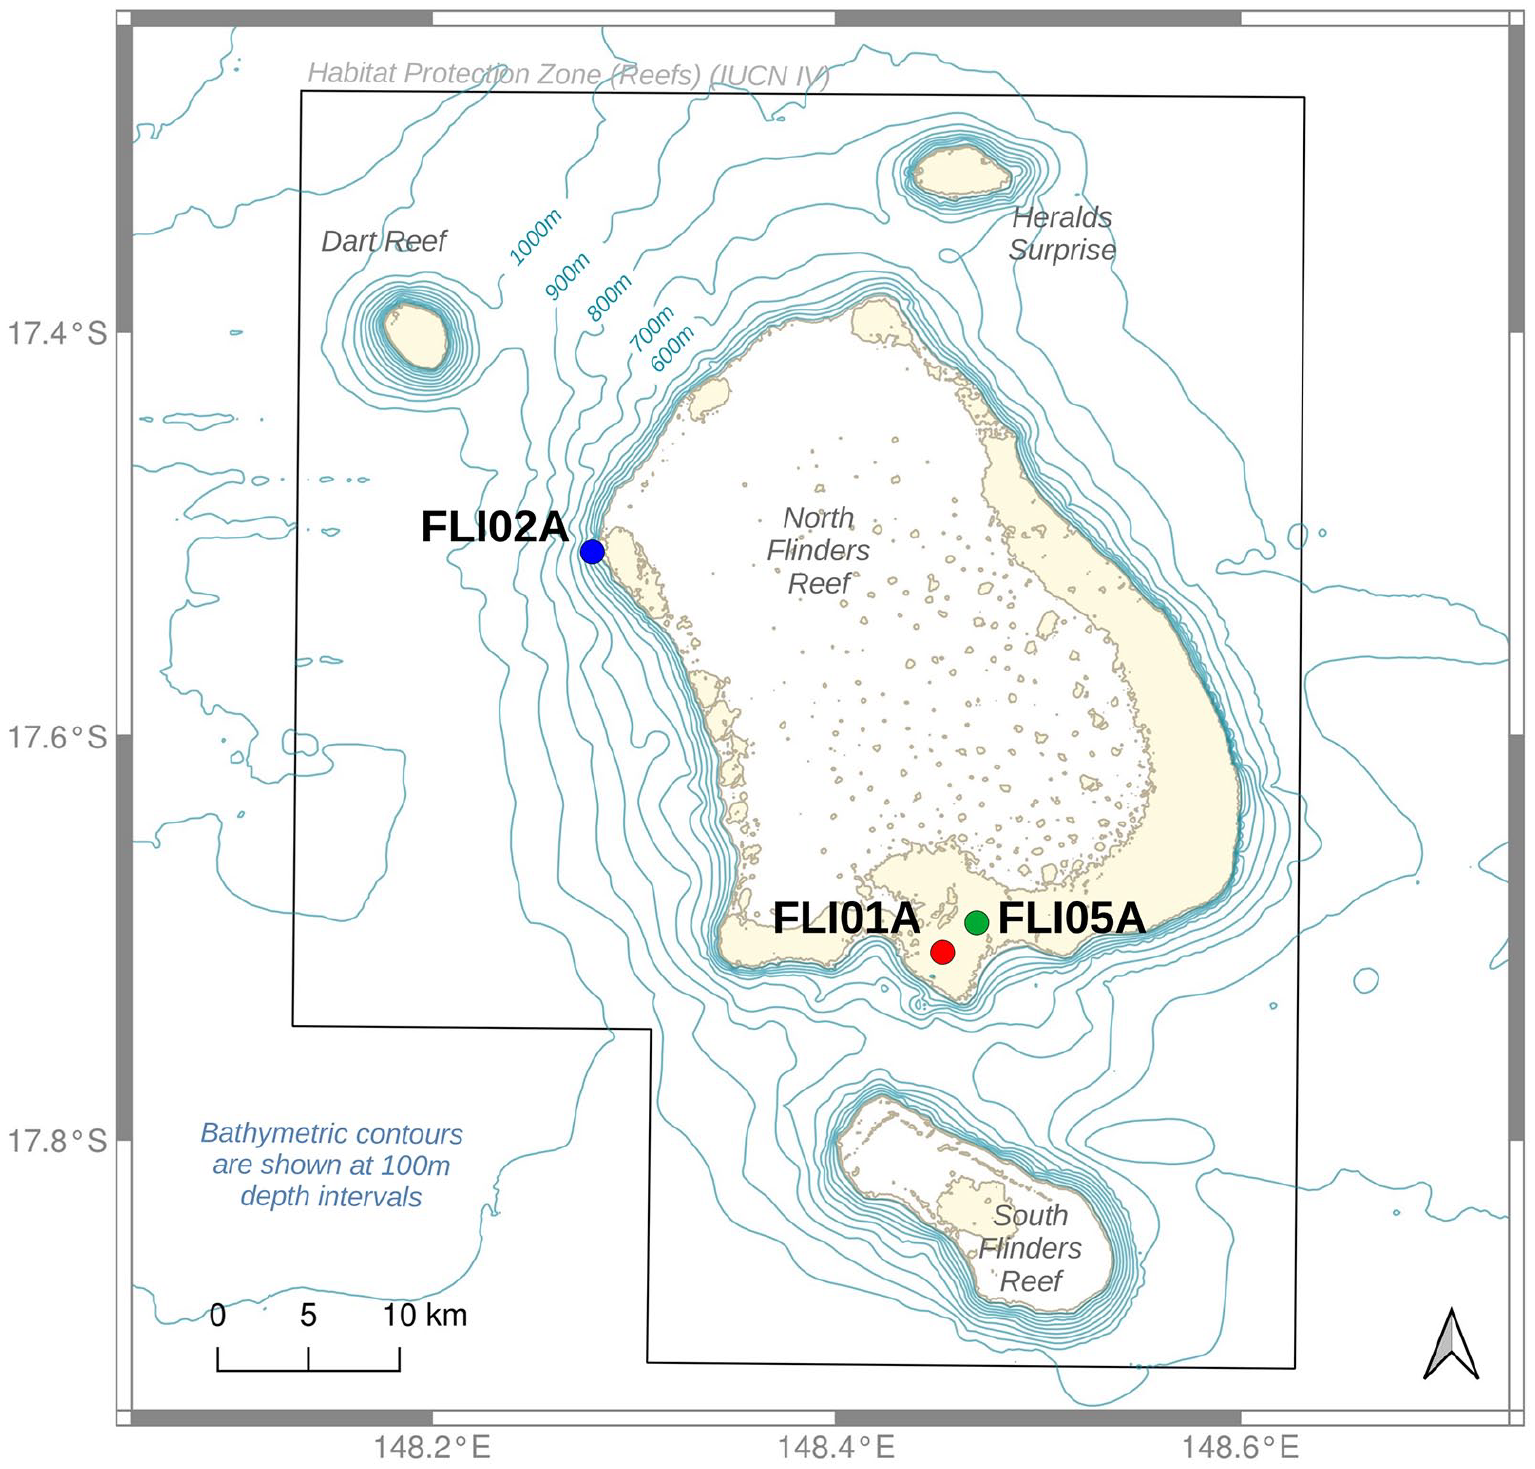
Map of North Flinders Reefs in the central Coral Sea with locations of coral cores. Map modified after Beaman (2010). Habitat protection zone indicated by an insight box. Bathymetry data from Coral Sea Marine Park – Flinders Reefs, Australian Government Department of the Environment, Commonwealth Australia 2018 (Beaman, 2010). UNEP-WCMC, WorldFish Centre, WRI, TNC (2021). Reproduced in colour in online version.
Cored samples (FLI01A and FLI05A) were sectioned longitudinally into 7 mm-thick and 5 or 9 cm-wide slabs along the main growth axis using a diamond blade precision saw at AIMS. Slabs were X-rayed to assess the optimal sampling path closest to the main growth axis (Figure 3). The sampling was guided by extremely well-preserved annual density banding from X-ray positive prints supported by densitometry at AIMS. The two Flinders Reef coral cores preserve archives from 1710 to 1992 (FLI01A) and 1835 to 2017 CE (FLI05A), respectively. However, core FLI05A has only been sampled from between 1988 to 2017 CE and so there is a 4-year overlap with core FLI01A. In order to extract approximately annual samples from the coral slab surface, an automated micromill system (ZENBOT) in the AIMS Laboratory was used to extract microsamples. The mill is computer controlled (speed, r.p.m. and x/y/z movement) and was fitted with a 2.5-mm diameter tungsten carbide drill bit. Annual sampling was undertaken by sampling at 2.5 mm depth evenly along the entire length of each annual density band couplet consisting of a low- and high-density band. Both cores have been sampled at bimonthly resolution (i.e. six samples per annual growth band) from 1940 CE to the end of core. Pre-1940, FLI01A was sampled at annual resolution. For this study, we have resampled both cores to annual resolution for the post-1940 period taking splits of the bimonthly samples for each individual year to obtain an annual sample of approx. 20–50 mg (FLI01A: 1940–1992 CE; FLI05A: 1988–2017 CE). All annual sample splits were divided into annual sub-samples for various geochemical analyses according to the desired specific sample weight (Table 1). Hereafter, we use the abbreviation F1 for core FLI01A and F5 for core FLI05A.
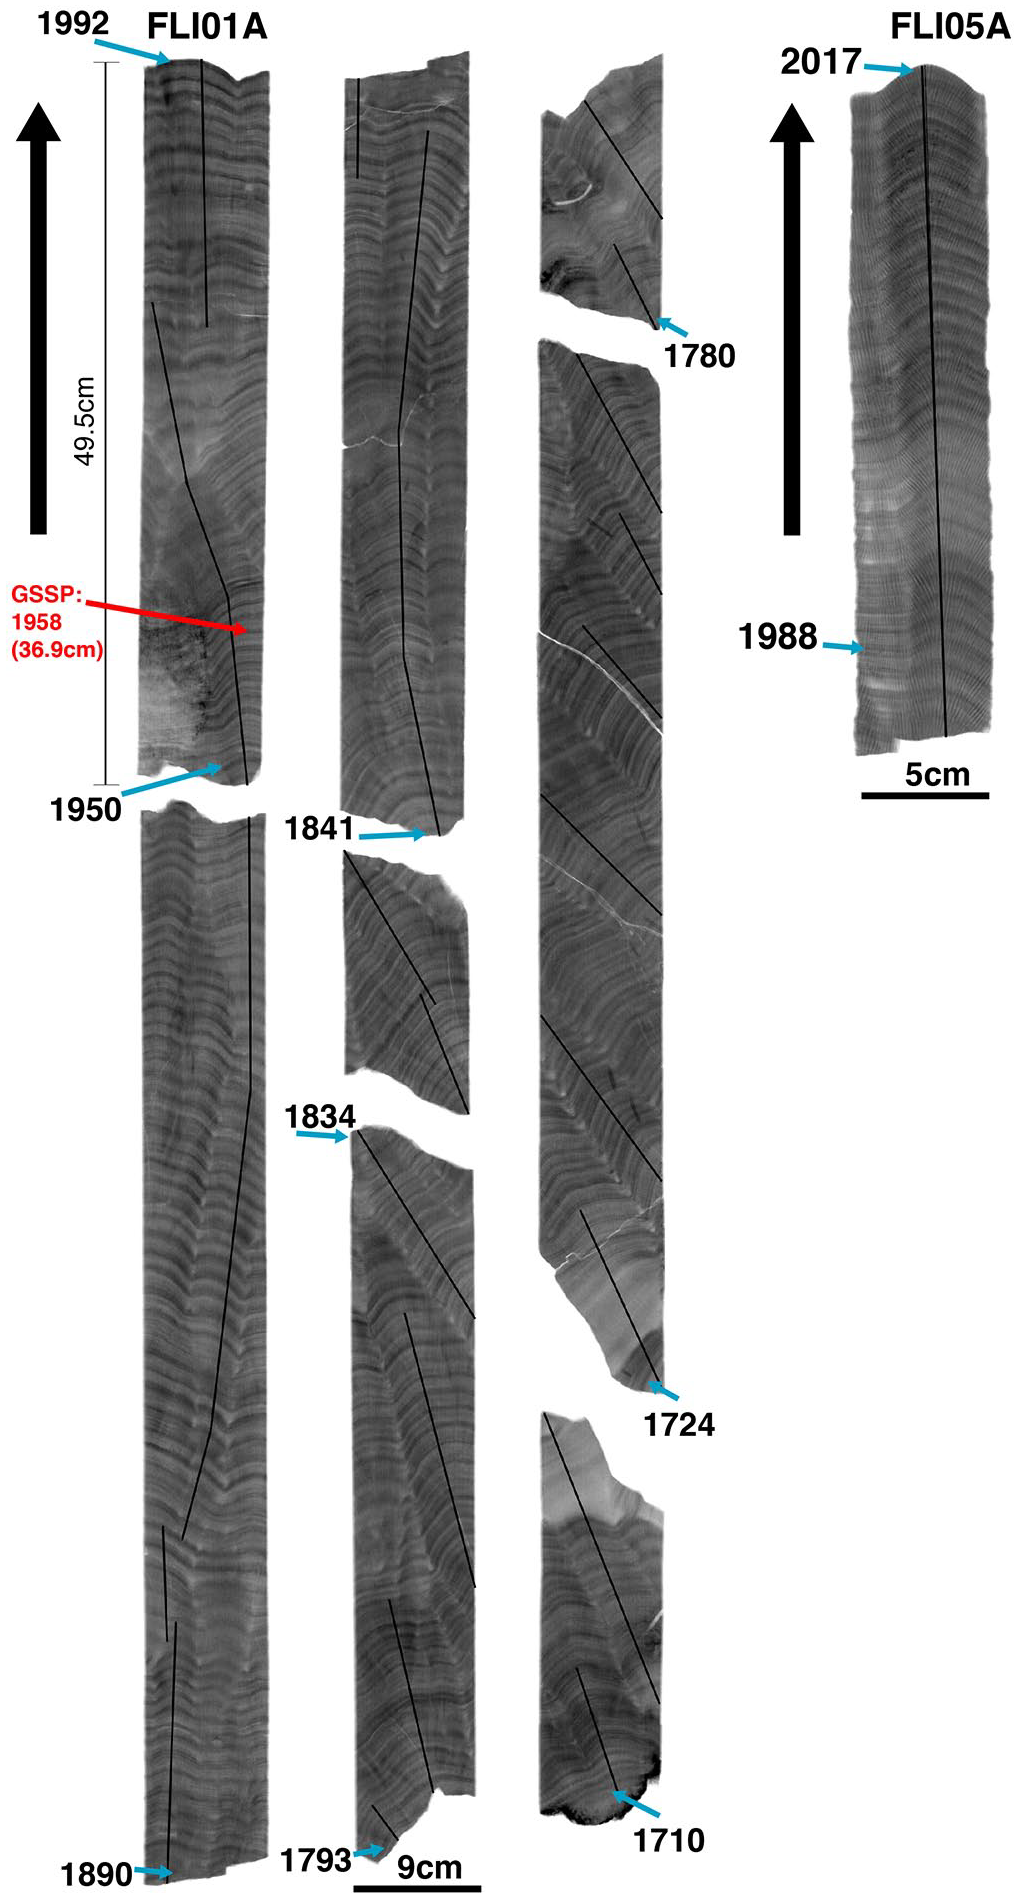
X-ray positive prints of cores FLI01A (F1) and FLI05A (F5) with sampling transects indicated (black lines). Years and arrows next to X-ray positive prints indicate top and bottom age in the core sections. The proposed depth and year (CE) for the Anthropocene GSSP is indicated (red). Reproduced in colour in online version.
Sample details used for specific geochemical analysis.
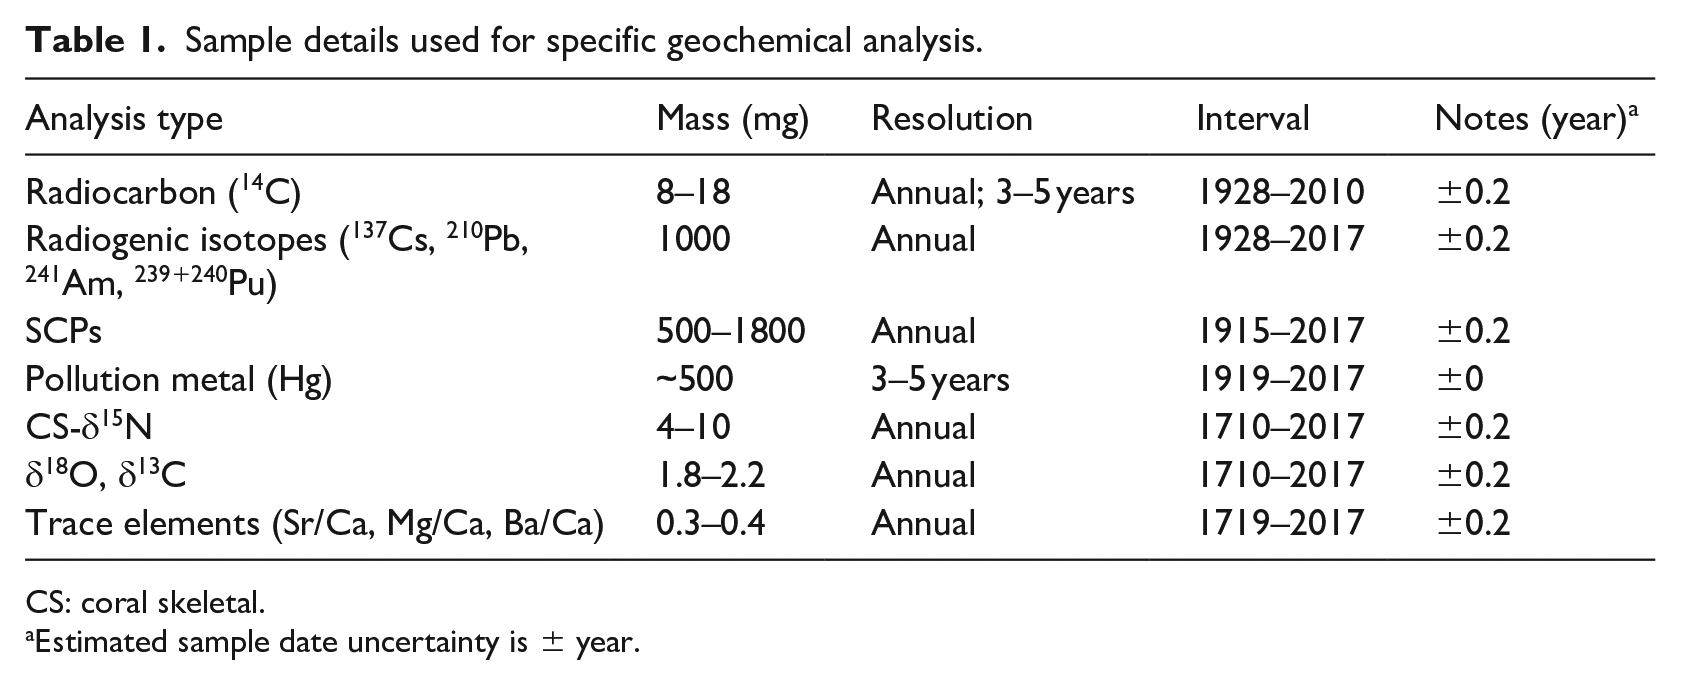
CS: coral skeletal.
Estimated sample date uncertainty is ± year.
Chronological controls
Chronologies in corals are determined by counting annual density band couplets from the top of the core when collected live and the collection date is known (December 2017 for core FLI05A; May 1992 for core FLI01A). Yearly chronologies were established by X-ray based densitometry at AIMS following the method of Cantin and Lough (2014). Density was measured using X-ray densitometry along the slice from each core that showed the clearest presentation of annual density bands. Based on the annual high-density band forming in summer and the annual low-density band in winter, successive density peaks were dated from the date of collection of each core. Once dated, the following variables were extracted for each coral slice: (1) annual linear extension (cm yr−1), measured as the linear distance between adjacent high-density maxima, (2) annual average skeletal density (g cm−3), measured as the average density between high-density maxima, (3) annual calcification rate (g cm−2 yr−1), calculated as the product of annual extension and annual density. Annual date locations from the X-ray prints and densitometry analyses were used to locate and guide the annual, 3- and 5-year sampling for parts of the geochemistry analyses using Zenbot CNC Router and a millepore CF/F filter vacuum to collect coral powder samples along the maximum growth axis transects depicted in Figure 3. Additional annual samples were cut from consecutive high density to high density bands for radiogenic isotopes (137Cs, 210Pb, 241Am, 239+240Pu), mercury concentrations and spheroidal carbonaceous fly-ash particles (SCP) analysis. To ease comparison between geochemical profiles with differing absolute values in both cores we calculated centred anomalies for all records by subtracting the mean over the entire record length (1710–1992 CE for FLI01A and 1988–2017 CE for FLI05A).
Anthropocene proxies
The prime Anthropocene markers (Table 1) include radiocarbon (Δ14C) showing the bomb spike from nuclear weapons testing in the 1950s and 1960s, radiogenic isotopes (239+240Pu) also showing bomb spike signals, δ13C for uptake of fossil-fuel light carbon by the oceans and skeletal nitrogen isotopes (CS-δ15N) as potential tracers of anthropogenic nitrogen pollution. For details on all analytical methods we refer the reader to the Supplemental Material.
Results
Coral growth parameters and chronology
Neither coral cores used for this study have core breaks or hiatuses, thus contain a highly precise and continuous annual chronology. The coral X-radiographs for the slabs used in this study have clear annual density bands and the years are easily marked. The entire coral core time series (from both cores) spans 2017–1710 CE as determined by counting annual density bands in the X-radiographs. Flinders Reef core FLI01 spans 1992–1710 CE and has a mean extension rate of 1.06 ± 0.27 cm yr−1, a mean density of 1.45 ± 0.6 g cm−3 and a mean calcification rate of 1.54 ± 0.40 g cm−2 yr−1 (Figures 4 and S2). Flinders Reef core FLI05 spans 1988–2017 CE and has a mean extension rate of 0.78 ± 0.19 cm yr−1, a mean density of 1.76 ± 0.1 g cm−3 and a calcification rate of 1.37 ± 0.32 g cm−2 yr−1. Coral extension rates for Flinders Reef core FLI01 revealed a slight increase between 1710 and 1900 CE followed by stable growth rates up to 1992 CE. FLI05 extension and calcification rates are lower than those of FLI01 and are dominated by interannual and decadal variability without a clear long-term trend. Lowest extension and calcification rates in FLI05 are observed between 1967 and 1972, 1993 and 1998 and between 2003 and 2016 CE. FLI05 has an overall higher density than FLI01.
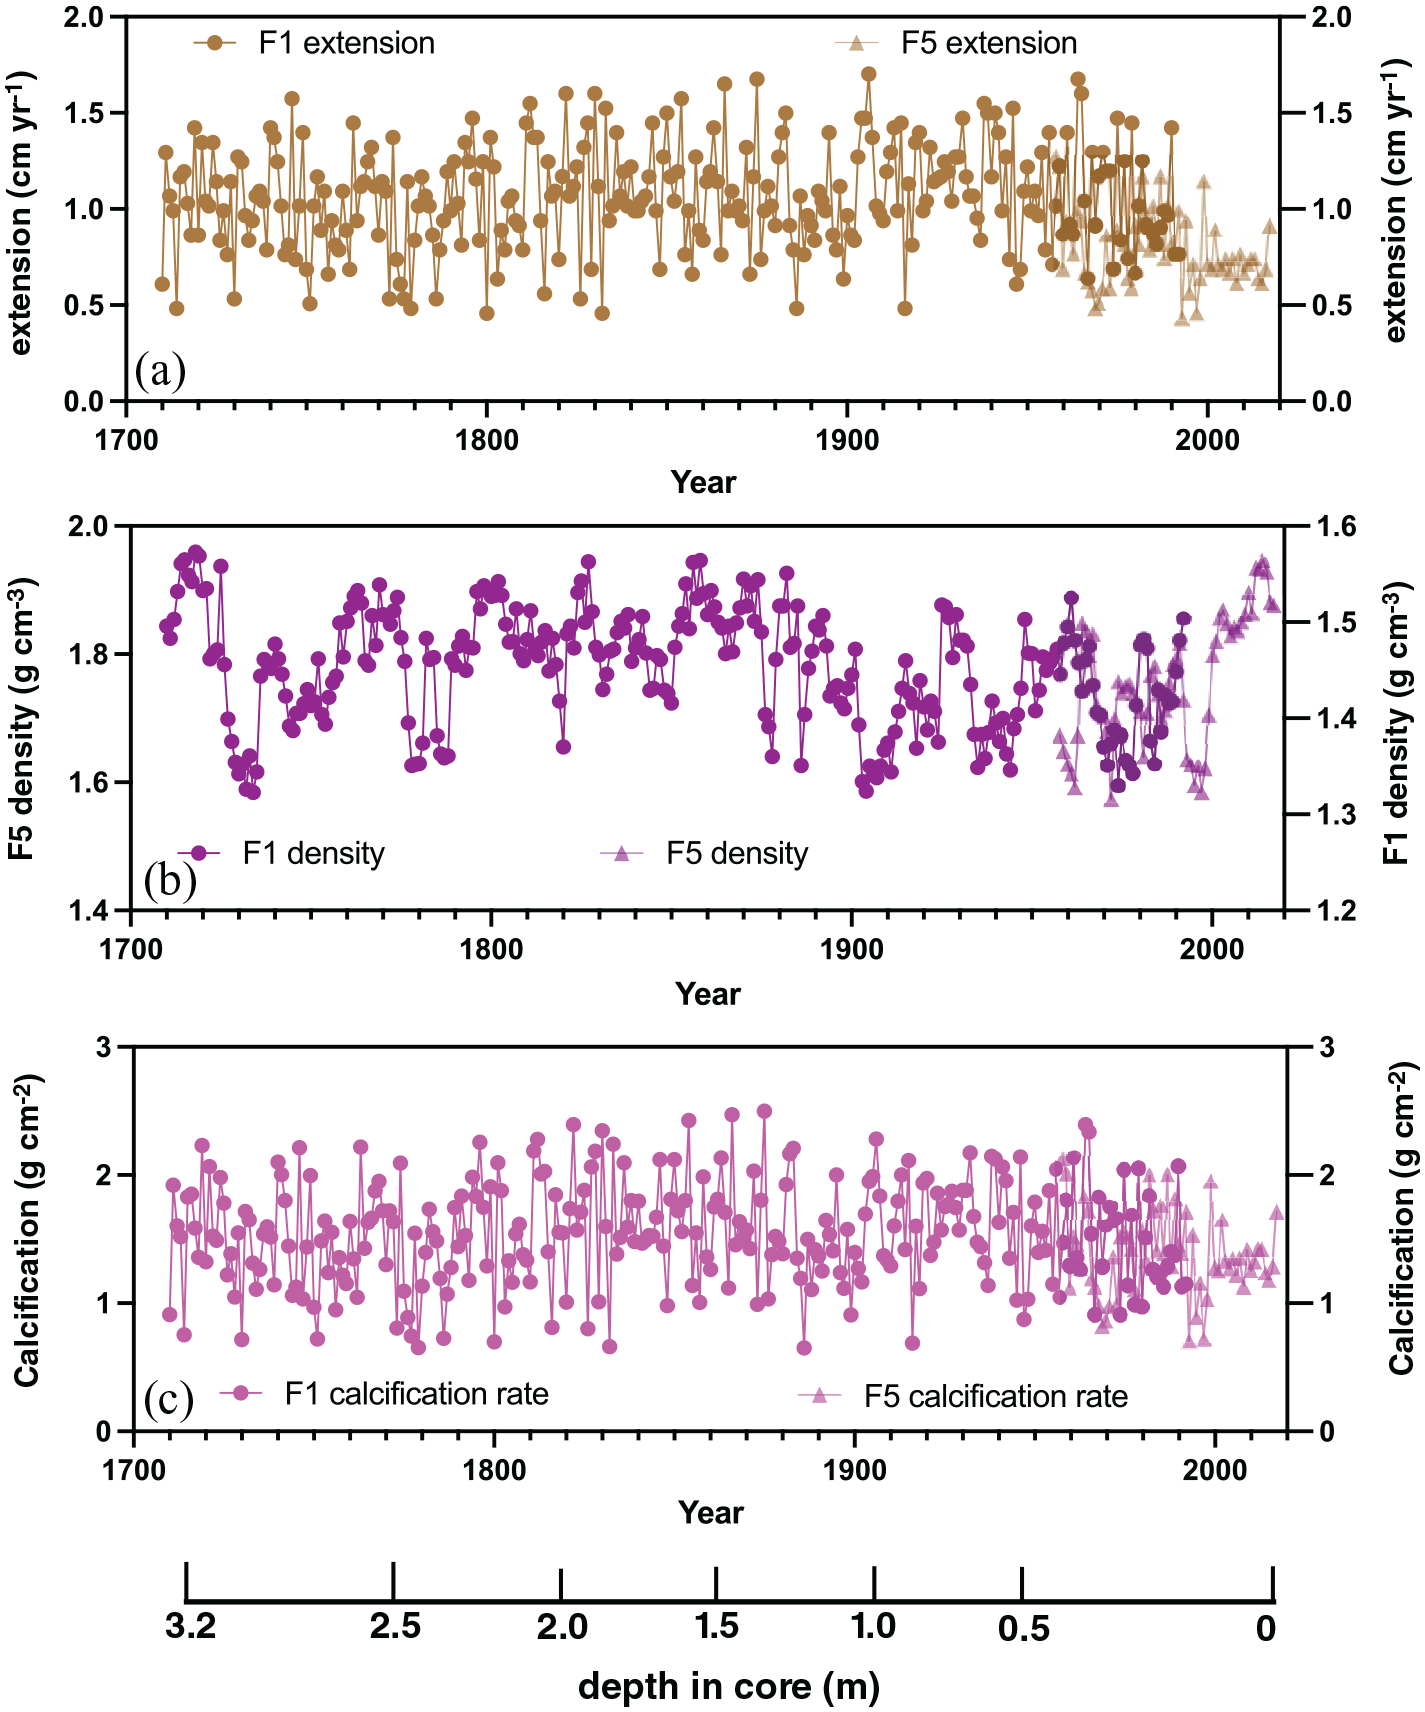
Coral growth parameters for cores FLI01A (F1) and FLI05A (F5) from Flinders Reef: (a) linear extension rate, (b) skeletal density and (c) skeletal calcification rate. Depth in core (in m) indicated and years in Common Era (CE). Reproduced in colour in online version.
Radiocarbon
Δ14C for cores FLI01 and FLI05 is shown at biannual resolution for 1928–1930 and 1934–1936, at annual resolution between 1950 and 1967 and yearly samples were taken from 1940, 1945, 1970, 1975, 1980, 1990, 2000 and 2010 CE (Figure 5). The Δ14C time series indicates a clear bomb spike with a dramatic rise between 1957 and 1959 CE (Figure 5). The peak values were observed in 1980 CE after which the Δ14C values slowly decreased. This result agrees with coral samples from across the Great Barrier Reef (Druffel and Griffin, 1995, 1999; Wu et al., 2021b). Previous analysis of GBR coral Δ14C profiles have provided data back to 1635 CE (Abrahams Reef; Druffel and Griffin, 1999; Figure 5). The Flinders Δ14C record between 1928 and 2017 CE perfectly overlaps with previous analyses supporting a common trajectory of Δ14C across the GBR and Coral Sea (Figure 5).
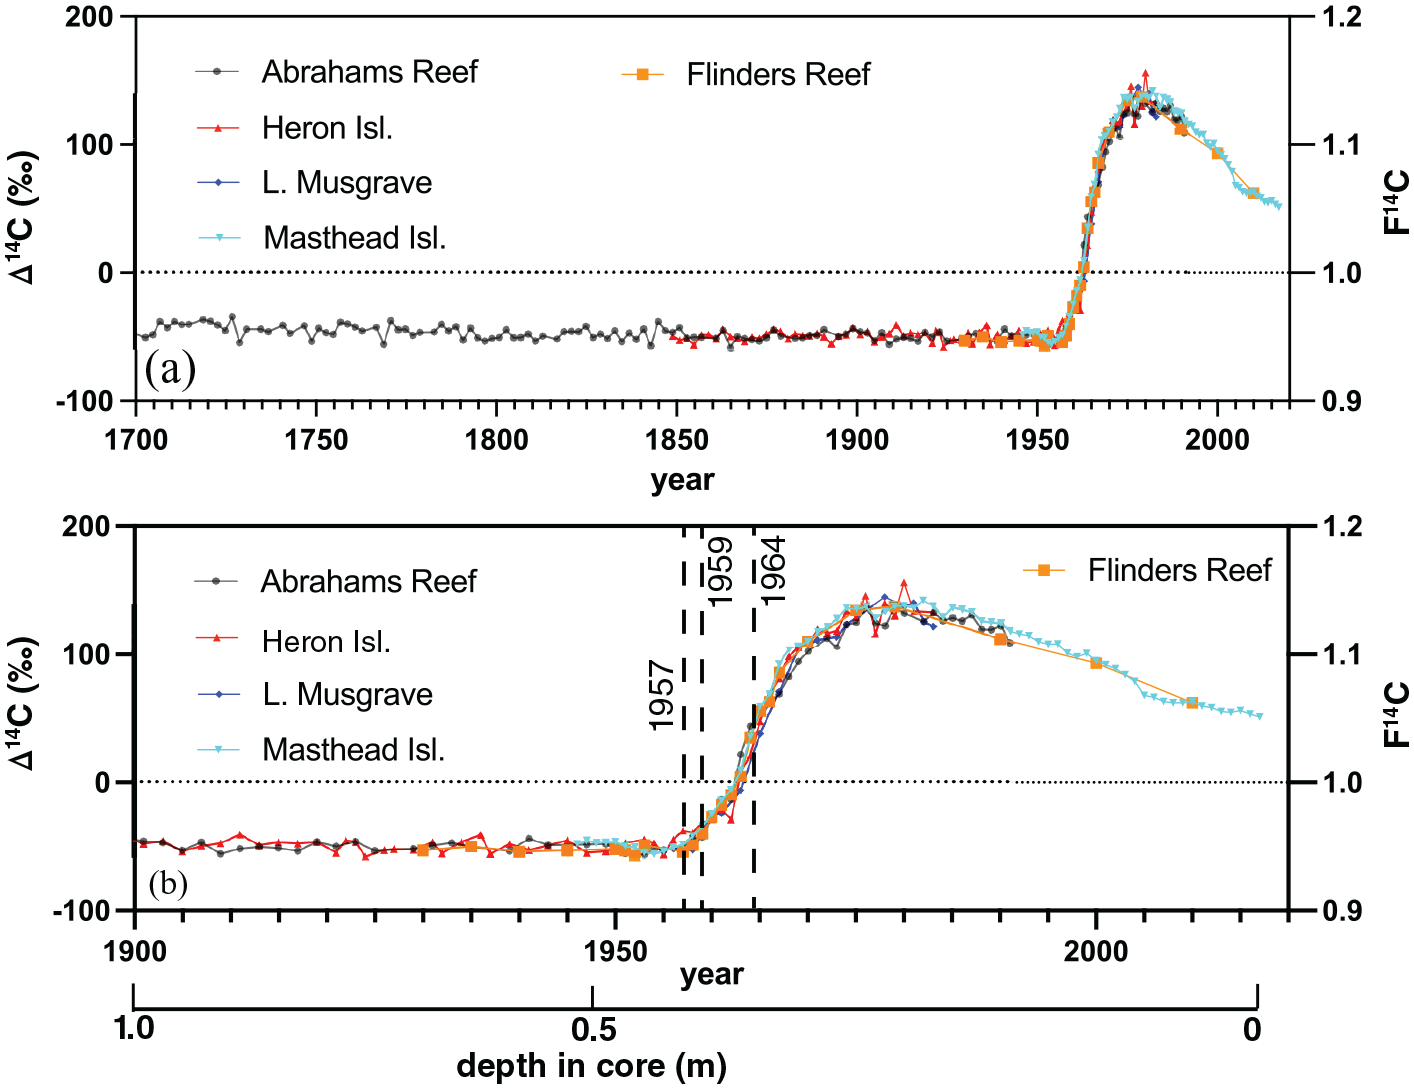
Δ14C or F14C of Flinders Reef coral cores FLI01A and FLI05A (orange) compared to (a) published records from across the Great Barrier Reef dating back to 1700 CE and (b) dating back to 1900 CE with depth scale (in m) below. The vertical dashed lines indicate the start of Δ14C (F14C) exceeding the natural background between 1957 and 1959 and the midpoint of the inflection in 1964 CE. Reproduced in colour in online version.
Artificial fallout radionuclides
137Cs was not detected in any of the samples analysed (Table S1) while 241Am was only detected in the 1965 sample (Table S1). While measured 239+240Pu activities are low, activity data (Figure 6; Table S2) show marked increases in 1954, 1958, 1960 and 1966 CE that coincide with (or slightly post-date) periods of thermonuclear weapons testing that released Pu and other radionuclides into the atmosphere. Pre-1954, Pu activities (in coral samples corresponding to 1952, 1950 and 1948) were below analytical detection limits, although 239+240Pu was detected in the sample corresponding to 1940, indicating some mobility of anthropogenic Pu after incorporation in the coral, as observed by Lindahl et al. (2011). There is a decline after 1966 (to below detection limits in 1970) but Pu activity is still detectable in 1980 in core FLI05A.
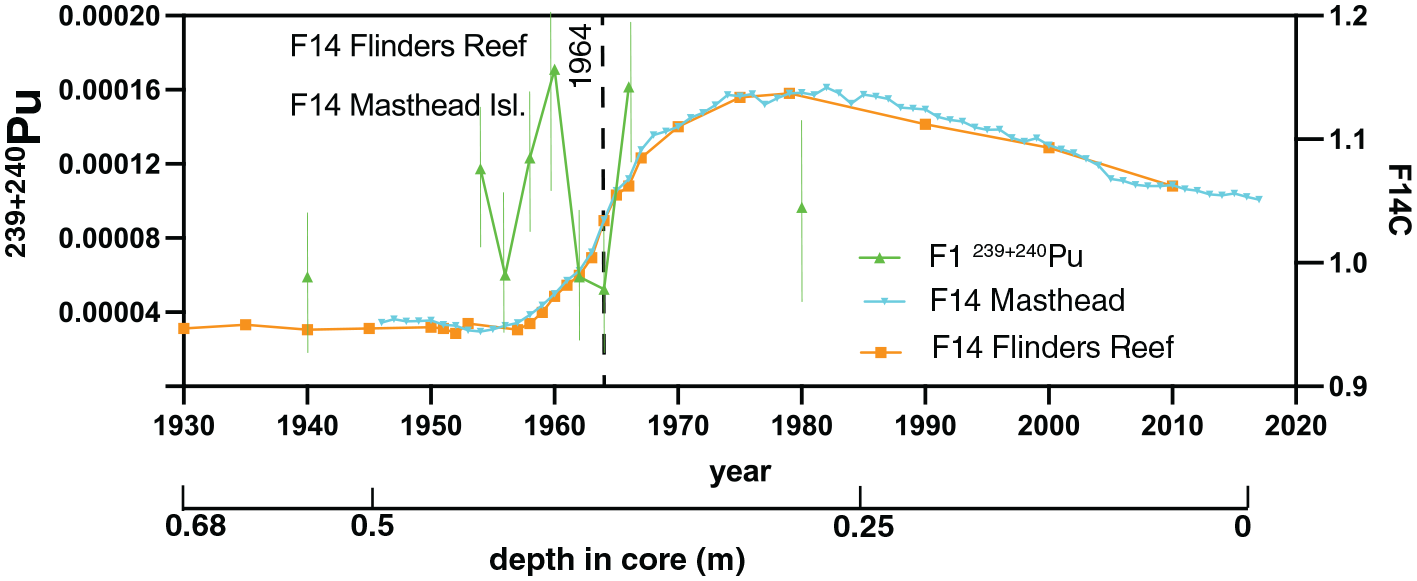
Plutonium activity record (in Bq/g, error bars in thin green lines) of core FLI01A compared to Δ14C from Flinders Reef and a Great Barrier location (Masthead Island; Wu et al., 2021a). 1964 CE inflection in Δ14C indicated by dashed line. Depth in core (in m) indicated and years in Common Era (CE). Reproduced in colour in online version.
Total 210Pb, 226Ra and unsupported 210Pb (derived from atmospheric fallout) activities are given in Table S3. Total 210Pb activities in the Flinders coral cores are low from the core top, and unsupported 210Pb activities are also negative. These measurements are unable to provide supporting data for the coral chronology.
Spheroidal carbonaceous fly-ash particles (SCP)
No SCPs were found in the 38 coral samples analysed from the Flinders Reef coral core between 1915 and 2017 CE.
Stable oxygen and carbon isotopes (δ18O, δ13C)
The Flinders coral core FLI02A has been previously analysed for a variety of geochemical proxies at 5-year resolution (Figure S4; Calvo et al., 2007; Pelejero et al., 2005). The 5-yearly average δ18O indicated a trend towards more negative values between 1708 and 1992 CE while 5-yearly average δ13C data indicated minor fluctuations between 1708 and 1850 CE. Post-1850 CE, δ13C showed a clear decline that accelerated post-1970 which may be attributed to the Suess effect. The δ18O anomalies between FLI01 and FLI02A agree strongly with the long-term trend since 1710 CE, with only minor differences in several decades (Figure 7a and b). Both long cores also overlap with δ18O anomalies of core FLI05. Thus, δ18O anomalies appear relatively homogeneous across the entire North Flinders Reef system. FLI01 coral δ18O shows a long-term decrease which peaks in the 1970s followed by an increase. FLI05 coral δ18O oscillates between positive and negative anomalies between 1988 and 2017 CE falling into the range of FLI01 coral δ18O. FLI01 and FLI05 individual and composite coral δ18O have no statistically significant correlation with local ERSSTv5 (15–18°S, 146–150°E; Huang et al., 2017), yet statistically significant with regional ERSSTv5 to the east, southeast and northwest Pacific. FLI01 and FLI05 composite coral δ18O is negatively correlated with local (15–18°S, 146–150°E) and regional precipitation-evaporation balance from 20th century reanalysis data (r = −0.25, p < 0.001, N = 175; similar for FLI01 alone).
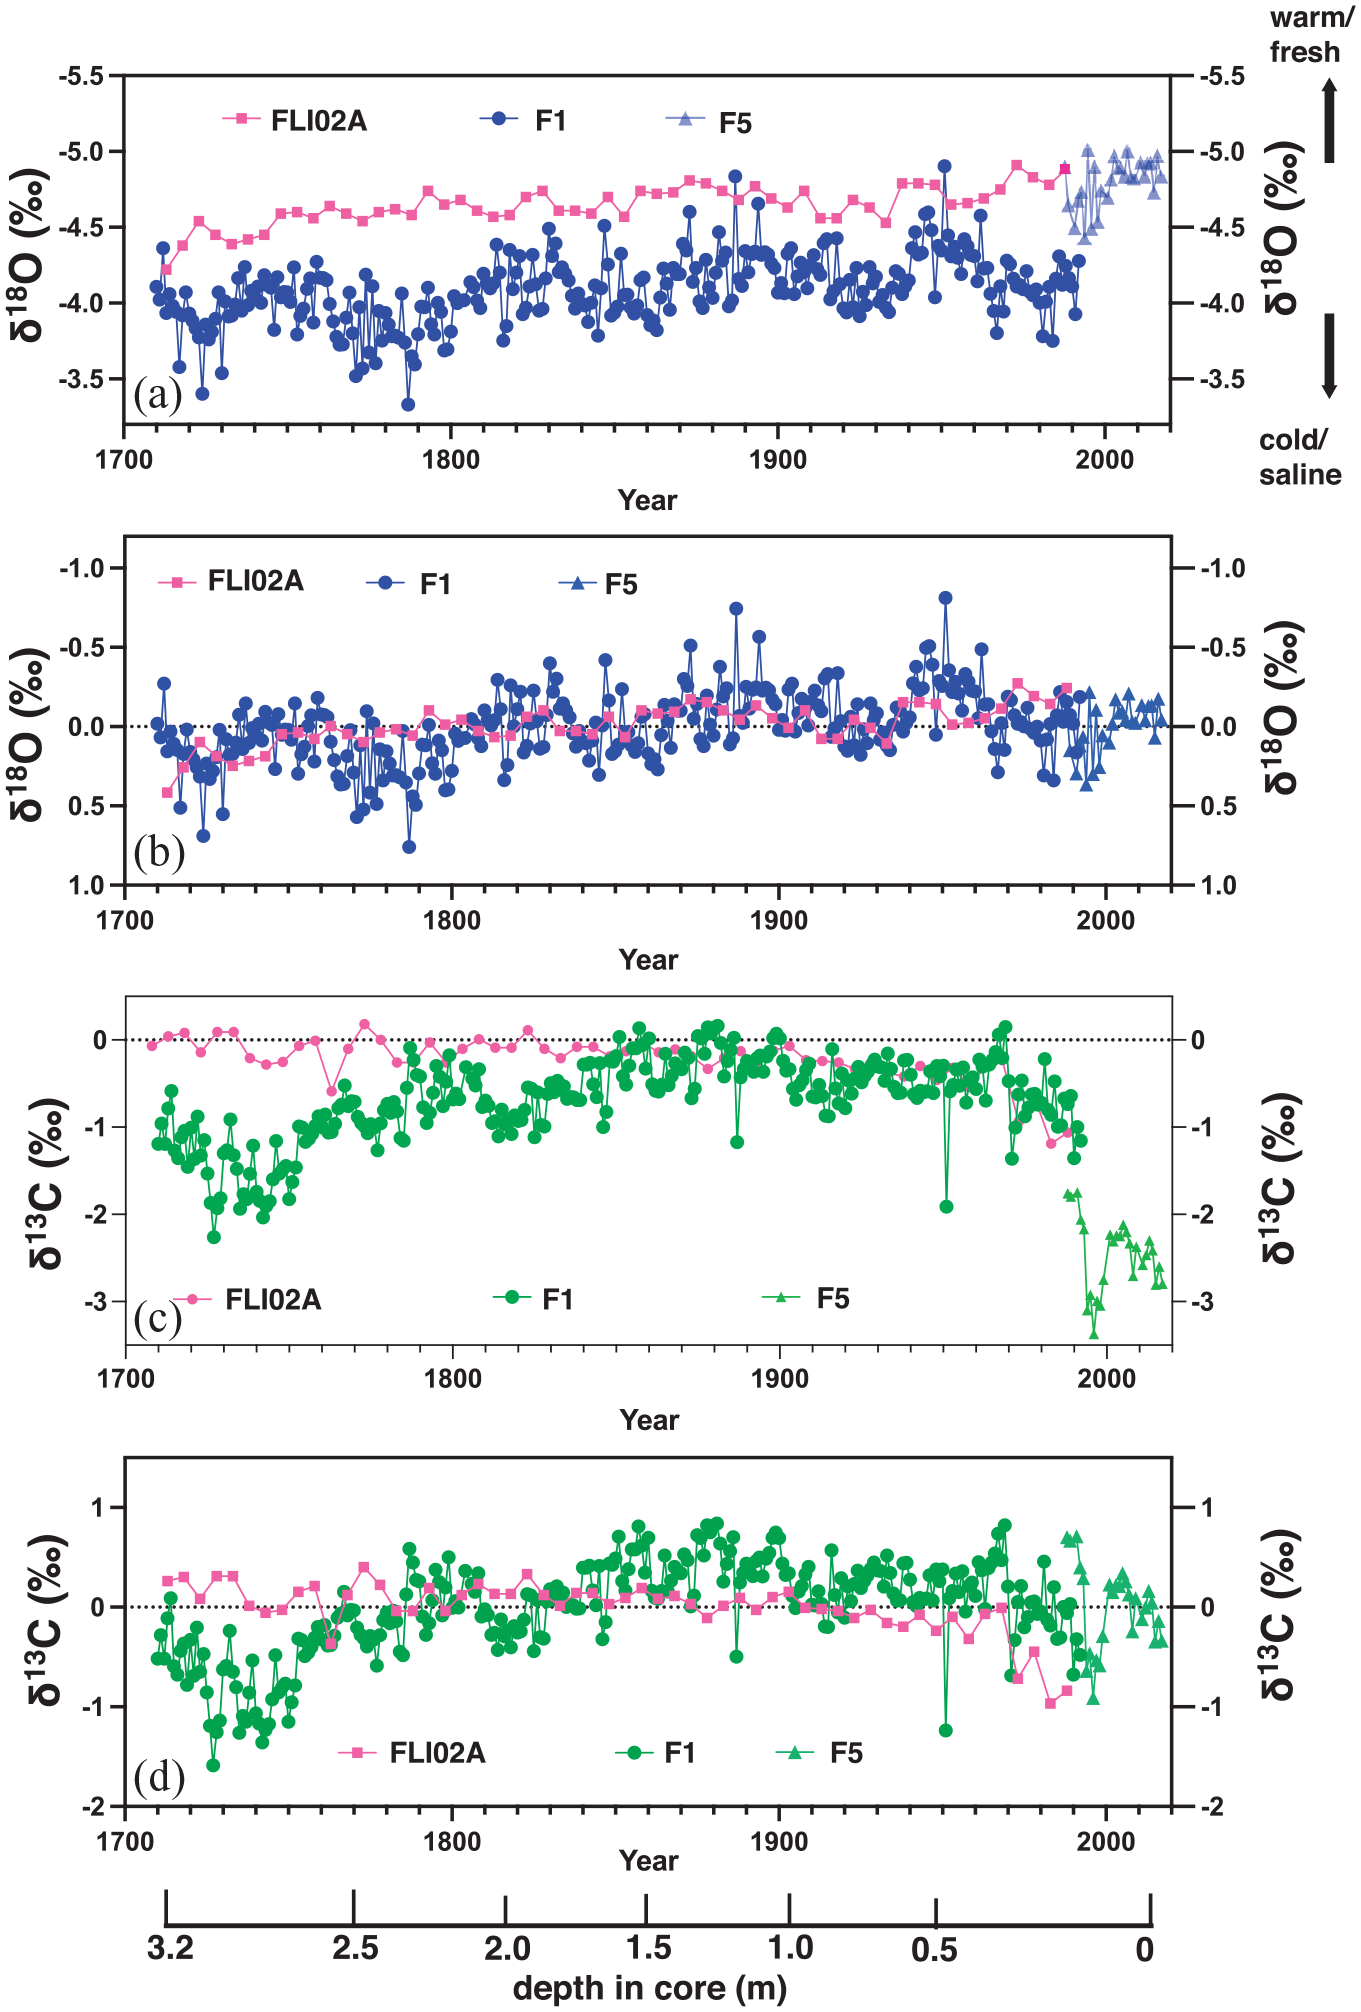
Comparison of (a and b) oxygen isotopes (δ18O) and centred δ18O anomalies, respectively, between Flinders Reef cores FLI02A, FLI01A (F1) and FLI05A (F5). The arrows indicate warm/fresh and cold/saline conditions inferred from δ18O. (c and d) as in (a and b) yet for comparison of carbon isotopes (δ13C) and centred δ13C anomalies, respectively. Depth in core (in m) indicated and years in Common Era (CE). Reproduced in colour in online version.
In this study, we also analysed the mean annual variations in δ13C between 1710 and 2017 CE in cores FLI01 and FLI05 (Figure 7). F1 δ13C shows a long-term increase between 1710 and 1850, reaching a plateau between 1850 and 1883 and decreasing thereafter to the present (Figure 7c). Interestingly, FLI01 δ13C indicates a decrease in the decade of intense volcanic eruptions for the 1784/85 eruption of Laki, 1809 unknown, 1815 Tambora and the 1883 Krakatoa eruption. FLI05 coral δ13C shows high δ13C anomalies in the late-1980s and mid-1990s, a rapid drop to low δ13C between 1997 and 1999, followed by an increase. The range in annual mean δ13C of cores FLI01 and FLI05 is similar. The comparison between δ13C-centred anomalies in cores FLI01, FLI02A and FLI05 revealed that the most significant difference between the FLI01 and FLI02A cores was observed in the 18th century (Figure 7d). Here, FLI01 was sampled along growth axes that were oriented at an angle (Figure. 3). The years between 1710 and 1750 CE show low δ13C values in FLI01 not seen in FLI02A. Here, it becomes apparent that growth-related anomalies related to physiological changes of the individual corals and/or living depth have likely impacted FLI01 δ13C. The most likely cause for lower δ13C in FLI01 is lower photosynthetic rates of the coral host due to lower light levels in the sections oriented at an angle from vertical upward growth. Both FLI01 and FLI02A show the the long-term decrease in δ13C over the 20th century with an acceleration in the 1970s. The latter is most likely related to the Suess effect through enhanced uptake by the surface oceans of δ13C depleted fossil fuels. The trend in δ13C between 1880 and 1992 CE was −0.5 ± 0.09‰ (p < 0.001) in FLI01 and in FLI01/05 composite between 1880 and 2017 CE. The most significant decrease in coral δ13C occurred post-1964 (trend −0.78 ± 0.20‰ in FLI01 (p < 0.001) and −0.3 ± 0.16‰ (p = 0.06) in FLI01/05 composite). FLI02A coral δ13C decreased commencing around 1883 CE (trend since 1883 = −0.8 ± 0.14‰) with an acceleration in 1970 (−0.5 ± 0.35‰; p < 0.001).
Coral skeleton-bound stable nitrogen isotopes (CS-δ15N)
The CS-δ15N obtained on the core FLI01 revealed an overall decrease from 1710 to 1992 CE with values ranging from 8.7 ± 0.45‰ (1710–1720) to 7.6 ± 0.35‰ (1982–1992) with a slope of −0.5 ± 0.04‰ century−1 (r = −0.75; p < 0.001). Two phases can be recognised on the record, a phase of steady decline between 1710 and 1954 CE (−0.6 ± 0.06‰ century−1; r = −0.77; p < 0.001) followed by a phase characterised by stable CS-δ15N values from 1955 onwards (1955–1992, 0.07 ± 0.5‰ century−1; r = 0.02; ns) centred at 7.6 ± 0.36‰ (Figure 8). A decadal cyclicity with an amplitude of 15‰ can be seen in the annually resolved section of the record (1940–1992 CE). The decadal cyclicity is absent from the earlier section of the record where samples represent 3–6 years, likely ‘smoothing’ the record and preventing the identification of decadal fluctuations. On their overlapping sections (1988–1992 CE), cores FLI01 (7.3 ± 0.06‰) and FLI05 (6.2 ± 0.34‰) showed a 1.2‰ offset. The record from FLI05 showed stable CS-δ15N values over the period 1988–2017 CE (−0.95 ± 0.7‰ century−1; r = 23; ns) centred at 6.3 ± 0.06‰ (Figure 8). The annually-resolved core FLI05 displayed an interannual cyclicity with an amplitude of ~1.4‰, similar to that of core FLI01. The nitrogen content is shown in Figure S3.
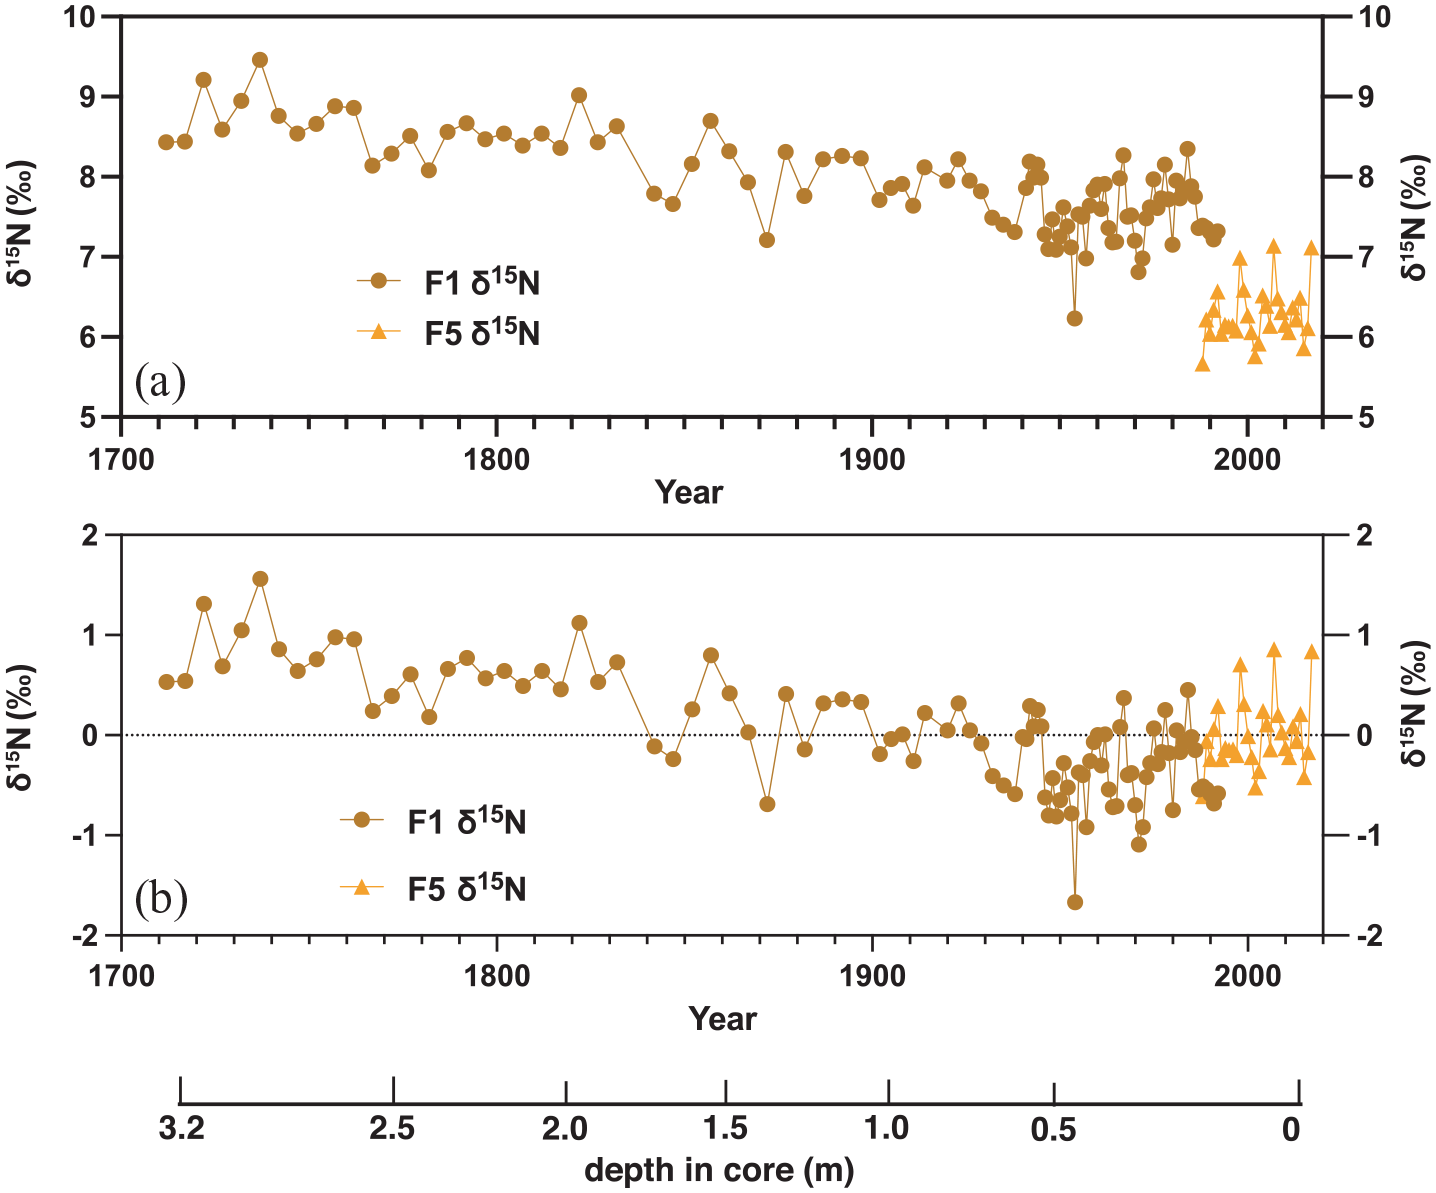
Coral skeletal δ15N (a) and centred δ15N anomalies (b) for Flinders Reef coral cores FLI01A (F1; dark orange) and FLI05A (F5; light orange). Samples pre-1940 were analysed as 3–5 years averages. Depth in core (in m) indicated and years in Common Era (CE). Reproduced in colour in online version.
Trace elements (Sr/Ca, Mg/Ca, Ba/Ca)
Previous analysis of 5-year average Sr/Ca ratios revealed low values (warm SST) in the early 1700s and in the last two decades (1976–1992 CE; Figure S4). Higher Sr/Ca ratios were recorded in-between, indicating overall colder conditions. Between 1850 and 1992 CE, the Sr/Ca ratios indicate a warming trend.
In this study, we analysed the mean annual variations in Sr/Ca, Ba/Ca and Mg/Ca (Figure S5) ratios between 1710 and 2017 CE. The between-colony offset between cores FLI01 and FLI05 Sr/Ca ratios was 0.067 mmol mol−1 with FLI01 showing a lower mean Sr/Ca (9.07 mmol mol−1; 1SD = 0.055 mmol mol−1). FLI01 Sr/Ca is dominated by centennial variability with lowest Sr/Ca ratios between 1730 and 1780 and 1950 and 1992 CE, with higher Sr/Ca ratios (colder conditions) between 1780 and 1950 (Figure 9). The highest Sr/Ca ratios in FLI01 are observed between 1885 and 1920 CE. Core FLI05 has a mean Sr/Ca ratio of 9.13 mmol mol−1 (1SD = 0.045 mmol mol−1) and indicates an increase in Sr/Ca following the warm 1997/98 El Niño year (an extreme El Niño year) until 2012 and then a reversal to lower Sr/Ca ratios until 2016 (an extreme El Niño year). 2017 CE shows higher Sr/Ca ratios than 2016, thus a colder annual SST.
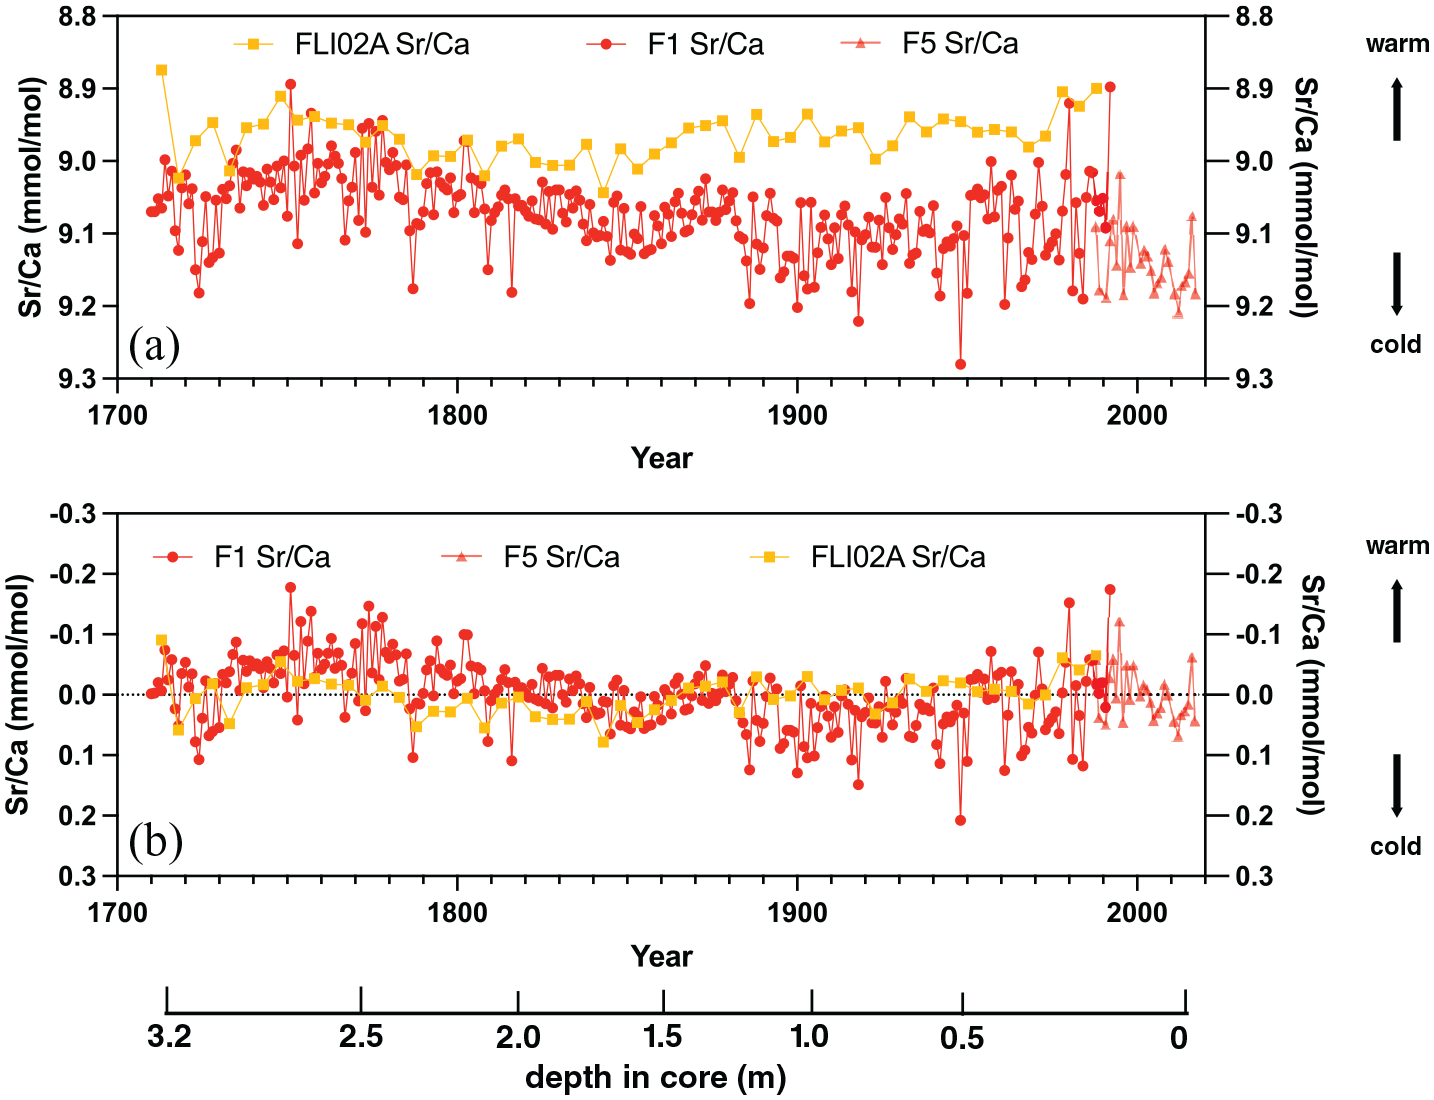
Sr/Ca ratios (a) and Sr/Ca centred anomalies (b) from cores FLI01A (F1; dark red), FLI05A (F5; light red) and FLI02A (dark yellow). Depth in core (in m) indicated and years in Common Era (CE). Reproduced in colour in online version.
We have centred all Sr/Ca datasets from FLI02A, FLI01 and FLI05 to facilitate comparison between interannual to centennial variability (Figure 9). The two long time series of FLI02A and FLI01 agree on centennial variability and both indicate lowest Sr/Ca ratios between 1730 and 1780 and between 1950 and 1992 CE with higher Sr/Ca ratios in-between. Core FLI01 Sr/Ca anomalies are lower than FLI02A between 1720 and 1810, in a similar range between 1810 and 1900 and mostly higher between 1900 and 1992 CE. Core FLI05 Sr/Ca anomalies oscillate in a range similar to core FLI01 and FLI02A Sr/Ca anomalies in the 1980s.
Mean Ba/Ca in FLI01 is 4.12 ± 0.93 µmol mol−1 and Ba/Ca ratios range between 3 and 5 µmol mol−1 with individual peaks >5 µmol mol−1 (Figure 10). FLI01 shows a weak increase in the Ba/Ca baseline starting in 1850 CE. Core FLI05 has a mean Ba/Ca of 7.04 ± 1.83 µmol mol−1, significantly higher than FLI01. FLI05 Ba/Ca also shows larger interannual variability ranging between 4 and 12 µmol mol−1 without a long-term trend (Figure 10).
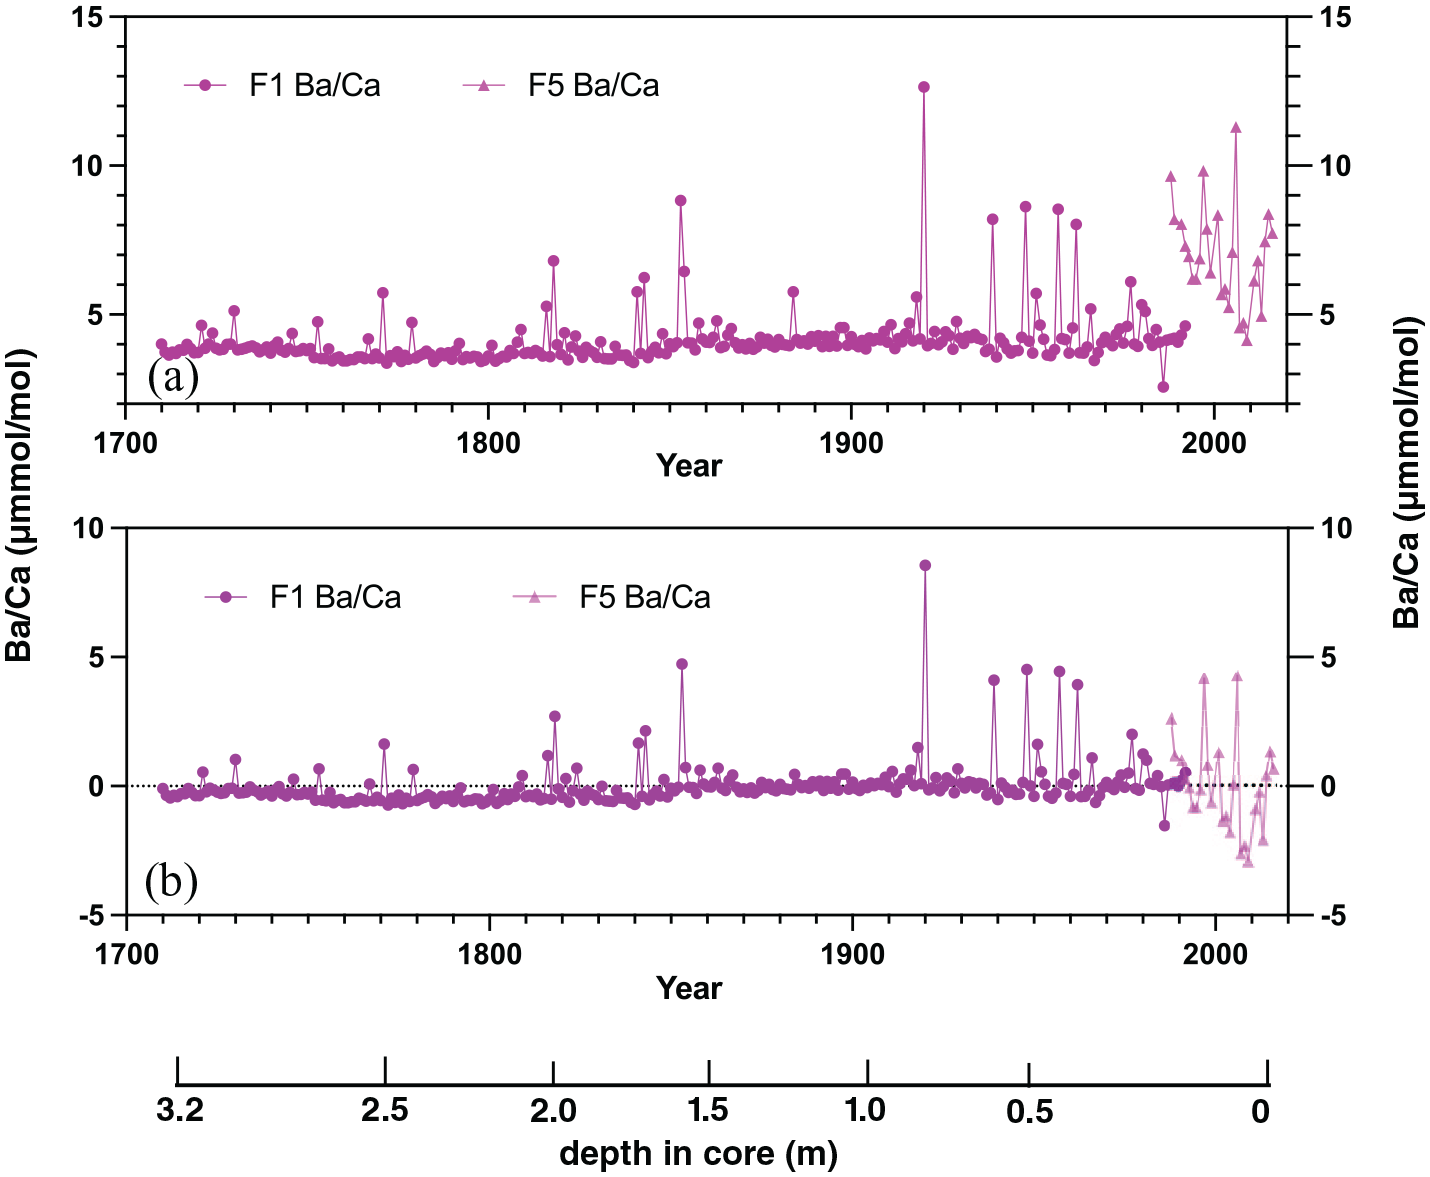
Ba/Ca ratios (a) and Ba/Ca centred anomalies (b) from cores FLI01A (F1; dark purple) and FLI05A (F5; light purple). Depth in core (in m) indicated and years in Common Era (CE). Reproduced in colour in online version.
Ocean pH from boron isotopes
Levels of boron isotopes in coral carbonate record changes in the internal pH of the coral calcifying fluid in close correspondence with ocean pH (Pelejero et al., 2005; Figure S4). The available 5-year average δ11B for Flinders Reef (core FLI02A) is dominated by strong decadal variability throughout the record ranging between 7.95 and 8.2 with a small, but insignificant trend towards lower values (Figure S4). The lowest pH level since 1708 is recorded around the year 1988 CE.
Mercury concentrations
Mercury concentrations in the samples of the coral cores are low and range between below detection values and 0.4 ng g−1. The highest concentrations were observed in 1929, 1996 and 2016 (Table S3; Figure 11; Figure S6). The higher Hg levels in 2016 CE could be affected by Hg uptake in the organic tissue zone which covers the upper mm of the core. Core FLI01 showed no significant trend in Hg levels between 1929 and 1992 CE while core FLI05A is dominated by strong interannual variations (grey dots in Figure 11).
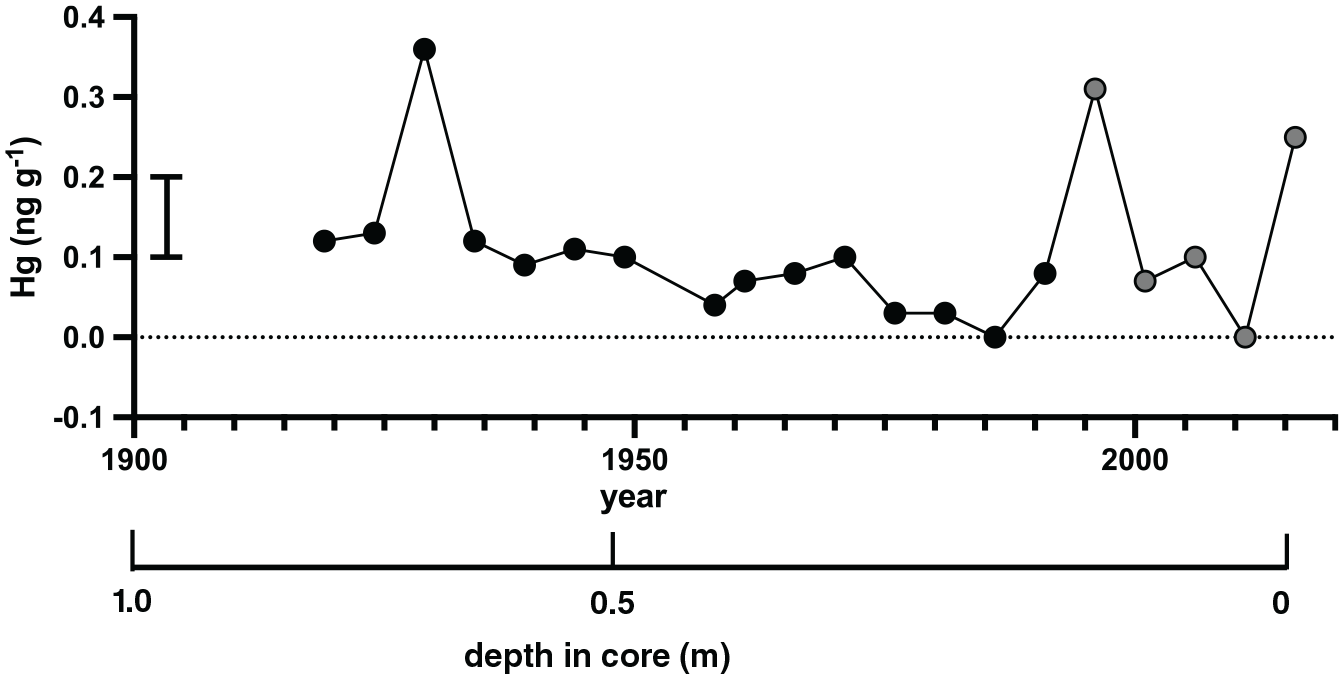
Mercury distribution in coral cores FLI01A (F1; black filled circles) and FLI05A (F5; grey filled circles) between 1919 and 2016. Standard deviation of the blanks indicated by black bar. Depth in core (in m) indicated and years in Common Era (CE).
Discussion
The geochemical signatures in the Flinders Reef corals are summarised in Figure 12 (Figure S9). Atmospheric nuclear bomb testing by-products (14C, 239+240Pu) show clear increases coinciding with testing periods while 137Cs and 241Am are not present at detectable levels or only at extremely low levels in 1965 CE, respectively. Coral F14C shows a first increase above pre-bomb levels in 1952 and an acceleration in 14C uptake between 1957 and 1959 reaching peak values in 1980 CE. Therefore, the proposed GSSP based on the 14C signal in core FLI01A is 1958 CE at 36.9 cm in core (Figure 3; Figure S8). The Flinders 14C record agrees with several 14C time series from the Great Barrier Reef which showed an increase in 14C in 1959 CE reaching a plateau between the late 1970s and 1982 before declining to the present-day (Druffel and Griffin, 1995, 1999; Wu et al., 2021a). The rapid increase in surface ocean 14C in the 1950s recorded by the corals was primarily driven by enhanced CO2 gas exchange with the atmosphere due a large 14C gradient between air and sea in response to the bomb-derived 14C. Ocean dynamics started to dominate in the late 1970s with a lowered 14C air-sea gradient (Wu et al., 2021a). The continuing decline in coral 14C post-1980 is aided by ongoing dilution of the atmosphere with fossil fuel carbon free of 14C (the Suess effect; Keeling, 1979). The GBR coral records indicated that the East Australian Current fed by the South Equatorial Current (SEC) is the dominant water mass source to the southern GBR delivering high 14C water (Wu et al., 2021a). Coral 14C time series from the southwest Pacific influenced by SEC ocean transport follow a similar trajectory (Druffel and Griffin, 1995; Fallon et al., 2003; Guilderson et al., 2000, 2004; Toggweiler et al., 1991). Next to Masthead island, the Flinders 14C records agree also well with coral 14C from Fiji which testifies to the importance of high 14C water transport by the southern branch of the SEC (not shown; Toggweiler et al., 1991). Coral 239+240Pu activity confirmed the impact of nuclear weapons testing in the 1950s (1954, 1958 CE) mainly attributed to US Pacific Proving Grounds testing peaking in the mid-1960s, while 1966 (Aldebaran test) may be related to testing in French Polynesia (Buesseler, 1997; Lindahl et al., 2011). The 239+240Pu activity in Flinders Reefs corals is lower than in northwest Pacific coral sites most likely due to its greater distance from the US Pacific Proving Grounds (Lindahl et al., 2011). Post 1966, 239+240Pu activity decreased by 1980, yet less abruptly than the global fallout Pu signal (similar to trends observed in Guam corals) and may indicate residual Pu in seawater by ocean current transport from close-in fallout regions potentially related to testing in French Polynesia and China (Lindahl et al., 2011). However, although the radiogenic signals provide a precise time marker for nuclear weapons testing, their signal was not associated with a lasting environmental impact other than labelling the ocean with radiogenic signatures. Spheroidal carbonaceous particles were not detected in the corals while mercury had no significant trend testifying to the generally pristine environment at Flinders Reef.
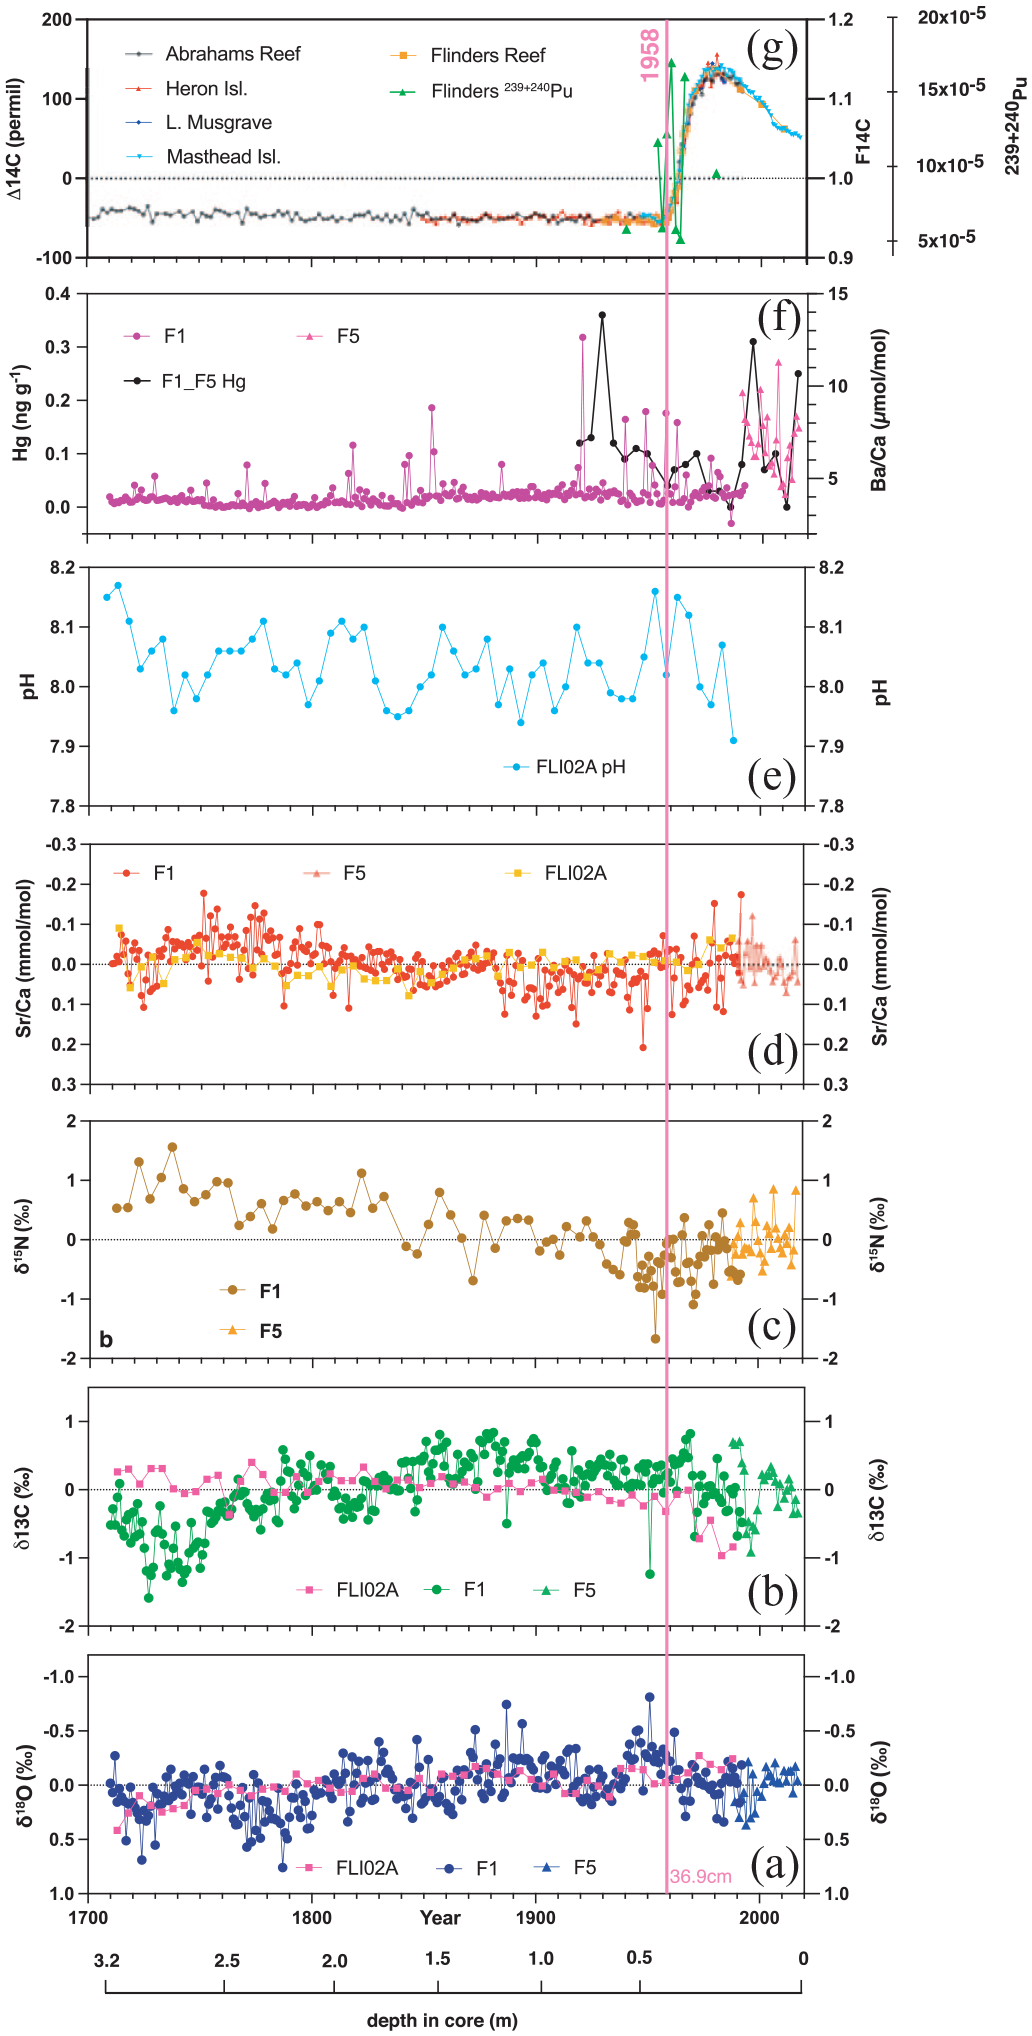
Flinders Reef geochemical signatures for cores FLI01A (F1), FLI02A (Calvo et al., 2007; Pelejero et al., 2005) and FLI05A (F5). All proxies in (a–e) plotted as centred anomalies. (a) oxygen isotopes, (b) carbon isotopes, (c) nitrogen isotopes, (d) Sr/Ca ratios, (e) reconstructed pH (Pelejero et al., 2005), (f) Ba/Ca ratios and mercury and (g) radiocarbon (F1/F5 = orange) and plutonium concentrations (F1/F5 = light green). Most significant change point in radiocarbon indicated by grey dotted line. Depth in core (in m) also indicated and years in Common Era (CE). Reproduced in colour in online version.
Coral δ13C shows centennial variability likely influenced by growth effects in the 18th century section, and with a progression to lower values starting in 1880 and accelerating post-1970. We interpret the 18th century coral δ13C as reflecting growth in slightly deeper water with lower light levels and therefore lower photosynthetic activity in combination with kinetic effects from coral growth (Grottoli, 1999). Once the coral FLI01 matured and reached vertical upward growth, the δ13C signature stabilised at higher δ13C values before declining post-1880 CE (trend since 1880 −0.5‰ in FLI01 and in FLI01/05 composite). The latter trend to negative δ13C is most likely in part related to the Suess effect resulting from burning fossil fuels (Keeling, 1979; Swart et al., 2010). The most significant decrease in coral δ13C occurred post-1970 (trend −0.8 ± 0.20‰ in FLI01 and −0.3 ± 0.16‰ in FLI01/05 composite). However, FLI02A did not show low coral δ13C in the 18th century as core FLI01 did, and so was likely less impacted by growth-related fractionation. Core FLI02A from the northwest side of North Flinders Reef showed a clear decrease in coral δ13C commencing around 1883 CE (trend since 1883 −0.80 ± 0.14‰) with an acceleration similar to FLI01 in 1970 (−0.5 ± 0.35‰ in FLI02A). Thus, 1970 CE appears to show a regionally consistent change to lower coral δ13C in the Flinders Reef region.
Intercolony offsets were observed in all isotope (δ18O, δ13C, CS- δ15N, δ11B) and trace element (Sr/Ca, Ba/Ca, Mg/Ca) proxy data between the two Flinders corals including the previously published FLI02A records (Calvo et al., 2007; Pelejero et al., 2005). The intercolony variability may point to local environmental differences (oceanography, upwelling, bathymetry, seabird presence/absence etc.) or a combination with vital effects on trace element and stable isotope uptake into the corals. However, proxies for SST (Sr/Ca; this study; Calvo et al., 2007), salinity (δ18O; this study; Calvo et al., 2007) and pH (δ11B; Pelejero et al., 2005) are dominated by prominent centennial, multidecadal and decadal variability. For instance, Calvo et al. (2007) suggested that Flinders Reef is influenced by significant decadal to centennial SST variability most likely related to Pacific Decadal Oscillation (PDO) and Interdecadal Pacific Oscillation (IPO) variability (Henley, 2017; Power et al., 1999). The latter are known to be driven by trade wind variability in the Pacific driving South Equatorial Current transport. Flinders Reef coral temperature proxies (Sr/Ca, δ18O) indicate prominent centennial variability with equally warm conditions in the 18th and late-20th centuries (Figure S7(a)). The centennial variability reflects the observed mean annual SST variability in instrumental ERSSTv5 for the Flinders Reef grid (Figure S7(a); Huang et al., 2017). The decadal variations in coral δ18O also largely agree with the salinity variability suggesting a role for salinity in driving coral δ18O. Coral δ18O in FLI01 and FLI05 agrees with the trend in salinity data from SODA 2.2.4 ocean reanalysis since 1871 although the uncertainties in salinity data may be rather large (Figure S7(b); Carton and Giese, 2008; Giese and Ray, 2011). Calvo et al. (2007) suggested a link of pH with salinity on interdecadal time scales whereby periods of low lagoonal flushing and longer water residence times would be associated with higher salinities, lower pH and increased CO2 buildup and vice versa for high flushing periods. Since the new FLI01 and FLI05 δ18O data largely agree with the FLI02A record, a similar relationship may be expected with pH. Nevertheless, several coral δ18O records from the southwestern Pacific have shown the importance of the PDO and IPO driving SST and salinity variability on interdecadal time scales (e.g. DeLong et al., 2012; Linsley et al., 2015). We will scrutinise the paired Flinders coral Sr/Ca and δ18O data to develop a seawater δ18O reconstruction in a companion paper to further develop the salinity reconstruction.
The apparent decadal cyclicity in CS-δ15N observed in both cores suggests that the sources and processes controlling the composition of the nitrate pool in the Coral Sea is highly dynamic and deserves further attention. Identification of the isotopic ratio of the potential N-sources (upwelling of Sutropical Mode Water (STMW); remineralised organic matter deriving from N-fixation; Sigman et al., 2009; Yoshikawa et al., 2015) affecting Flinders Reef is key to deciphering the CS-δ15N records. The mean CS-δ15N of FLI05 (6.3 ± 0.06‰) is identical to the δ15N-NO3 of STMW (6.3‰) suggesting that the main nitrate source at this site derives from the STMW (Yoshikawa et al., 2015). Interpretation of the FLI01 records is more complex since it involves the contribution of a N-source presenting a higher δ15N than the STMW end-member (6.6‰) to explain the elevated CS-δ15N values observed in the early 1700s (8.7 ± 0.45‰). Flinders Reef is under the influence of the westward flowing South Equatorial Current that connects the Subtropical Southern Pacific Gyre to the Coral Sea (Figure 1). As such, any change in the δ15N-NO3 within the Subtropical Southern Pacific Gyre or/and any change in the latitude of the bifurcation of the North Vanuatu/North Caledonian jets may significantly alter the isotopic composition of the nitrate pool in the Coral Sea by advecting high δ15N-NO3 STMW into the Coral Sea (Deutsch et al., 2014; Zhai et al., 2014; Figure 1).
In summary, our data confirm the prominent decadal variability in coral δ18O, δ13C, CS-δ15N, δ11B and Sr/Ca reflecting SST, salinity, nutrient transport and fossil fuel carbon uptake at Flinders Reef. This prominent decadal variability was observed in all proxy records from Flinders Reef with the possible exception of Hg and Ba/Ca. It remains unclear however, whether these changes are driven by natural climate variability or a response of the Earth system to anthropogenic changes.
Conclusions
The Flinders Reef corals are unique in the suite of proposed Anthropocene Global boundary Stratotype Section and Point (GSSP) sites since they are living organisms that produce aragonite exoskeletons which can be well preserved in the rock record for thousands of years. Corals provide highly accurate and precise (<±1 year) internal chronologies and this makes them arguably the best dated GSSP archive. The Flinders Reef corals have recorded tremendous environmental and climatic change since 1710 CE which includes temperatures, salinities, nutrient dynamics, pollution metals and radiogenic tracers of nuclear weapons testing. Not all proxies showed significant change in the mid-20th century. For instance, the historical temperature changes (from coral Sr/Ca) did not reveal a mid-20th century signature, rather strong centennial and decadal variability with two prominent warm periods in the mid-18th century and end of 20th and start of 21st century. However, other proxies like δ13C, could be related to CO2 uptake by surface oceans in response to fossil fuel burning after taking into account growth related effects in the early life history of coral growth. To conclude, based on our analysis of Flinders Reef corals we propose that the GSSP would be placed in 1958 CE in core FLI01A at 36.9 cm in core (see Figure S8 for detail) and based on the markers 14C and 239+240Pu supported by secondary markers that show significant change around 1958 CE: δ15N (1955 CE; increase), δ18O (1958 CE; increase after long-term decrease) and δ13C (1970 CE; decrease). However, the exact mechanisms responsible for the mid-20th century changes in these parameters have to be scrutinised in further detail.
Supplemental Material
sj-docx-2-anr-10.1177_20530196221142963 – Supplemental material for North Flinders Reef (Coral Sea, Australia) Porites sp. corals as a candidate Global Boundary Stratotype Section and Point for the Anthropocene Series
Supplemental material, sj-docx-2-anr-10.1177_20530196221142963 for North Flinders Reef (Coral Sea, Australia) Porites sp. corals as a candidate Global Boundary Stratotype Section and Point for the Anthropocene Series by Jens Zinke, Neal E Cantin, Kristine L DeLong, Kylie Palmer, Arnoud Boom, Irka Hajdas, Nicolas Duprey, Alfredo Martínez-García, Neil L Rose, Sarah L Roberts, Handong Yang, Lucy R Roberts, Andrew B Cundy, Pawel Gaca, James Andy Milton, Grace Frank, Adam Cox, Sue Sampson, Genevieve Tyrrell, Molly Agg and Simon D Turner in The Anthropocene Review
Research Data
sj-xlsx-1-anr-10.1177_20530196221142963 – for North Flinders Reef (Coral Sea, Australia) Porites sp. corals as a candidate Global Boundary Stratotype Section and Point for the Anthropocene Series
sj-xlsx-1-anr-10.1177_20530196221142963 for North Flinders Reef (Coral Sea, Australia) Porites sp. corals as a candidate Global Boundary Stratotype Section and Point for the Anthropocene Series by Jens Zinke, Neal E Cantin, Kristine L DeLong, Kylie Palmer, Arnoud Boom, Irka Hajdas, Nicolas Duprey, Alfredo Martínez-García, Neil L Rose, Sarah L Roberts, Handong Yang, Lucy R Roberts, Andrew B Cundy, Pawel Gaca, James Andy Milton, Grace Frank, Adam Cox, Sue Sampson, Genevieve Tyrrell, Molly Agg and Simon D Turner in The Anthropocene Review
Footnotes
Acknowledgements
We acknowledge the traditional owners of the sea country in which this research and monitoring was conducted, and in particular the Meriam people, and pay our respects to their elders, past, present and emerging. Analysis of the North Flinders Reef cores was facilitated by the collaborative research project between the University of Leicester and the Anthropocene Working Group (AWG) to define the stratigraphic Anthropocene. The AWG is co-ordinating the assessment of candidate GSSP sites in collaboration with the Haus der Kulturen der Welt (HKW, Berlin) in the framework of its long-term project Anthropocene Curriculum. The Anthropocene Curriculum is an international project for experimental forms of Anthropocene research and education developed by HKW and the Max Planck Institute for the History of Science (MPIWG, Berlin) since 2013. Sampling in the Coral Sea Marine Park in 2017 was conducted by T.M. DeCarlo and H.B. Harrison with funding from the ARC Discovery Early Career Research Award to H.B. Harrison (DE160101141) under Parks Australia Permit No. AU-COM-2017-386. We thank Dr. Janice Lough from AIMS for her initial support of the project and facilitating sample exchange. J.Z. was supported by a Royal Society Wolfson Fellowship.
Funding
The author(s) disclosed receipt of the following financial support for the research, authorship, and/or publication of this article: The geochemical analysis was supported by funding from the Haus der Kulturen der Welt Berlin. Sampling in the Coral Sea Marine Park was conducted by T.M. DeCarlo and H.B. Harrison with funding from the ARC Discovery Early Career Research Award to H.B. Harrison (DE160101141) under Parks Australia Permit No. AU-COM-2017-386. Sampling of the 1992 Flinders Reef core was funded by the Australian Government through coring by the Australian Institute of Marine Science. A.M-G acknowledges funding for the coral-bound nitrogen isotope measurements from the Max Planck society (MPG) and the DFG Priority Program SPP2299 (Project number 468591845). N.D. acknowledges funding from the Paul Crutzen Nobel Prize Fellowship.
Supplemental material
Supplemental material for this article is available online.
References
Supplementary Material
Please find the following supplemental material available below.
For Open Access articles published under a Creative Commons License, all supplemental material carries the same license as the article it is associated with.
For non-Open Access articles published, all supplemental material carries a non-exclusive license, and permission requests for re-use of supplemental material or any part of supplemental material shall be sent directly to the copyright owner as specified in the copyright notice associated with the article.