
Abstract
Background
Diagnosis of celiac disease is difficult when the combined results of serology and histology are inconclusive. Studies using flow cytometry of intraepithelial lymphocytes (IELs) have found that celiac patients have increased numbers of γδ IELs, along with a decrease in CD3-CD103 + IELs.
Objective
The objective of this article is to assess the role of flow cytometric analysis of IELs in the diagnosis of celiac disease in difficult cases.
Methods
A total of 312 patients with suspicion of celiac disease were included in the study. Duodenal biopsy samples were used for histological assessment and for flow cytometric analysis of IELs.
Results
In 46 out of 312 cases (14.7%) the combination of serology and histology did not allow the confirmation or exclusion of celiac disease. HLA typing had been performed in 42 of these difficult cases. Taking into account HLA typing and the response to a gluten-free diet, celiac disease was excluded in 30 of these cases and confirmed in the remaining 12. Flow cytometric analysis of IELs allowed a correct diagnosis in 39 out of 42 difficult cases (92.8%) and had a sensitivity of 91.7% (95% CI: 61.5% to 99.8%) and a specificity of 93.3% (95% CI: 77.9% to 99.2%) for the diagnosis of celiac disease in this setting.
Conclusion
Flow cytometric analysis of IELs is useful for the diagnosis of celiac disease in difficult cases.
Introduction
Serological tests, particularly the immunoglobulin (Ig)A tissue transglutaminase antibodies (tTGA), have increased the accuracy of celiac disease diagnosis.1,2 Confirmation of the diagnosis requires in most cases an intestinal biopsy obtained while the patient is on a gluten-containing diet.2–4 Human leukocyte antigen (HLA) DQ2/DQ8 genotyping can be used to exclude celiac disease when both markers are negative1–3 or to strengthen the diagnosis of celiac disease when duodenal biopsies are not going to be performed. 4
Histopathology is assessed on duodenal biopsies using the Marsh-Oberhuber classification.5,6 Typical features of celiac disease include an increase of intraepithelial lymphocytes (IELs), elongation of the crypts and partial to total villous atrophy. 7 Diagnosis of celiac disease is easy when tTGA are increased and duodenal biopsies show villous atrophy. 7 However, roughly 10% of cases are difficult to diagnose because they have mild histological changes or there is a lack of concordance between serology and histology. 7 The first group of patients difficult to diagnose is the one with mild histological changes (Marsh 0–I). Sometimes duodenal biopsy samples do not show any of the histological changes typical of celiac disease (Marsh 0), which could be explained by the patchy nature of the disease,7,8 or by the presence of an ultra-short celiac disease. 9 In other cases there is only an increase in IELs without architectural changes in crypts or villi (Marsh I); this so-called “lymphocytic enteritis” may represent a mild enteropathy celiac disease,10,11 but many cases are not related to celiac disease. 12 Another group of patients difficult to diagnose is the one with crypt hyperplasia and villous atrophy (Marsh II–III) but with normal or only slightly elevated tTGA levels.2,3 In these cases alternative causes of villous atrophy, such as autoimmune enteropathy, immune disorders, infections or drugs, must be ruled out.2,3,13
There is evidence that IELs play an important role in the pathogenesis of celiac disease.14,15 Celiac disease is characterized by an increase in the absolute numbers of CD3+ α/β and γ/δ T-cell receptor-bearing IELs.16,17 The relative number of γ/δ IELs average 4% of all IELs in healthy controls, whereas they represent an average of 25% in celiac patients.18,19 Another abnormality observed in celiac disease is a decrease in a subset of CD3- CD103+ IELs with natural killer (NK) function, 20 which become almost undetectable in active celiac disease.19,21
Flow cytometry is a powerful tool that analyzes the proportions and phenotype of large volumes of heterogeneous individual cells. 22 Flow cytometry is able to determine the proportion of IELs with respect to the total number of cells in the intestinal epithelium. 22 In addition, flow cytometry allows assessing separately the proportion of two subtypes of IELs with respect to the total number of IELs: TcR-γ/δ IELs and CD3– CD103+ “natural killer-like” IELs.19,22 The combined study of the proportion of total IELs (many of them TcR-αβ IELs) and the proportions of TcR-γδ IELs and CD3– CD103+ IELs (the so-called “IEL immunophenotype”) has been used with success in the diagnosis of celiac disease.23,24 The presence of a “celiac IEL immunophenotype” has a nearly 94% sensitivity and specificity in the diagnosis of pediatric celiac disease. 24
There are very few studies on the role of flow cytometry in the diagnosis of celiac disease, and most of them have been done in the pediatric population. The objective of this study was to assess the value of flow cytometry of IELs in the diagnosis of celiac disease. Furthermore, we wanted to assess the value of flow cytometry of IELs in the subgroup of patients considered “difficult to diagnose,” where histological and serological results were in disagreement.
Materials and methods
Patients
Between January 2012 and April 2015, 389 patients from the Departments of Gastroenterology and Pediatrics of Complejo Hospitalario de Toledo in whom duodenal biopsies were sent to the Instituto de Estudios de Mastocitosis de Castilla La Mancha for flow cytometric analysis of IELs were included prospectively in a database. A total of 312 patients from this database from whom duodenal biopsies had been taken to confirm or exclude celiac disease and for whom follow-up information was available were the basis for a retrospective analysis. In our setting, patients are studied in the Pediatrics Department until they reach the age of 14 years old and in the Gastroenterology Department from 14 years old onward. In all celiac patients, data from the clinical records were obtained in order to assess the clinical and serological response to a gluten-free diet.
Diagnosis of celiac disease
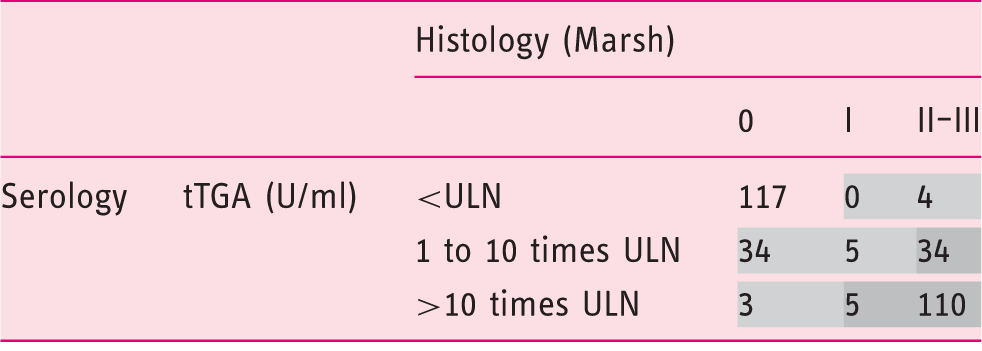
Diagnosis of celiac disease was based on the combination of serological and histological changes, as recommended by several guidelines.1–4 Depending on the histological Marsh score and on the tTGA titers, there were three possible diagnostic categories: (i) No celiac disease: Normal histology (Marsh 0) and negative serology. (ii) Celiac disease: Marsh score II–III and any degree of increase in tTGA titers. Patients with mild enteropathy (Marsh I) were included in this category if they had high tTGA levels. According to several guidelines high tTGA levels are those >10 times above the upper limit of normal.4,25 (iii) “Difficult to diagnose” cases: All the other combinations.
Initial distribution of patients (n = 312) based in the combination of serology (tTGA) and histology (Marsh).
 No celiac disease
  Difficult diagnosis
  Celiac disease
tTGA: immunoglobulin (Ig)A tissue transglutaminase antibodies. ULN: upper limit of normal (in our laboratory the ULN of tTGA is 2.6 U/ml).
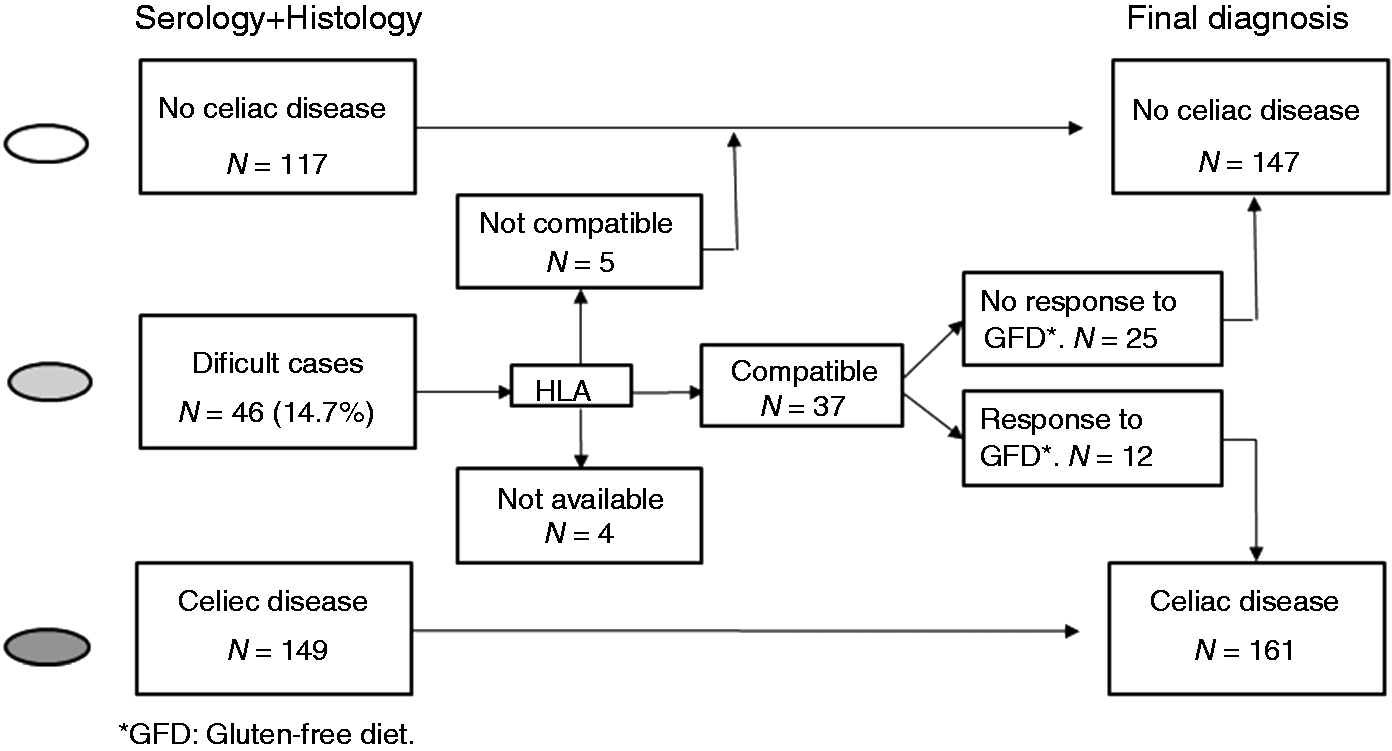
Diagnostic work-up of difficult cases and final diagnosis in 312 patients included in the study. Four cases from the group of difficult cases were excluded because human leukocyte antigen (HLA) typing was not available, leaving a total of 308 patients (191 adult and 117 pediatric patients) for the final analysis.
The study protocol was approved by the Ethical Committee of Complejo Hospitalario de Toledo and all patients (or their parents in case of pediatric patients) gave informed consent prior to the upper gastrointestinal endoscopy.
Celiac serology and HLA typing
Serum tTGA levels were determined using an automated enzyme-linked immunosorbent assay (ELISA) laboratory system (EliA Celikey IgA, Phadia 250, Freiburg, Germany). The upper limit of normal tTGA in our laboratory is 2.6 U/ml. In IgA-deficient patients (four adult and one pediatric patient) serum IgG antibodies against deamidated gliadin peptides (anti-DGP), were determined using the same automated laboratory system with EliA Gliadin DP IgG kits. HLA haplotypes DQ2 and DQ8 were determined by reverse dot blot using CeliacStrip (Operon immune and molecular diagnostics, Zaragoza, Spain).
Histology
Upper gastrointestinal endoscopy was performed in all patients and four biopsy samples were obtained in all cases for histological assessment from the second part of the duodenum, as that was the practical recommendation for celiac disease diagnosis when we started to include patients in the database. Hematoxylin and eosin-stained specimens were examined by a dedicated gastrointestinal pathologist (JRM) who was blinded to the results of serology and flow cytometry. Histological changes were assessed following the modified Marsh criteria.5,6 Duodenal intraepithelial lymphocytosis (>25 lymphocytes per 100 enterocytes) was considered Marsh I, and additional presence of crypt hyperplasia was considered Marsh II. Any degree of villous atrophy was considered Marsh III (IIIa: partial, IIIb: subtotal and IIIc: total villous atrophy, respectively).
Flow cytometric analysis
Two additional biopsy samples were obtained from the second part of the duodenum during upper endoscopy for flow cytometric analysis. In order to avoid spontaneous de-epithelization, samples were placed in cold saline solution and sent immediately to the laboratory. The process of IELs isolation and flow cytometric analysis has been previously described. 27 In order to separate epithelial cells and IELs from the mucosa, biopsies were shaken for 60 minutes at room temperature in Roswell Park Memorial Institute (RPMI) 1640 medium (Sigma-Aldrich) containing 1 mmol/l dithiothreitol and 1 mmol/l ethylenediaminetetraacetic acid and supplemented with 10% fetal calf serum (Gibco), 2 mmol/l L-glutamine and antibiotics (complete medium, CM). The cell suspension was then washed and surface labeled with the appropriate fluorochrome-conjugated monoclonal antibodies (MAb).
The following MAb reagents were used at saturating amounts: fluorescein isothiocyanate-conjugated CD103, (BD Pharmingen, San Jose, CA, USA); phycoerythrin-conjugated TcR-αβ, (Beckmann Coulter (BC), Miami, FL, USA); peridinin chlorophyll protein-cyanine 5.5 conjugated-CD45 (Becton Dickinson Biosciences, (BDB) San Jose, CA, USA); phycoerythrin-cyanine 7-conjugated TcR-γδ (BDB); and allophycocyanin-conjugated-CD3 (BDB). Labeling was performed in a dark room for 30 minutes at 4℃. Six-color flow cytometry acquisition was performed using a FACSCanto cytometer (BDB) and the Infinicyt software (Cytognos) was used for the analysis. For the identification of lymphocytes, a biparametric gate was drawn around IELs according to their low side scatter and high CD45 expression. Densities of TcR γ/δ IELs and CD3–CD103+ IELs expressed as a percentage of the total number of IELs were determined. The results were assessed by an immunologist (LSM) who was blinded to the results of serology and histology.
Statistical analysis
Demographic characteristics of celiac and non-celiac patients were compared using the χ2 test (categorical data) and the Student’s T test (quantitative data). Median and 25th–75th percentiles were used to express the densities of IELs in celiac and non-celiac patients. Differences in densities were assessed by using the Student’s T test. Overall accuracy of histology and IEL immunophenotype as well as the positive and negative likelihood ratio was calculated. A value of p < 0.05 was considered statistically significant. All calculations were performed using STATA/SE version 10.0 software.
Results
Celiac disease was the final diagnosis in 66 adults (43 female; median age: 34 years; range: 14–74 years) and 95 children (54 female; median age: 7 years; range: 0–13 years). There were no significant differences in the sex ratio between celiac and non-celiac patients in the adult nor in the pediatric population. Adult celiac patients were younger than non-celiac adult patients (mean age ± SD: 34.6 ± 12.7 years vs 39.6 ± 16.5 years; p = 0.03), but no such difference was found between celiac and non-celiac pediatric patients (mean age ± SD: 6.8 ± 3.7 years vs 5.7 ± 3.2 years; p = 0.2).
The proportion of γ/δ IELs was significantly increased in celiac compared to non-celiac patients (p < 0.001) and the proportion of CD3– CD103 + IELs was significantly decreased in celiac compared to non-celiac patients (p < 0.001) (Figure 2).
Relative percentage of TcR-γ/δ intraepithelial lymphocytes (IELs) (Panel (a)) and CD3– CD103+ IELs (Panel (b)) with respect to total IELs distributed according to the final diagnosis. Box plots with medians, 25th and 75th percentile and the complete range of IELs.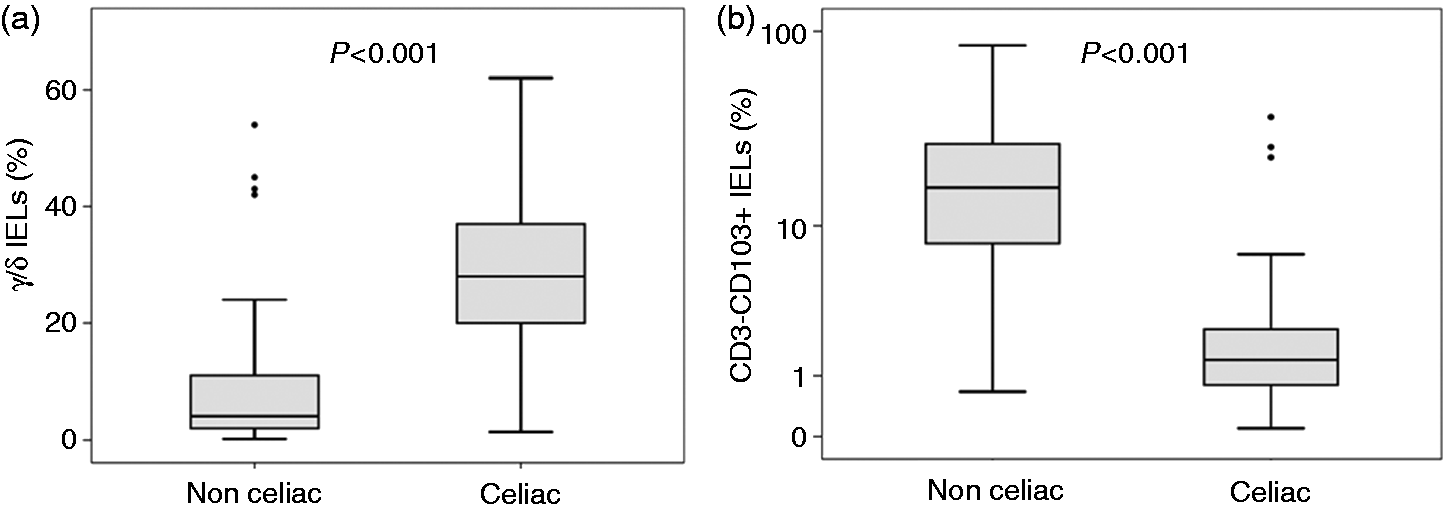
Diagnostic accuracy of histology (Marsh ≥ 2) in suspected celiac disease.
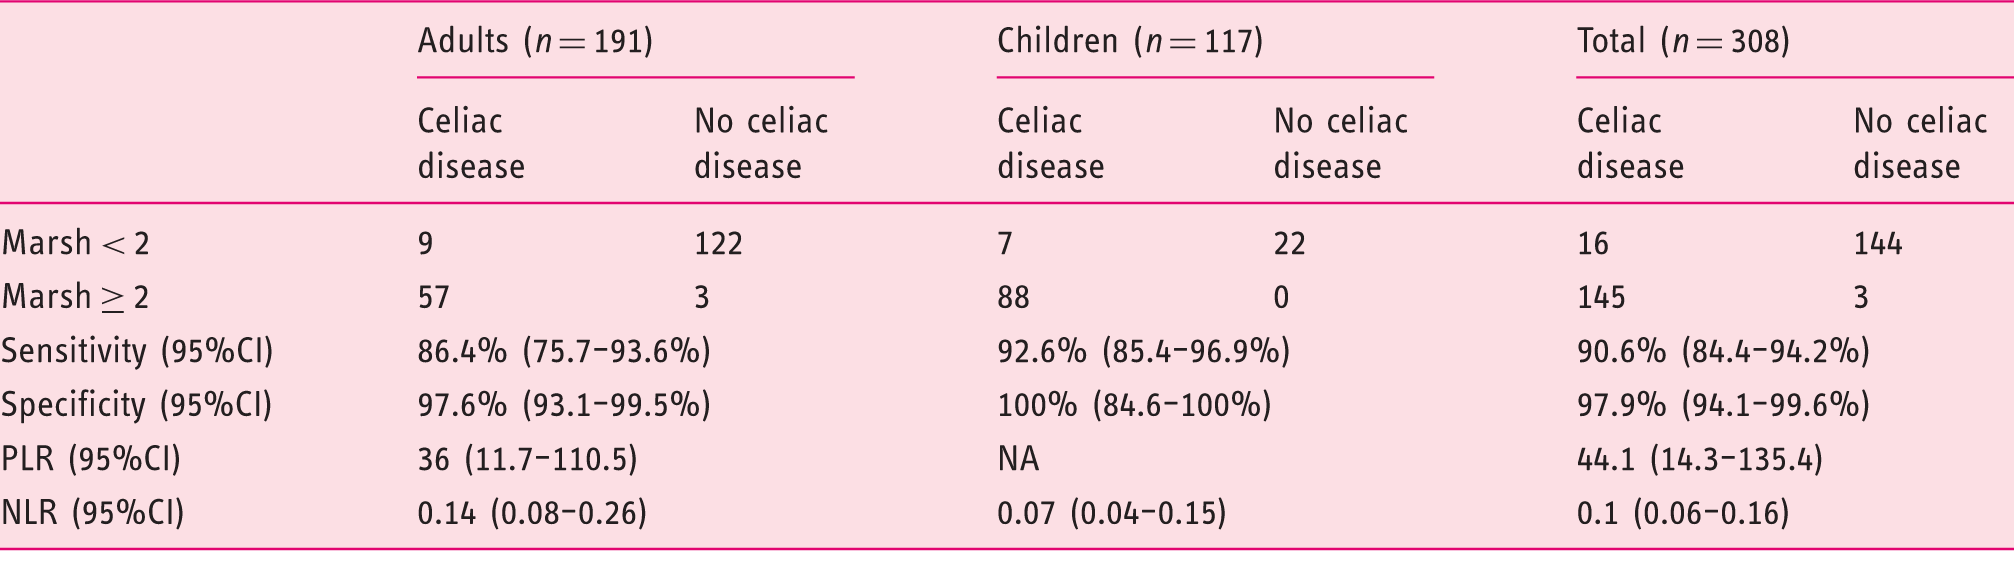
CI: confidence interval. PLR: positive likelihood ratio. NLR: negative likelihood ratio.
Diagnostic accuracy of intraepithelial lymphocyte (IEL) immunophenotype in suspected celiac disease.
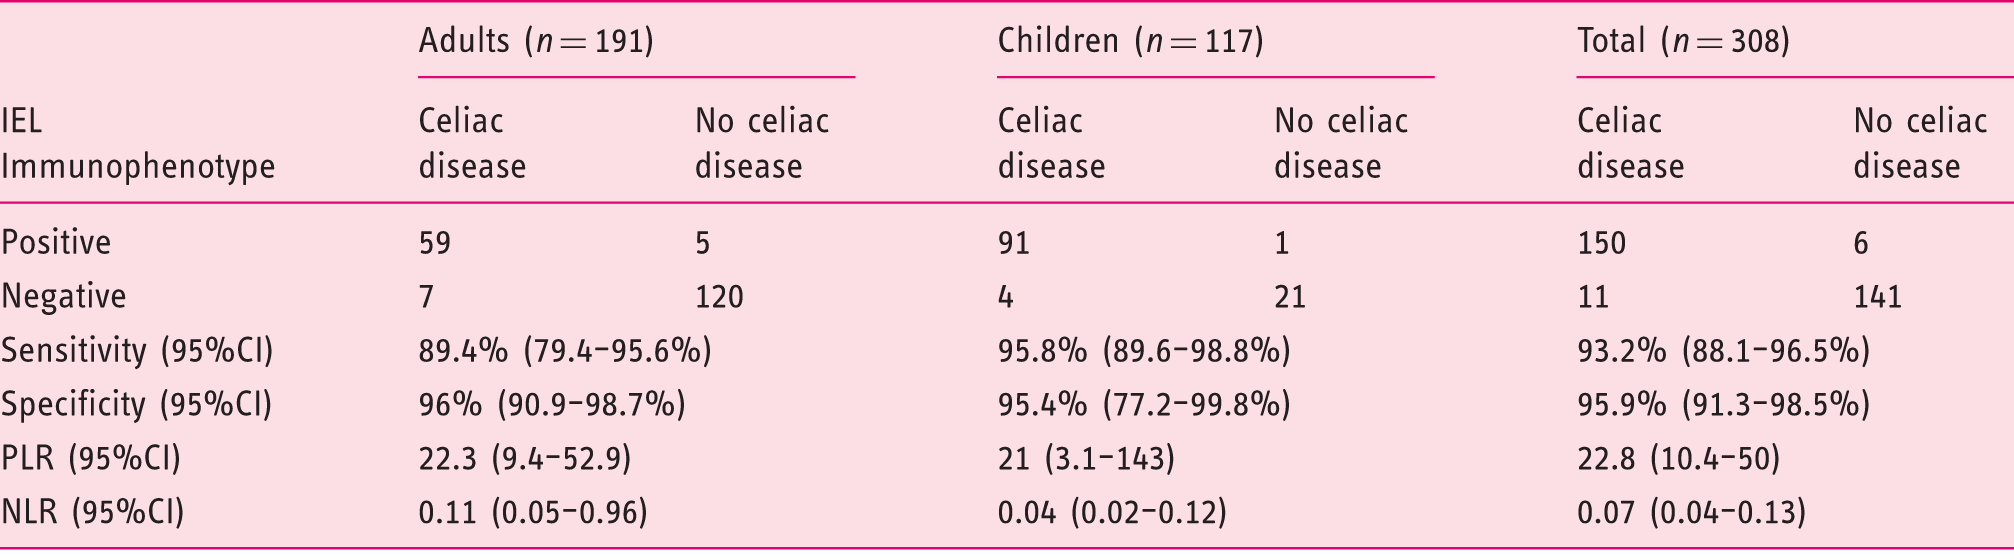
CI: confidence interval. PLR: positive likelihood ratio. NLR: negative likelihood ratio.
Characteristics of “difficult cases” whose final diagnosis was celiac disease (n = 12).
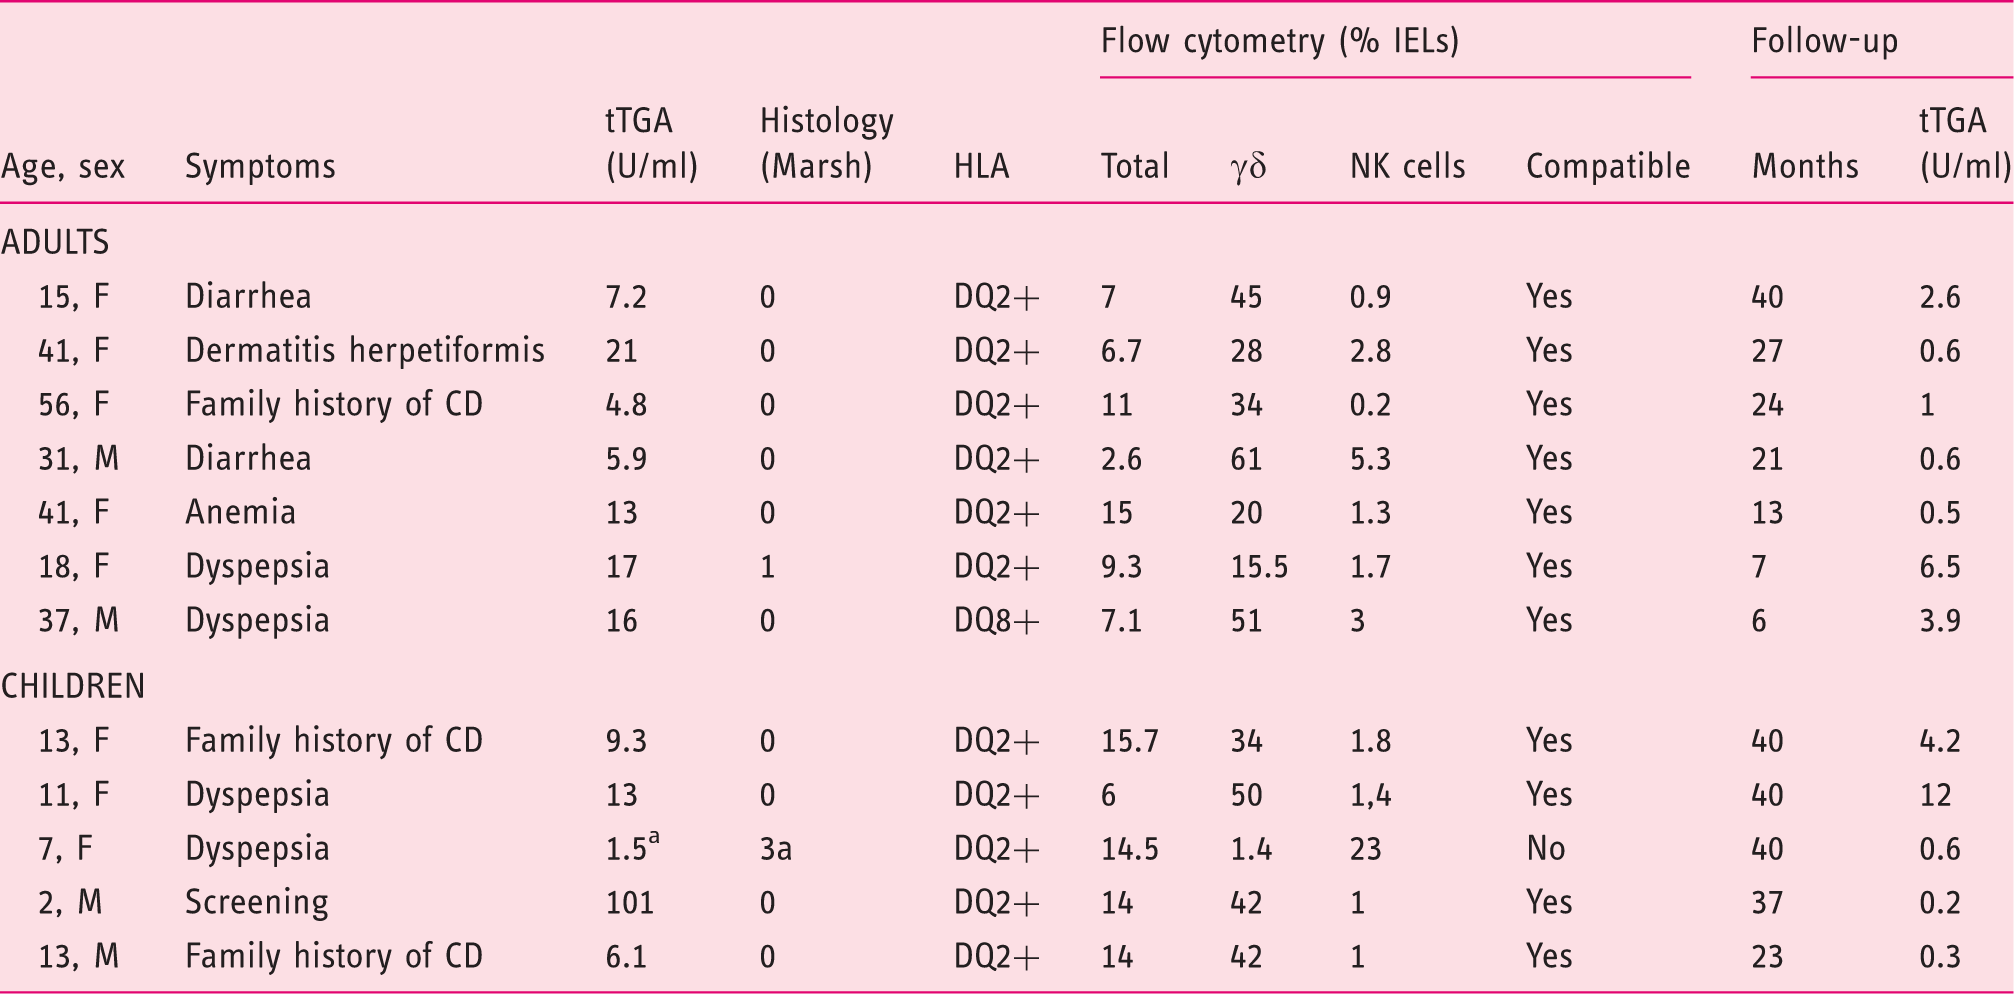
Anti-endomysium positive. IEL: intraepithelial lymphocyte; F: female; M: male; CD: celiac disease; NK: natural killer; TGA: immunoglobulin (Ig)A tissue transglutaminase antibodies; HLA: human leukocyte antigen.
Diagnostic accuracy of intraepithelial lymphocyte (IEL) immunophenotype in the subgroup of patients considered “difficult to diagnose.”
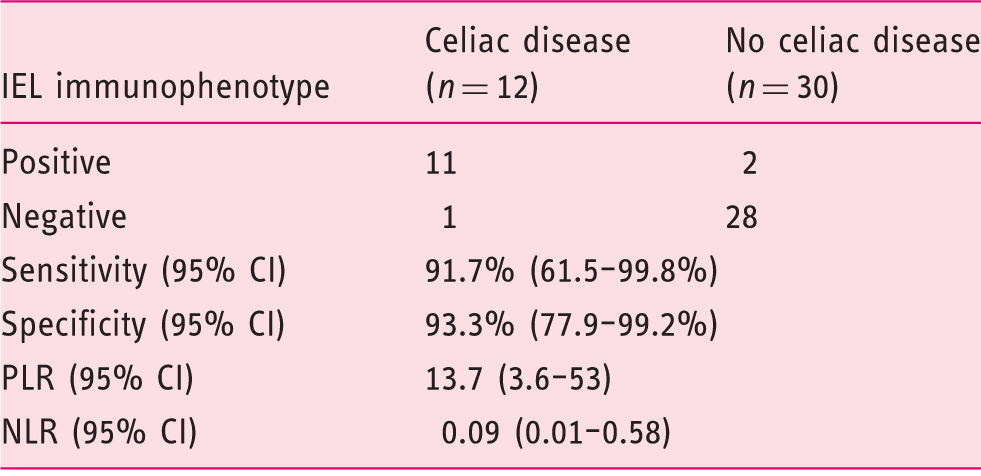
CI: confidence interval. PLR: positive likelihood ratio. NLR: negative likelihood ratio.
Discussion
The prevalence of celiac disease has increased over the last decades. 28 This is due to a real increase in the prevalence of the disease 28 but also to the widespread use of serological tests, mainly tTGA, that have improved the detection of the disease. 29 As a result, the majority patients diagnosed nowadays with celiac disease have only mild atypical symptoms or no symptoms at all. 30 It is not settled whether it is necessary to diagnose all cases of asymptomatic celiac disease. However, diagnosis of silent cases of celiac disease might be of importance for various reasons. First of all, untreated celiac disease is associated with an increased mortality. 31 Gluten-free diet in celiac patients is associated with prolonged survival. 32 In addition, quality of life has been shown to improve in cases of asymptomatic celiac disease when a gluten-free diet is initiated. 33
Diagnosis of celiac disease can be difficult in patients with minimal histological findings. There are several factors responsible for these diagnostic difficulties. Sometimes the disease is patchy and sometimes biopsies are not oriented correctly, so the histological findings are insufficient to reach a diagnosis. Other times biopsies show only intraepithelial lymphocytosis without architectural changes. On the other hand, there are circumstances in which patients start a gluten-free diet on their own or based on the advice of their general practitioner after receiving the serology results. In all these situations, histological changes might not be so clear and additional help from other methods is required.3,4 More than 80% of cases considered “difficult to diagnose” have only slightly elevated tTGA levels (<10 times the cut-off value of upper level of normal) (Table 1). Therefore, difficulties in reaching a diagnosis can be anticipated in most cases before performing the endoscopy and taking duodenal biopsies.
One of the methods that has been used to overcome diagnostic difficulties in celiac disease is the immunohistochemical staining of IELs.12,14,15 Increased numbers of CD3+ IELs in the tip of the duodenal villi has a sensitivity of 84% and a specificity of 88% for the diagnosis of celiac disease. 34 However CD3+ T lymphocytes are increased not only in celiac disease but also in autoimmune disorders, food protein intolerance, parasitic infections, H. pylori gastritis and nonsteroidal anti-inflammatory drug (NSAID) use.12,35 The increase of γ/δ subset of CD3+ IELs is more sensitive and specific for celiac disease,14,34 but immunostaining has to be performed in fresh specimens and therefore is not of routine use. Another method used to overcome diagnostic difficulties in celiac disease is the detection of subepithelial anti-tTGA IgA deposits by double immunofluorescence. 36 This method has a sensitivity and a specificity of 97.5% and 92.3% respectively for the diagnosis of celiac disease. 36
In our study we have investigated the utility of multiparameter flow cytometry in the analysis of IELs, and we have shown it is a very sensitive and specific method to diagnose celiac disease and, more important, IEL immunophenotype allowed a correct diagnosis in 92.8% of the difficult cases.
Flow cytometry of IELs could be an alternative to IEL counting in immunohistochemically stained specimens and to detection of subepithelial tTGA IgA deposits in the subgroup of cases that cannot be diagnosed using only the combination of histology and serology. Multiparameter flow cytometry has several advantages over counting IELs in immunohistochemically stained specimens: It is an observer-independent technique, it allows determining the proportion of IELs in a larger area of mucosa, and it allows the simultaneous analysis of three subsets of IELs (total IELs, γδ IELs and CD3- CD103+ IELs). For that reason, it has a higher specificity and sensitivity in the diagnosis of celiac disease.21,22 Flow cytometry of IELs also fared better than detection of subepithelial tTGA IgA deposits by double immunofluorescence in the diagnosis of celiac disease in patients with lymphocytic enteritis. 37
Our study has some limitations. We used a database including patients from whom duodenal samples for flow cytometry of IELs had been obtained during an upper gastrointestinal endoscopy. The reasons to take samples for flow cytometry were either a clinical suspicion of celiac disease or a decision made by the endoscopist, who thought that the macroscopical aspect of the mucosa was not completely normal. The result is a sample composed mainly of patients with suspicion of celiac disease and with a high prevalence of celiac disease (52.3%).
Another limitation of our study is that biopsy samples were obtained only from the second part of the duodenum, as that was the practical recommendation for celiac disease diagnosis when we started to include patients in the database. This means that patients with ultra-short celiac disease included in this study could not be diagnosed by a combination of serology and histology because duodenal bulb biopsies were lacking. 9 It seems very likely that patients with ultra-short celiac disease have been included in the group of “difficult to diagnose” cases as biopsies taken from the second part of the duodenum were probably normal (Marsh 0). As we have shown in this study, most of the difficult cases (probably including cases of ultra-short celiac disease) have been diagnosed by flow cytometry of IELs performed in samples from the second part of the duodenum. One can speculate that even in cases of ultra-short celiac disease, there are changes in the distribution of IELs that go beyond the duodenal bulb and that can be detected with flow cytometry but not by conventional histology. It is important to keep in mind that histological changes in the duodenal bulb can be due to other factors different from celiac disease. For that reason, a cautious interpretation of duodenal bulb biopsies has been advised recently by some authors. 38 It would be interesting to investigate in the future whether the presence of a compatible flow cytometry of IELs can be used as a support for a diagnosis of ultra-short celiac disease.
Analysis of IEL flow cytometric pattern is not included in any of the guidelines on the diagnosis and management of celiac disease.2–4 However, there are several situations where flow cytometry might be useful. Flow cytometry of IELs could be of great help in the diagnosis of refractory celiac sprue, because it can demonstrate the existence of a monoclonal population of normal-appearing IELs displaying an aberrant immunophenotype. 39 In addition, flow cytometry of IELs could be used when the clinician anticipates difficulties in the diagnosis of celiac disease. One difficult situation is represented by the patient who has started a gluten-free diet before the duodenal biopsy, following suggestions from relatives or friends. In that case the patient needs to maintain a gluten-containing diet and be further evaluated with additional testing.1–4 Another difficult situation is represented by the patient who has only slightly elevated tTGA levels. One has to keep in mind that the tTGA threshold level used in our study was set low in order to increase sensitivity, which is the goal of most screening tests. As a drawback, we had to deal with some false-positive results; the use of ancillary methods such as flow cytometry could be of great help to confirm or rule out the diagnosis of celiac disease in those cases. We think that analysis of IEL flow cytometric pattern could play an important role in these difficult situations. The method is easy to perform and flow cytometers are available in most Hematology Departments at general hospitals.
In conclusion, flow cytometry of IELs has a high sensitivity and specificity for the diagnosis of celiac disease and is especially useful when diagnostic difficulties are anticipated.
Footnotes
Acknowledgments
The authors are indebted to Dr Eva María Andrés Esteban from the Universidad Autónoma de Madrid for her valuable help on statistical analysis and to Dr Garbiñe Roy from the Department of Immunology of Hospital Ramon y Cajal (Madrid) for the critical review of the manuscript and for her valuable suggestions.
Declaration of conflicting interests
None declared.
Funding
This research received no specific grant from any funding agency in the public, commercial, or not-for-profit sectors.