
Abstract
Background
Studies in small groups of patients indicated that splenic volume (SV) may be decreased in patients with celiac disease (CD), refractory CD (RCD) type II and enteropathy-associated T-cell lymphoma (EATL).
Objective
The objective of this article is to evaluate SV in a large cohort of uncomplicated CD, RCD II and EATL patients and healthy controls.
Methods
The retrospective cohort consisted of 77 uncomplicated CD (of whom 39 in remission), 29 RCD II, 24 EATL and 12 patients with both RCD II and EATL. The control group included 149 healthy living kidney donors. SV was determined on computed tomography.
Results
The median SV in the uncomplicated CD group was significantly larger than in controls (202 cm3 (interquartile range (IQR): 154–275) versus 183 cm3 (IQR: 140–232), p = 0.02). After correction for body surface area, age and gender, the ratio of SV in uncomplicated CD versus controls was 1.28 (95% confidence interval: 1.20–1.36; p < 0.001). The median SV in RCD II patients (118 cm3 (IQR 83–181)) was smaller than the median SV in the control group (p < 0.001).
Conclusion
This study demonstrates large inter-individual variation in SV. SV is enlarged in uncomplicated CD. The small SV in RCD II may be of clinical relevance considering the immune-compromised status of these patients.
Keywords
Introduction
Celiac disease (CD) is a chronic autoimmune-mediated enteropathy of the small bowel, caused by exposure to dietary gluten in genetically pre-disposed individuals resulting in villous atrophy. 1 The prevalence of CD is 0.5%–1% in Western countries, North Africa, the Middle East and the Indian subcontinent.1–3 The only accepted treatment in CD is a life-long gluten-free diet (GFD). In less than 1% of CD patients, villous atrophy persists despite a GFD. 4 After exclusion of other, mostly rare, diseases such as collagenous sprue, common variable immunodeficiency, Giardia lamblia and autoimmune enteropathy, these patients are diagnosed with refractory CD (RCD). 5 RCD can be divided in two types based on the absence (type I) or presence (type II) of an intraepithelial lymphocyte population with an aberrant phenotype. 6 This phenotype is characterized by lack of surface CD3 (sCD3) expression, but presence of intracellular CD3 complexes (iCD3). RCD II is now considered as a precursor of enteropathy-associated T-cell lymphoma (EATL), a lymphoma with a poor prognosis.7,8
Splenic atrophy in CD patients has already been reported in a necropsy study in the 1970s. 9 Impairment of splenic function in CD patients has been recognized over the years that was not associated with development of malignant disease.10–15 Similarly, functional hyposplenism can also be found in other diseases such as sickle cell disease and inflammatory bowel disease.16,17
In a pilot study, we observed that patients with RCD II and EATL appeared to have a smaller spleen on computed tomography (CT) than uncomplicated CD patients. 18 Other studies involving small numbers of individuals suggested a small spleen in uncomplicated CD patients as well.19,20
The aim of this study was to evaluate in a large patient cohort whether splenic volume (SV), as measured by CT, is different in subgroups of CD as compared with healthy controls.
Materials and methods
Patients
All CD, RCD II and EATL patients included in this study have been initially diagnosed with CD according to the United European Gastroenterology Week (UEGW) criteria. 21 Indications for CT were assessment of abdominal complaints at diagnosis or follow-up of CD and/or (suspected) RCD II or EATL. Active CD was defined as Marsh III and/or positive serology for antibodies against tissue transglutaminase (TGA) type 2 and/or endomysium (EMA) six months before or after CT. CD in remission was defined as Marsh 0 or I and/or negative serology before or up to six months after CT. Patients were diagnosed with RCD II when other causes of villous atrophy had been excluded and more than 20% of the intra-epithelial lymphocytes showed an aberrant phenotype (sCD3− iCD3+) or when ulcerative jejunitis in CD was diagnosed. 5 The control group included healthy individuals who underwent screening for kidney donation.
Methods
This study was a retrospective study including complicated and uncomplicated CD patients and controls who underwent CT between 2000 and 2013. SV was calculated by two expert radiologists with special interest in CD and scored according to a standard formula: SV = 30 + 0.58 (length × width × height). 22 Body surface area (BSA) was calculated by the formula of Du Bois and Du Bois including height and weight. 23
Statistical analysis
Differences in continuous variables between the different groups were analyzed using the Independent-Samples Kruskal–Wallis Test and the Independent-Samples Mann–Whitney U Test. For categorical variables we used the Pearson Chi-Square test. Differences in SV between the different groups were analyzed using both univariate and multivariate linear regression analysis. For the linear regression analysis, SV was transformed to a logarithmic scale because of the skewed distribution of this variable. The difference in means on the logarithmic scale was the ratio of geometric means after transforming the data back to the original scale. Multivariate linear regression analysis included the potential confounders age, gender and BSA up to one year before or after CT.24,25 We carried out backward linear regression analysis with a p value for removal of 0.1. P values of less than 0.05 were considered to be statistically significant. All statistical analysis were performed using IBM SPSS Statistics Version 20.
This study was presented to the Medical Ethics Review committee of VU University Medical Center. They confirmed that the Medical Research Involving Human Subjects Act (WMO) does not apply to this study and that an official approval of this study by the committee is not required.
Results
Initially, 322 individuals were included in the study. Of these individuals 31 were excluded because of positive CD antibodies together with Marsh 0, I or II (n = 13) or because of negative CD antibodies together with Marsh II or III (n = 18).
Baseline characteristics
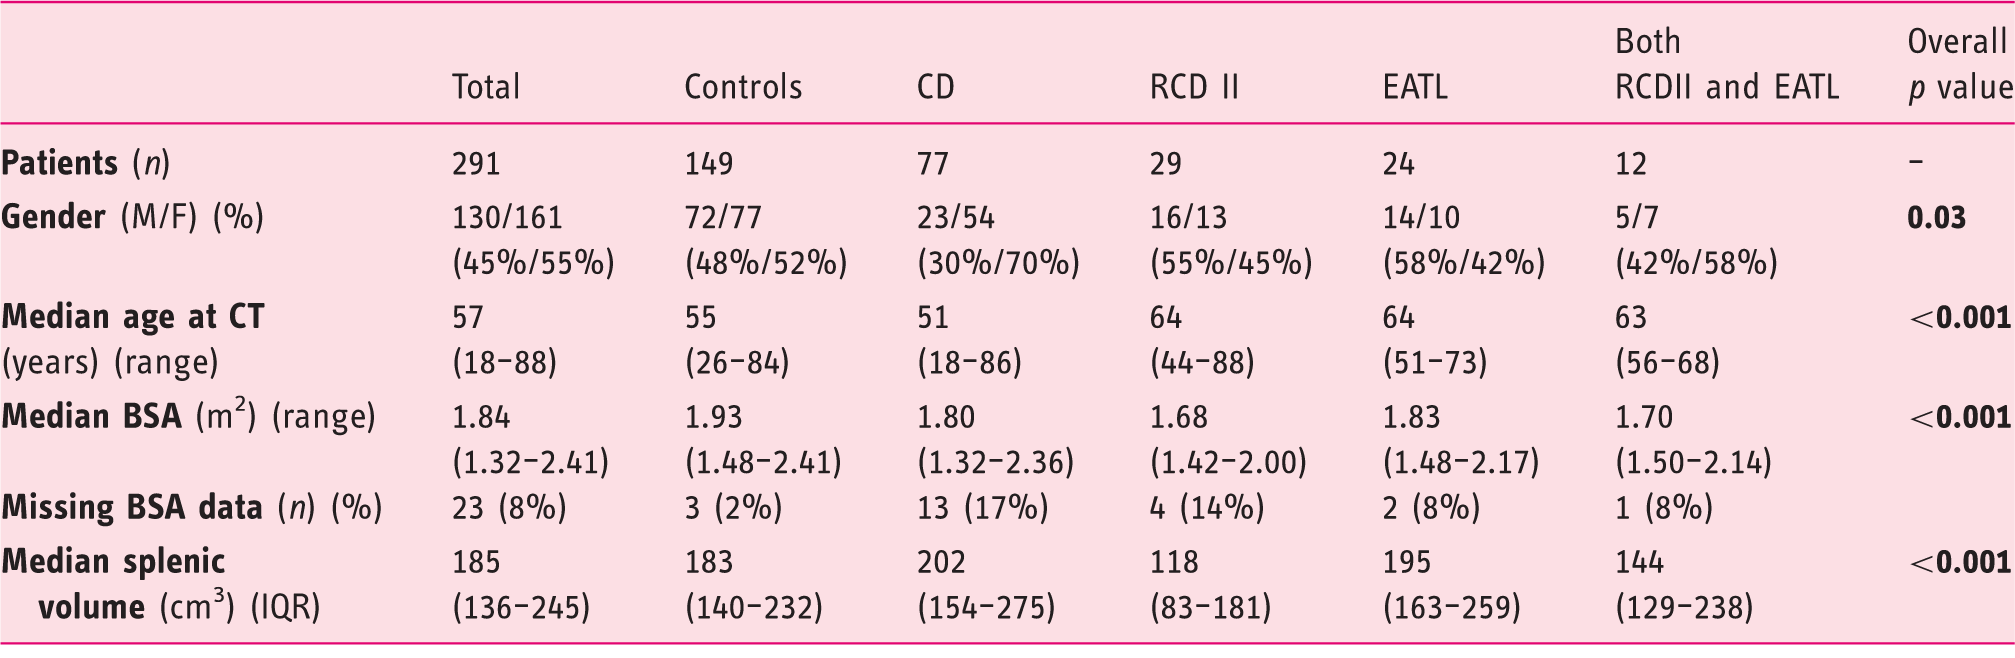
CD: celiac disease; RCD II: refractory celiac disease type II; EATL: enteropathy-associated T-cell lymphoma; M: male; F: female; CT: computed tomography; BSA: body surface area; IQR: interquartile range.
The median SV in the control group was 183 cm3 (IQR: 140–232), versus 202 cm3 (IQR: 154–275) in the uncomplicated CD group (p = 0.020), whereas in the complicated CD group a smaller median SV compared with controls of 162 cm3 (IQR: 114–210) was found (p = 0.026). Subdivision of the uncomplicated CD group showed a median SV of 223 cm3 (IQR: 168–328) in active CD and 192 cm3 (IQR: 143–253) in CD in remission (p = 0.196). Between these two CD subgroups, there was also no significant difference in age (p = 0.409), gender (p = 0.411) and BSA (p = 0.338). Subdivision of the complicated CD group showed a median spleen of 118 cm3 (IQR: 83–181) in RCD II, 195 cm3 in EATL (IQR: 163–259) and 144 cm3 (range: 54–310) in patients with both RCD II and EATL. A smaller spleen was found in RCD II patients without EATL compared both with controls and uncomplicated CD (both p < 0.001), as well as compared with EATL patients with or without RCD II (respectively p = 0.039 and p < 0.001). SV distribution is shown in Figure 1.
Splenic volume (cm3) in different groups.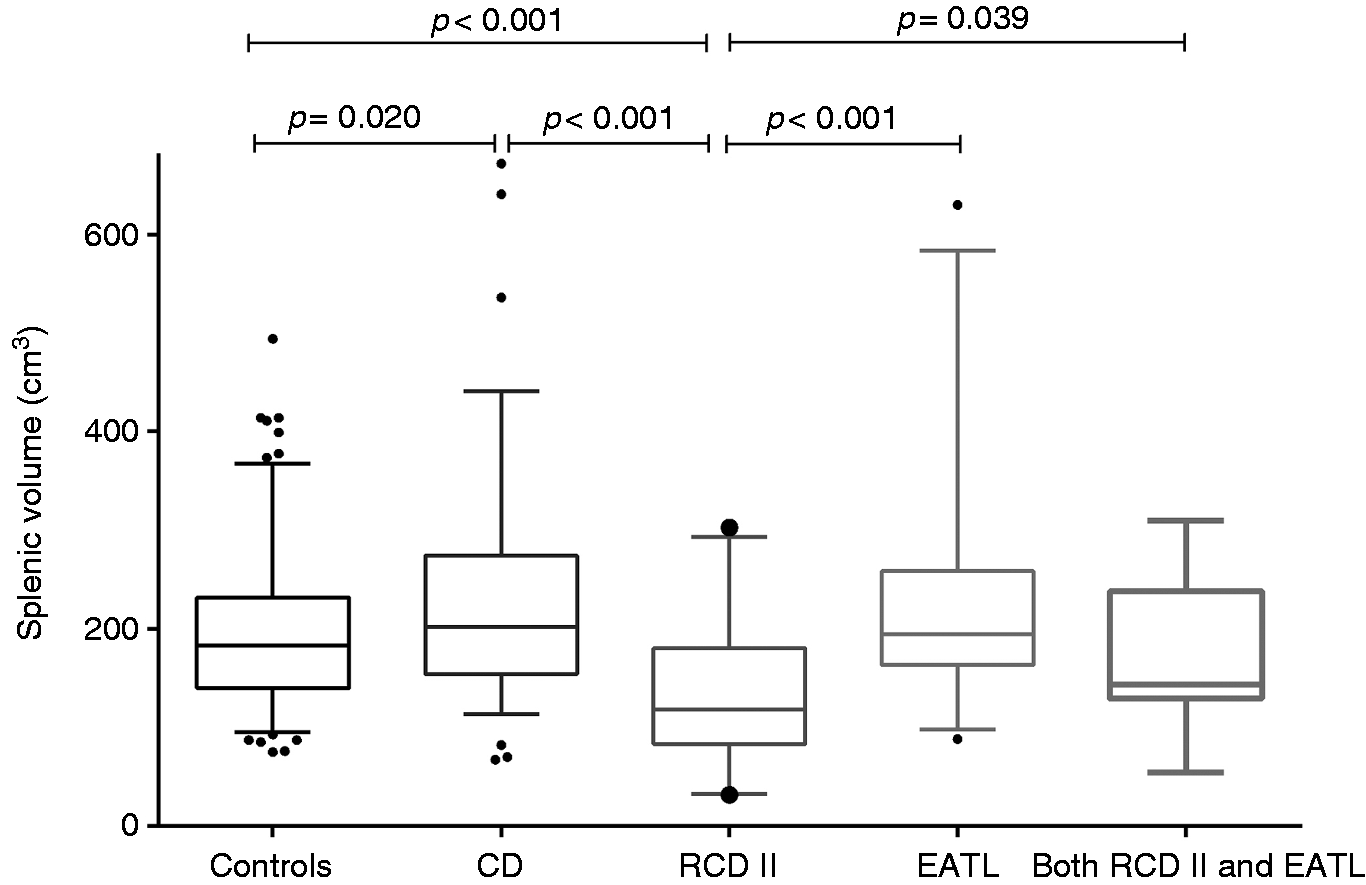
Univariate regression analysis: The relationship between splenic volume and other variables
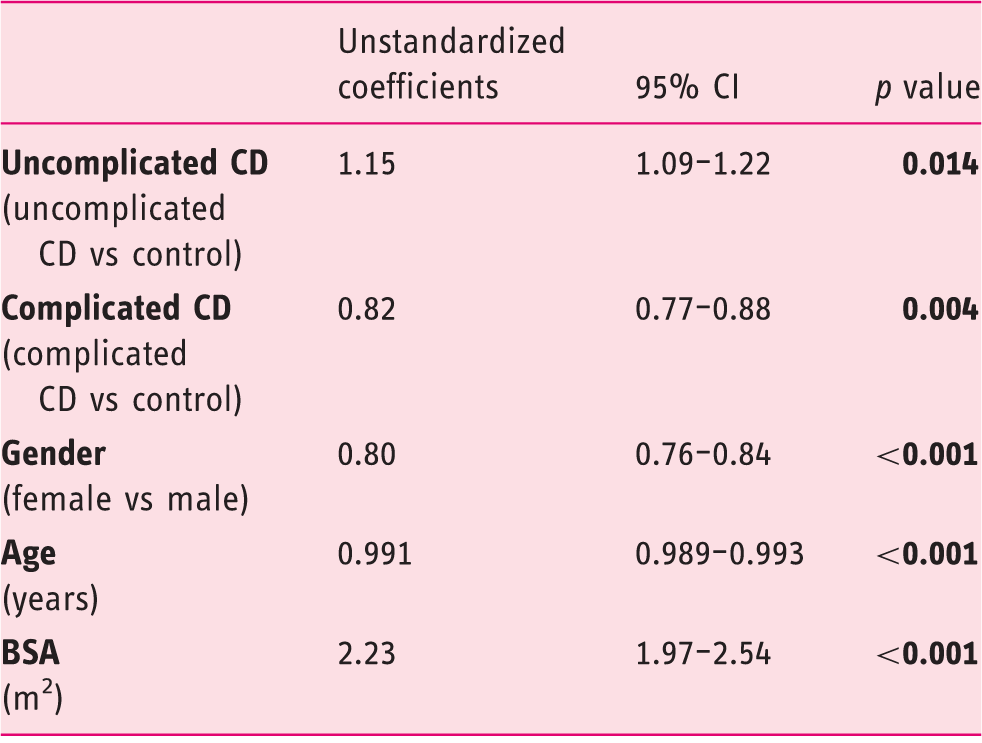
CD: celiac disease; BSA: body surface area; CI: confidence interval.
Multivariate regression analysis: The relationship between splenic volume and other variables
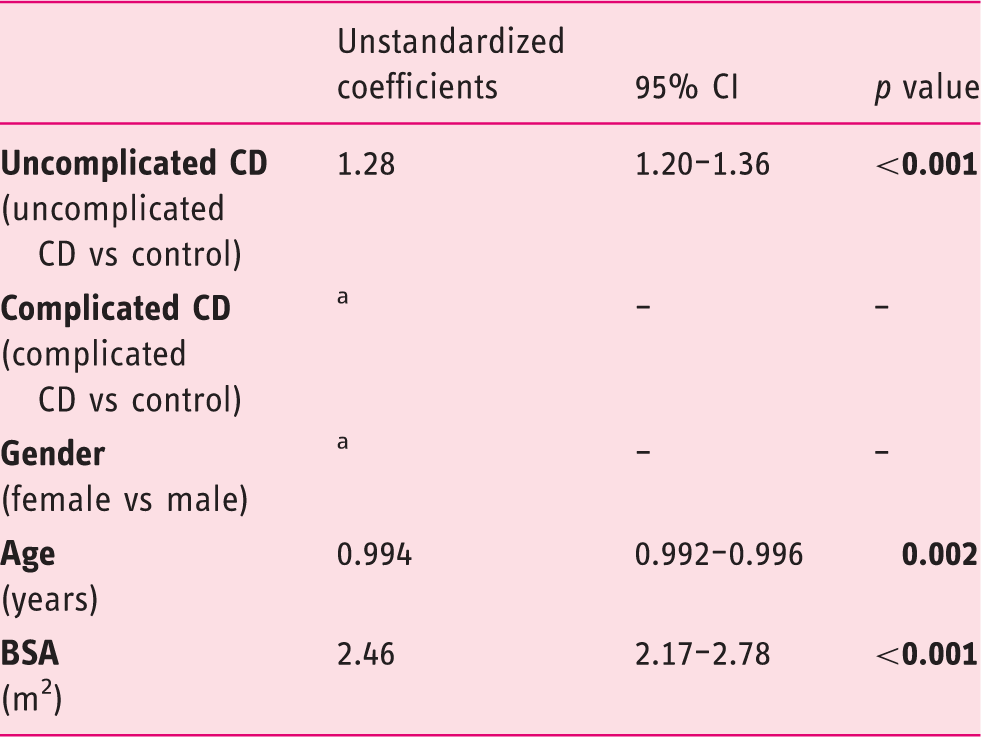
Removed from the model by performing backward analysis.
CD: celiac disease; BSA: body surface area; CI: confidence interval.
Discussion
This study demonstrated large inter-individual variation in SV and the strong positive correlation between BSA in SV as described before.22,25 We observed a significantly larger SV in uncomplicated CD patients when compared with healthy controls, a difference that remained significant after correction for confounders. This is remarkable since both functional hyposplenism and splenic atrophy have been described in CD patients.10–17
The observation of Trewby et al. that CD patients on a GFD for several years had a smaller spleen than CD patients who had just started a GFD was not confirmed in this large data set. 19
RCD II patients, a condition seen as a precursor of EATL, were found to have a smaller SV compared both with controls and uncomplicated CD. This observation may be of clinical relevance considering that these patients are generally considered immune-compromised because of malnutrition, wasting and mucosal immune dysfunction.
The finding of a smaller SV of RCD II patients in the absence of EATL compared with EATL patients with or without RCD II could probably be the effect of the lymphoma since extraintestinal presentations of EATL are common in the spleen. 26
Since it has been reported that SV and splenic function are positively correlated with each other, 27 there might be a correlation between splenic function and celiac disease as well. Our finding that SV did not differ between active CD and CD in remission is remarkably since previous studies have highlighted that a GFD was effective in restoring splenic function, except in CD patients with other autoimmune disorders, RCD and EATL.28,29 Splenic functions include phagocytosis of erythrocytes, recycling of iron, induction of adaptive immune responses and capture and removal of (encapsulated) pathogens. 30 The latter function is achieved by the combination of specific anatomical features together with highly adapted macrophages of the spleen. 31 Therefore, splenic atrophy and thereby impairment of splenic function could lead to an increased risk of infection with encapsulated bacteria such as Steptococcus pneumoniae. Although it is known that CD patients have a higher risk of pneumonia compared both to CD patients vaccinated against streptococcal pneumonia and the general population, there is a low pneumococcal vaccination rate in CD patients. 32
As a consequence of impairment of splenic function, the risk of developing other auto-immune-mediated disease by T-regulatory cell depletion due to splenic dysfunction also increases. 11 It is interesting that a recent study showed that the prevalence of other immune-mediated disorders was high at CD diagnosis (20%) and increased during follow-up with more than half of the patients developing new immune-mediated diseases despite a GFD. 33 Splenic dysfunction can also lead to reduced platelet sequestration and defective removal of pits from erythrocytes. The first might induce thromboembolism, the latter an increase of circulating Howell-Jolly bodies and pitted red cells.11,34
The most important strength of this study is the inclusion of a unique large group of both complicated and uncomplicated CD and healthy controls. Although the RCD II cohort is one of the largest known RCD II cohorts in the literature, it is still too small to correct SV for BSA, age and gender. Further research is necessary to evaluate splenic function both in uncomplicated and complicated CD and how this relates to SV.
Footnotes
Declaration of conflicting interests
None declared.
Funding
This research received no specific grant from any funding agency in the public, commercial, or not-for-profit sectors.